Social Media Customer Service Statistics By Network, Demographics And Facts (2025)
Updated · Sep 24, 2025


Table of Contents
- Introduction
- Editor’s Choice
- Social Media Customer Service Statistics By Network
- Social Media Usage
- The Growing Impact of Social Media On Customer Service
- Global Top Industries In Customer Care Service On Social Media
- Companies On Social Media Customer Service
- American Social Media Customer Care Index
- Customers Prefer Social Media Over Other Channels For Services
- Social Media Customer Service Demographics
- Scaling Customer Support With AI Chatbots
- Conclusion
Introduction
Social Media Customer Service Statistics: In 2024, Social Media has become the primary channel for customer service interactions, with consumers increasingly seeking quick, public, and personalized assistance on platforms like Twitter (X), Facebook, Instagram, WhatsApp, and Messenger. A significant 84% of U.S. consumers who sent customer service requests via social media reported receiving a response. Moreover, 72% of individuals who tweeted a complaint to a brand expected a reply within an hour.
The importance of timely responses is underscored by the fact that 40% of consumers expect a reply within an hour of reaching out through social media. Brands that engage with customers on social media can reduce their cost per contact by up to 83%, highlighting the efficiency of this communication channel. Additionally, companies that respond to customer complaints on social media can experience a 25% increase in brand advocacy. These statistics emphasize the growing significance of social media as a customer service tool, necessitating brands to prioritize responsiveness and engagement to foster customer loyalty and satisfaction.
This article analyzes some of the most important social media customer service statistics for 2024, providing solid figures, percentages, and economic insights.
Editor’s Choice
- 80% of consumers use social media to engage with brands for support, complaints, or feedback.
- 69% of U.S. residents say messaging a company on social media increases brand trust.
- 84% of U.S. consumers receive replies when submitting service requests via social platforms.
- 71% of consumers who have a positive interaction on social media are likely to recommend the brand.
- A 20% to 40% increase in per-customer revenues occurs when the brand interacts with customers on social media.
- 83% can save when social media takes the customer support function, as compared to the traditional way.
- 38% of people expect a reply on social media within 30 minutes, while 68% want to have it within four hours.
- TikTok, Facebook, and Instagram are the leading platforms for customer service during the peak season.
- However, X (Twitter) remains the easiest way for quick and public complaint management, with 64% liking its messaged approach better than calling.
- It is the second-favourite social networking site after Facebook when it comes to customer service, with 35% of consumers in the United States using it.
- Only 13% of customer service DMs on social media are responded to by bots, while the majority of these are by humans.
- In simple terms, 61% of users prefer self-service, whereas 55% contact AI chatbots for brand assistance.
- 68% of consumers would avoid using a chatbot again if their very first interaction ended in disaster.
- 34.5% of consumers seek customer service via social media, making it the most popular channel. Telkomsel and HaloBCA are among the best companies, managing to answer social media inquiries within 10 minutes.
Social Media Customer Service Statistics By Network
(Source: sproutsocial.com)
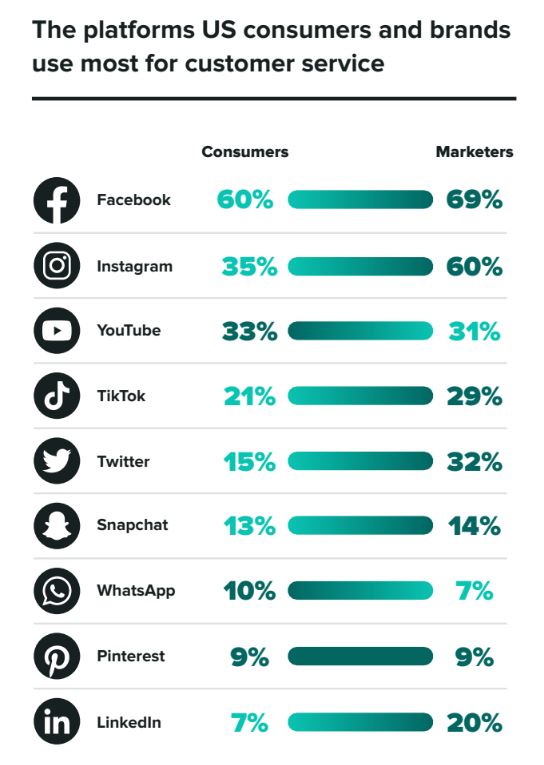
- Instagram is a key platform for rendering customer service today.
- Being the second-most-used platform for customer service behind Facebook, an estimated 35% of consumers resort to Instagram for support given by Sprout Social in 2022.
- With potentially over a billion active users, the audience base for many businesses might already be active on Instagram; thus, it is crucial to have the platform as part of any customer care plan of a brand.
- However, Facebook still holds the crown in customer engagement through messaging.
- About 74% of online adults communicate that they feel more connected to a business when they have the option of messaging directly via Facebook Messenger.
- The numbers further state that 66% of consumers prefer handling their interactions with brands through messaging, making Messenger paramount for quick and personalised customer support.
- Having evolved in parallel with the changes at Meta, Threads is still finding its way when it comes to customer service.
- However, the Q4 2023 Pulse survey brings an early wave of insights.
- At the time, 73% of consumers still had not created a Threads account, with the remaining 27% having done so, among whom one-third engage with the platform weekly and another third engage daily.
- One of the really interesting things that 75% of consumers said was that they are going to use Threads daily or at least weekly in the future.
- The younger generations were more likely to have an account, yet their usage has opposite patterns.
- Compared to Gen Z, Millennials have twice the chance of being daily users of Threads, whereas Gen Z is twice as likely as Millennials to have accounts but rarely use them.
- TikTok is fast gaining ground as a major customer service outlet, especially for younger generations.
- According to a Q4 survey, TikTok, Facebook, and Instagram are the three platforms consumers say they intend to use to contact brands during the busy holiday support season.
- More than half (56%) of Gen Z users and 42% of Millennials turn to these newer, video-first social spaces for brand interaction, signalling a shift toward such channels for service.
- X, formerly known as Twitter, is also a favourite platform for users to publicly praise or criticise a brand; around 64% of users express willingness to message a brand’s support handle on X rather than receive a phone call.
- It is also considered worthwhile by 53% of users to see brands resolve a public-related question or solve an issue in public.
- The top reasons users reach out for customer service on X include defective products (37%), problems with orders (29%), and poor in-person experiences (29%).
- These statistics indicate that X remains a go-to place for fast, visible customer service engagement.
Social Media Usage
(Reference: sproutsocial.com)
- The next year will have 5.42 billion social media users worldwide, just putting into perspective how embedded these platforms are in our everyday lives.
- An average person uses 6.83 social networks a month, telling the story that people don’t lock themselves onto just one platform but scatter their attention across several.
- Such widespread use immediately provides brands with opportunities to target and engage their audiences.
- Nearly half of the consumers—48% at present—reported that they engage more often with brands over social media than they did just six months ago, implying that brand engagement on these platforms is steadily climbing.
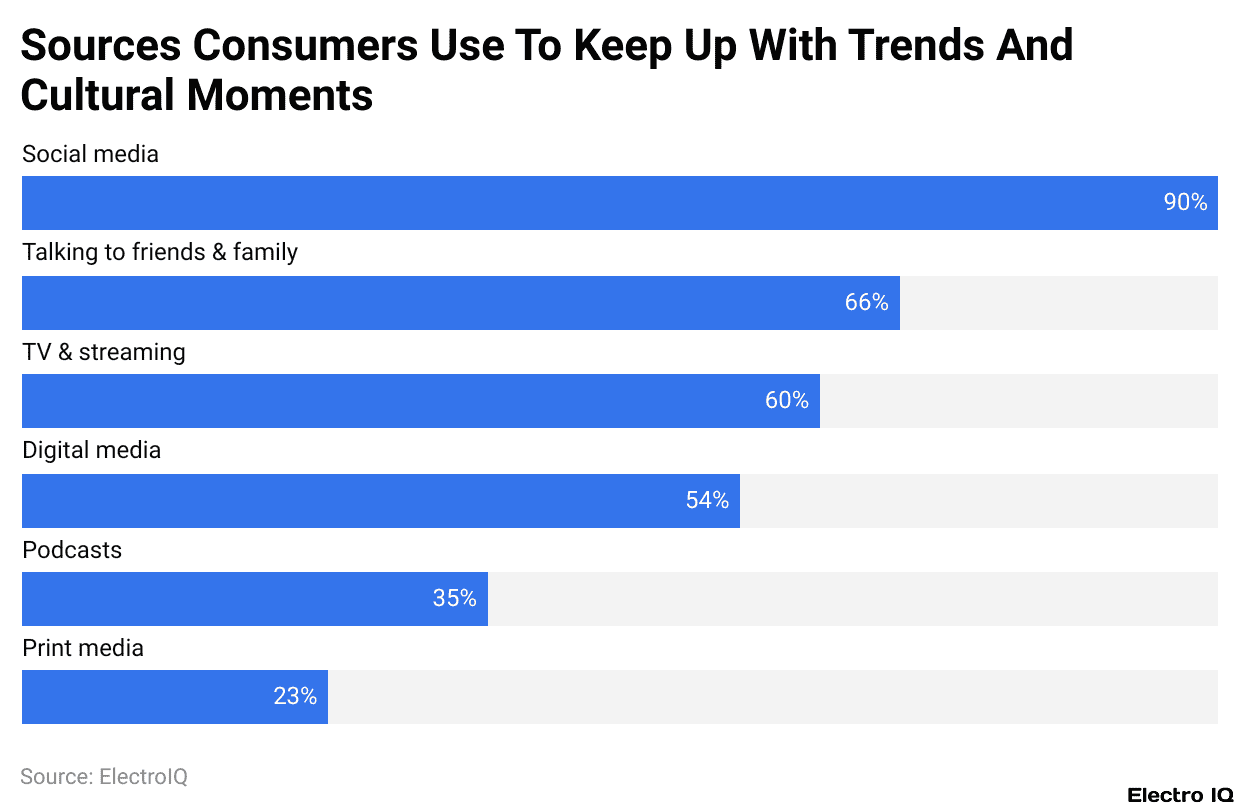
- Social media is no longer just for personal life; 90% of customers use it to stay abreast of trends and major pop culture events, making it a prime vehicle for timely content.
- While the usage of social media remains high, another scenario has in its bell-jar: the situation of a slight decrease in the average time users spend on social media each day. This fact certainly hints that online time is carefully chosen or is used intentionally.
The Growing Impact of Social Media On Customer Service
- Social media are now considered a vital customer service channel, giving a facelift to how consumers interact with brands.
- As of 2025, 80% of consumers now use social media to engage specifically with brands–to ask questions, to lodge complaints, and to provide feedback.
- This shows the extent to which people put their trust in platforms such as Facebook, Instagram, X (formerly Twitter), and TikTok for real-time help and support.
- More consumers, 69% of U.S. residents, contend that messaging a company on social media effects in them in having a stronger confidence in the brand, showing how messaging generates trust and transparency.
- Also, 85% of small to medium-sized businesses operate active customer support through Twitter (X).
- Managing complaints through social media should never just be about solving the problem; it should also build brand loyalty.
- If complaint replies are given, customer advocacy can rise by some 25%.
- The response offered by a brand is also among the chief factors in consumer satisfaction.
- Some 84% of U.S. consumers who have sent service requests through social platforms claim to have gotten some answer. This kind of reply has been strengthened in forging better relations, thereby ensuring repeat business.
- A further 51% have also indicated that they are “very likely,” and 41% have said they are “somewhat likely,” to become repeat customers if their question is answered on social media by a brand.
- On social media, 37% of consumers who make inquiries expect an answer within 30 minutes; 31% expect one within 2 hours; and 26% expect a reply within 4 hours.
- Failing to meet these expectations can tarnish an otherwise beneficial relationship, indicating clearly that consumers attach much importance to timely communication.
- Conversely, brands can be said to generate anywhere between 20% and 40% more revenue per customer from social media if they can manage to tackle service requests on social media well.
- And in an increasingly viable way, this opens a great future perspective, cutting business costs of nearly 83% by switching from traditional customer service channels, such as phone or email, to social media.
- From a promotional angle, 71% of consumers say that after having a favourable experience with a brand on social media, they would recommend that brand to friends and family.
- In addition, 59% of Americans with social media accounts assert that social media platforms have made the customer service experience better overall.
- In contrast, 33% of consumers said they would rather engage with a brand over social media than give them a call, which illustrates a shift in preference toward convenience and instant interaction in customer support.
- These statistics thus indicate another stark reality: speedy, courteous, and effective customer service over social media today is nothing short of a must.
Global Top Industries In Customer Care Service On Social Media
(Reference: coolerinsights.com)
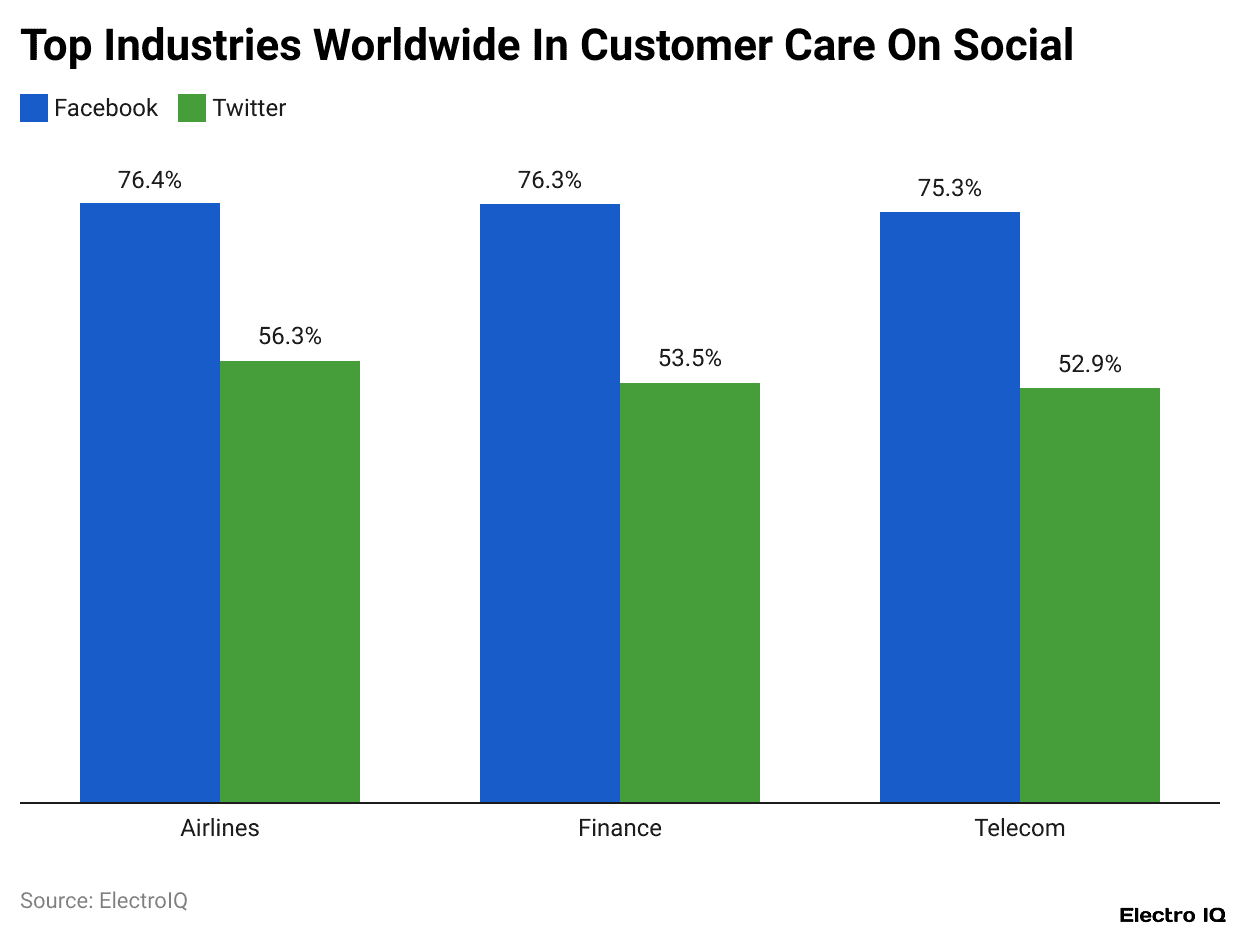
- As per Coolerinsights, social media customer service statistics show that airlines are heavy hitters when it comes to social media customer service, with 76.4% using Facebook and 56.3% using Twitter (X) for customer assistance.
- Finance follows closely, with 76.3% of financial institutions providing customer service on Facebook and 53.5% doing so on Twitter.
- Telecoms also favour social media support-they have a presence on Facebook and Twitter with 75.3% and 52.9%, respectively.
- These charts infer that companies in industries with high volumes of customer inquiries and time-sensitive issues now must prefer social media for giving swift and easily reachable service to their customers.
- On social platforms, they aim to provide fast, accessible service to their customers.
Companies On Social Media Customer Service
(Source: coolerinsights.com)
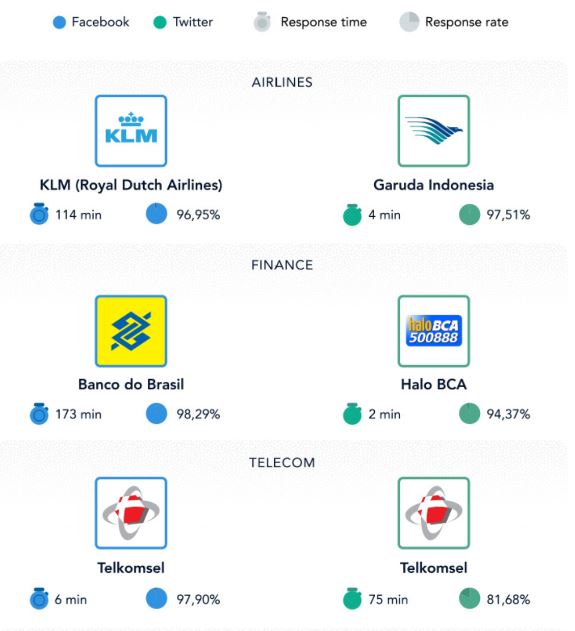
- There are some companies considered exemplary for efficient customer service on social media.
- KLM Royal Dutch Airlines takes only slightly longer than an hour and has maintained an extremely high response rate of 96.95% on Facebook.
- Banco do Brasil is another fast and consistent responder, but takes longer: 173 minutes with an altimetric response rate of 98.29%.
- The speediest of all: Telkomsel, which boasts a 6-minute average response time and a response rate of 97.90%.
- On Twitter, Garuda Indonesia, another supremely fast responder, answers within 4 minutes with a response rate of 97.51%, showing excellent responsiveness.
- HaloBCA, meanwhile, responds in 2 minutes at 94.37%.
- Telkomsel is still answering on Twitter, but more like 75 minutes, with an 81.68% response rate that appears astoundingly lower than what they bring on Facebook.
- Such stats spread a view of how differently companies perform across platforms and elaborate on different expectations that exist by industry and channel.
American Social Media Customer Care Index
(Reference: statista.com)
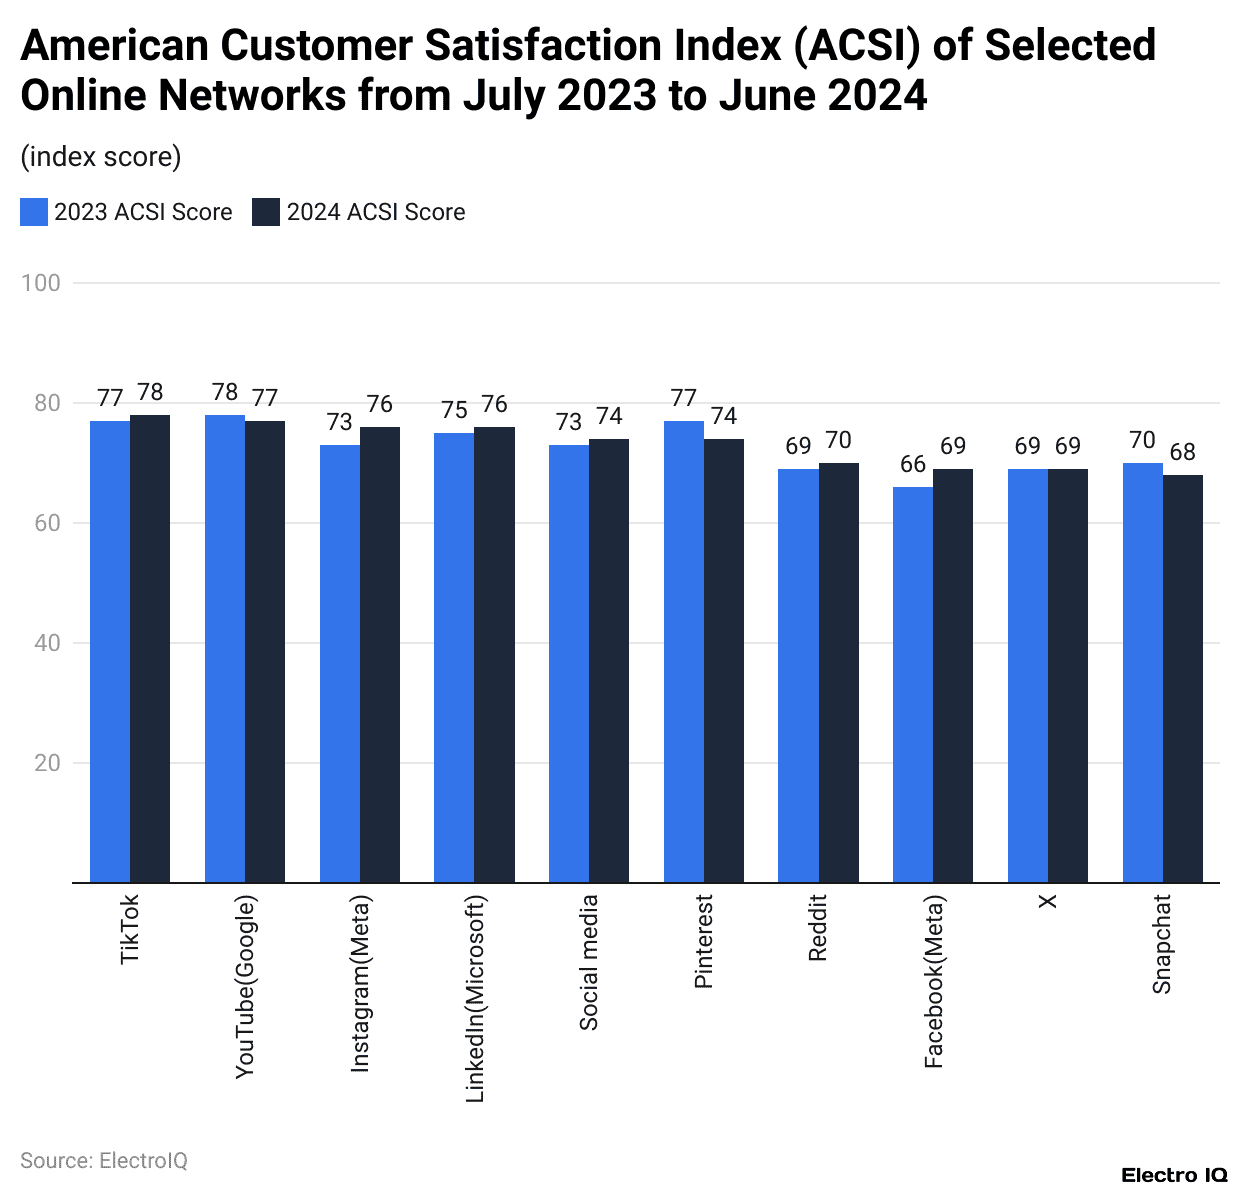
- According to ACSI scores, TikTok achieved the highest customer satisfaction record for social networks for 2024, with a previous year’s 76 and a present ascent of 1% to make it 77 points.
- YouTube also earned 77 points, although it somewhat declined from 78 in 2023.
- Instagram showed the most improvement in customer satisfaction, improving from 73 in 2023 to 76 in 2024.
- These scores indicate a measurement of users’ perception of their experience and support on the respective platform, with upward momentum for user satisfaction demonstrated by TikTok and Instagram.
Customers Prefer Social Media Over Other Channels For Services
(Source: coolerinsights.com)
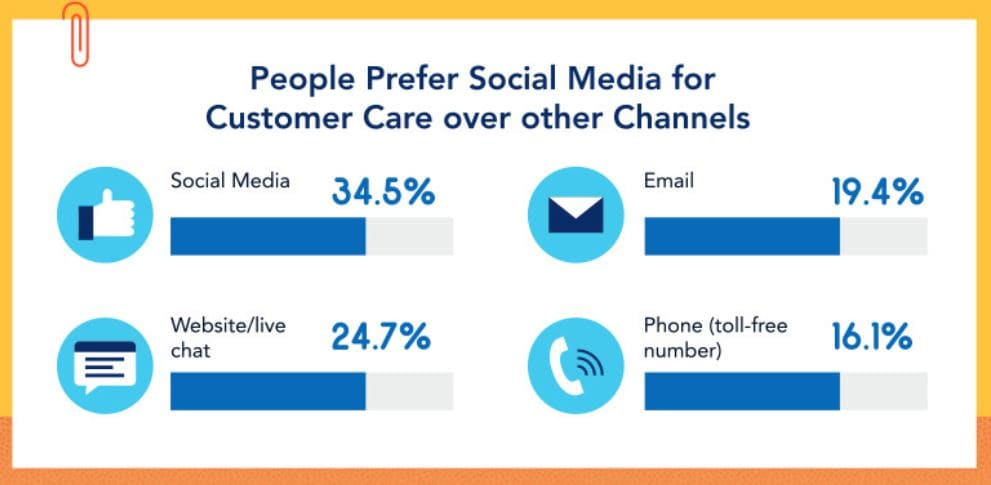
- Social media is now the most preferred customer care channel.
- Around 34.5% of consumers say they prefer social media when contacting a brand for assistance, followed by 24.7% of people who choose the firm’s websites or live chat platforms.
- E-mails account for 19.4%, while only 16.1% opt for toll-free phone numbers.
- These numbers indicate a radical transformation away from “talk to a person” types of communications toward more rapid and convenient forms of digital communication, with social media leading the way as the most favoured provider of customer support.
- The second place goes to texting, at 44%, as it is somewhat balanced between speed and ease of use. 36% of customers said that the messaging app WhatsApp or Messenger was their preferred channel for communication.
- Online review sites and contact forms are at par, with just 10% each, making them the least favourite ways to engage in customer conversations.
- These numbers imply that real-time options and mobile-based support channels are emerging as the new service standard.
(Reference: convinceandconvert.com)
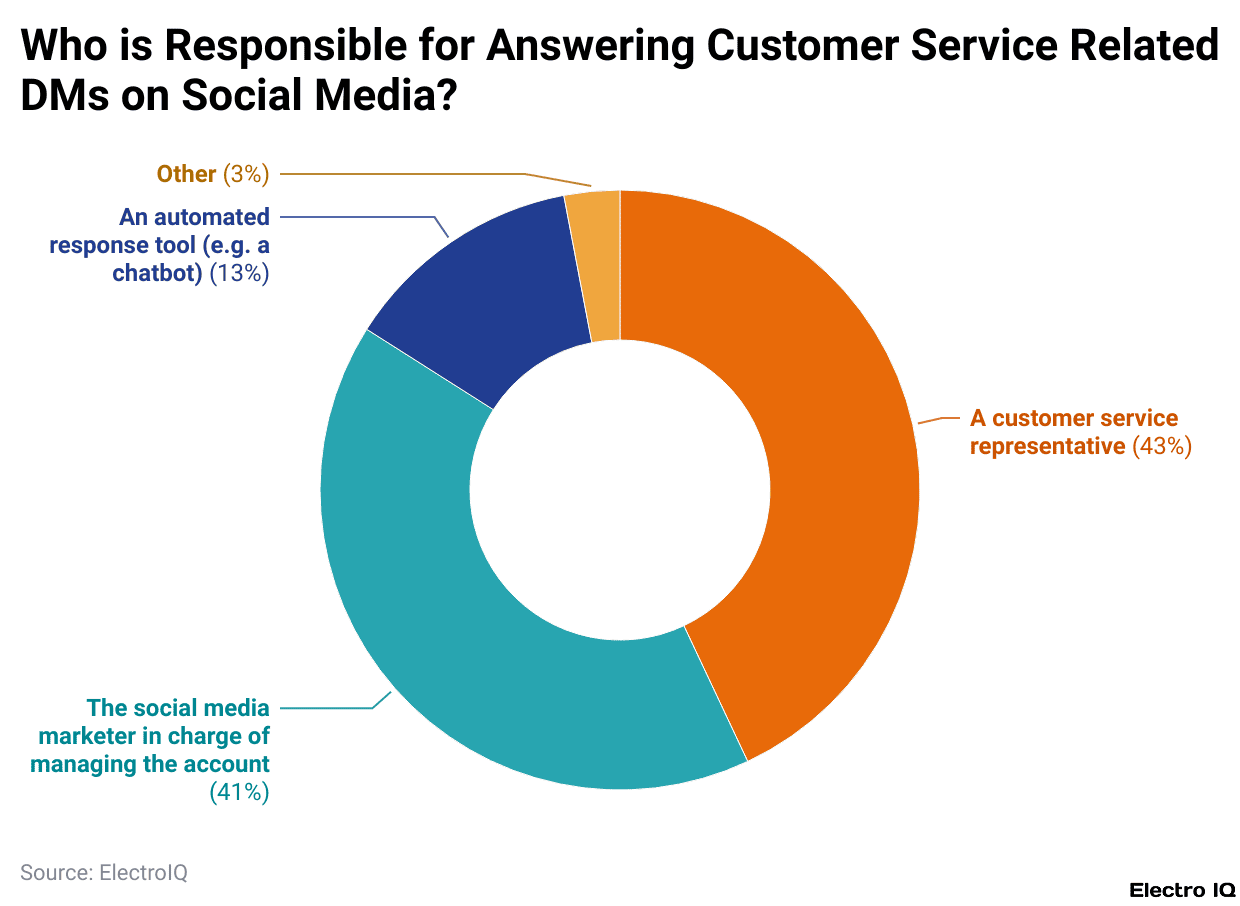
- When managing service-related direct messages on social media, 43% of the time, a customer service representative responds.
- The next-highest rate of response—41%—comes from social media marketers responsible for handling the account. This points to the use of humans for social support by many businesses.
- Just 13% of messages get triaged by automation tools such as chatbots, which means automation exists but is not yet dominating.
- Other roles make up about 3%, representing the least contributors.
Social Media Customer Service Demographics
(Source: hootsuite.com)
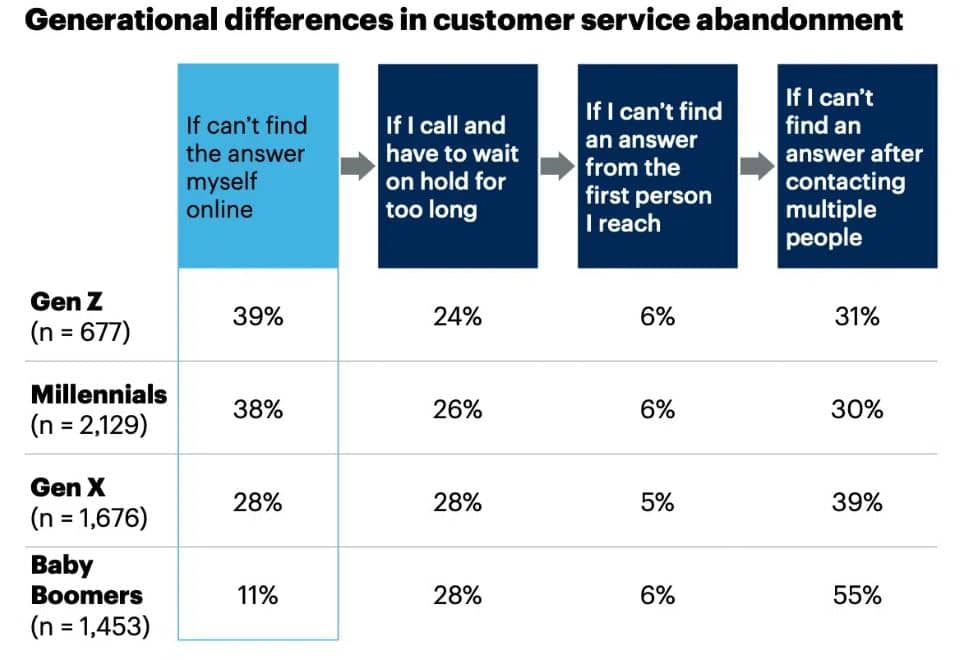
- As per Hootsuite, social media customer service statistics state that nearly 28% of customers say that they will cease trying to solve their problem if they are unable to get an answer by themselves online.
- This tendency tends to get more prominent with younger consumers: 38% of Millennials and 39% of Gen Z say they would give up if self-help options do not exist.
- Among those willing to go ahead in seeking help, patience does not last long, though, since 26.5% across all generations say that they would give up if they were made to wait on hold to speak to someone.
- Thus, it becomes extremely important that companies offer speedy solutions that are accessible online along with minimal delays on the end of customer support.
Scaling Customer Support With AI Chatbots
- To give friendly, personalised customer service at scale, AI chatbots have become the preferred solution.
- More and more consumers—61%—now prefer self-service for simple issues, whilst 55% have already been interacting with AI chatbots in brand communications.
- 70% of business leaders want to embed AI across their customer touchpoints within the next two years, with 57% ranking chatbots as their highest priority.
- The modern AI chatbots, for sure, have advanced far beyond the stereotypical and simple-and-stale-like script replies.
- 68% of the customers reported that they would never use a company’s chatbot again if they were treated badly during the first interaction.
- For this, it is crucial to invest in smarter and human-like bots if companies want to scale their support without compromising on quality.
Conclusion
Social Media Customer Service Statistics: By 2024, using social media for customer service will not be optional anymore—it will be expected, effective, and efficient. Any business leader, marketer, or support team should invest in community or concierge support on social platforms, offer quick human escalation when needed, and measure results-customer satisfaction, loyalty, and revenue. Statistics prove that these activities not only shape reputation but also support revenue.
FAQ.
Nowadays, social media customer support is a core part of brand communication, having 80% of consumers using social media platforms to ask questions, give feedback, or lodge complaints. It builds trust, enhances satisfaction, and improves loyalty. To grow their customer revenue by 20–40% while saving around 83% in the cost of service compared with traditional channels, brands will respond to customers on social media.
Facebook and Instagram lead the customer service arenas, with 35% of U.S. consumers using Instagram and plenty more relying on Facebook Messenger. The TikTok platform is growing rapidly among Gen Z, while X (formerly Twitter) remains the fastest and most public medium of complaint resolution, with messaging preferred by 64% over making a call.
Response times are expected to be rather short—37% expect a reply within 30 minutes, 31% within 2 hours, and 26% within 4 hours. Being able to respond quickly contributes to customer satisfaction and loyalty.
Human agents still rule over social customer support. 43% of responses are made by dedicated service reps, 41% by social media managers, leaving only 13% response time to bots-that is, a majority is staying human. A growing use of AI-chatbots is, however, being observed, especially for simple queries: 55% of consumers have interacted with a bot, while 61% prefer self-service.
The younger generation, that is, Millennials and Gen Z, demand fast self-service, mobile-friendly support. Around 38-39% of them would give up if they could not find answers to queries online, while more than half prefer social media to making phone calls or sending emails.

Barry Elad is a passionate technology and finance journalist who loves diving deep into various technology and finance topics. He gathers important statistics and facts to help others understand the tech and finance world better. With a keen interest in software, Barry writes about its benefits and how it can improve our daily lives. In his spare time, he enjoys experimenting with healthy recipes, practicing yoga, meditating, or taking nature walks with his child. Barry’s goal is to make complex tech and finance information easy and accessible for everyone.