Uber Statistics and Facts (2025)
Updated · Jul 02, 2025

Table of Contents
Introduction
Uber Statistics: Uber, the greatest player in ride-hailing, was able to maintain its control of the mobility and food delivery industry in 2024. Uber operates in over 70 countries and more than 10,000 cities, providing services that comprise ride-sharing, food delivery (Uber Eats), freight, and even autonomous vehicle initiatives.
With the surge of new rivals from regional ride-hailing platforms and regulatory turbulence, Uber has, against all odds, held its own as the trailblazer of this gig economy. This article aims to illuminate Uber statistics with respect to the metrics that matter, like revenue, user growth, ride numbers, driver earnings, and so on.
Editor’s Choice
- According to Uber statistics, in 2024, Uber set the trend worldwide, establishing its presence in more than 70 countries and 10,000 cities and extending its services beyond the ride-hailing business to include food delivery, freight, and even autonomous vehicle logistics.
- The company reported 2.57 billion trips in Q1 2024, slightly down from 2.6 billion in Q4 2023, but due to increasing demand, it bounced back to 2.77 billion trips in Q2 2024 and 2.87 billion trips in Q3 2024.
- Gross bookings increased 20% year over year to USD 37.65 billion in 2024. Mobility rose 25% to USD 18.67 billion, delivery 18% to USD 17.70 billion, and freight 8% to USD 1.28 billion.
- Uber statistics reveal that revenue increased to USD 10.13 billion in Q1 2024, 15% higher than in the prior-year period.
- Mobility revenue was up 30% to USD 5.63 billion, and delivery revenue was up just 4% to USD 3.21 billion. Freight revenue was down 8% to USD 1.28 billion.
- Adjusted EBITDA was USD 1.38 billion in Q1 2024, an 82% year-on-year growth. The mobility segment grew by 40%, delivery grew by 83%, and freight decreased its losses by 9%.
- Free cash flow skyrocketed from USD 3.36 billion in 2023 to USD 6.89 billion in 2024 owing to improved cash generation and operational efficiencies.
- Uber statistics show that by Q3 2024, monthly active platform consumers had grown to 161 million from 150 million in Q4 2023, signalling good levels of engagement with Uber’s services.
- The number of Uber drivers and couriers experienced a huge boost in-app participation in the gig economy- from 6.8 million in Q4 2023 to 7.8 million in Q2 2024.
Uber Trips Globally
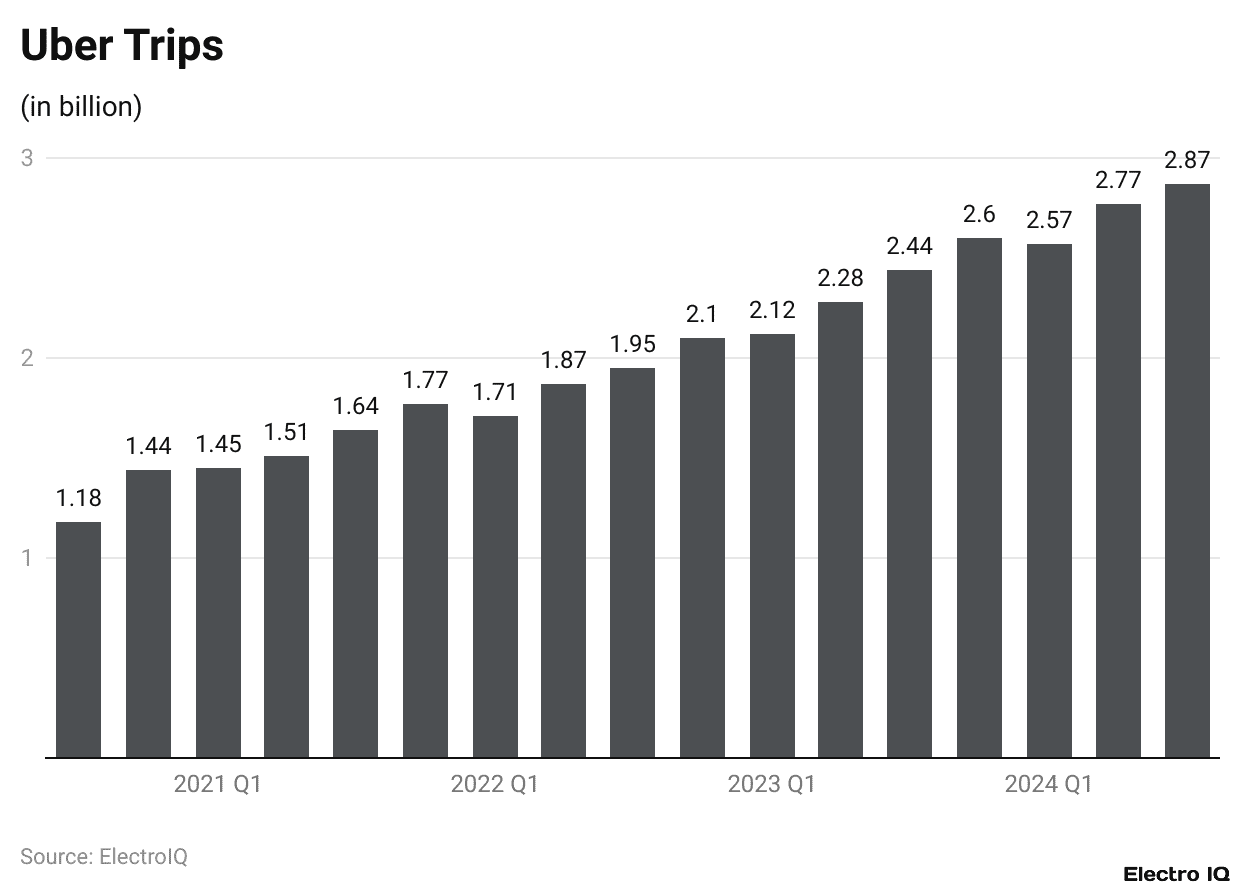
(Reference: backlinko.com)
- Uber statistics show that in 2024, Uber’s services grew tremendously in the number of trips occurring on the platform, and the growth has continued from previous years.
- Uber has recorded 2.57 billion trips in the first quarter of 2024, reflecting a slight drop in demand over the 2.6 billion trips completed in Q4 2023, although with a strong rebound in numbers with 2.77 billion trips in Q2 2024. Again, by Q3 2024, Uber had grown to 2.87 billion trips as demand for ride-hailing services kept increasing.
- Uber has demonstrated a steady growth pattern for trip volume over the years. In 2023, the platform recorded trips as follows: Q1-2.12 billion, Q2-2.28 billion, Q3-2.44 billion, Q4-2.6 billion.
- Consistent growth quarter by quarter, with a significant bump from Q1 to Q4 of around 480 million trips, tells a story of mounting worldwide demand for Uber services, perhaps aided by newer markets, increased consumer mobility post-pandemic, and better service availability.
- In comparison to previous years, Uber’s number of trips has grown considerably since 2021. First-quarter 2021 rides numbered 1.45 billion, gradually increasing to 1.51 billion in the second quarter, 1.64 billion in the third quarter, and finally 1.77 billion in the fourth quarter.
- In 2022, 1.71 billion trips will be recorded in Q1, 1.87 billion in Q2, 1.95 billion in Q3, and 2.1 billion in Q4. We see steady growth, with the biggest milestone being Uber’s first-ever hit of 2 billion trips in Q4 2022.
Gross Booking By Segment
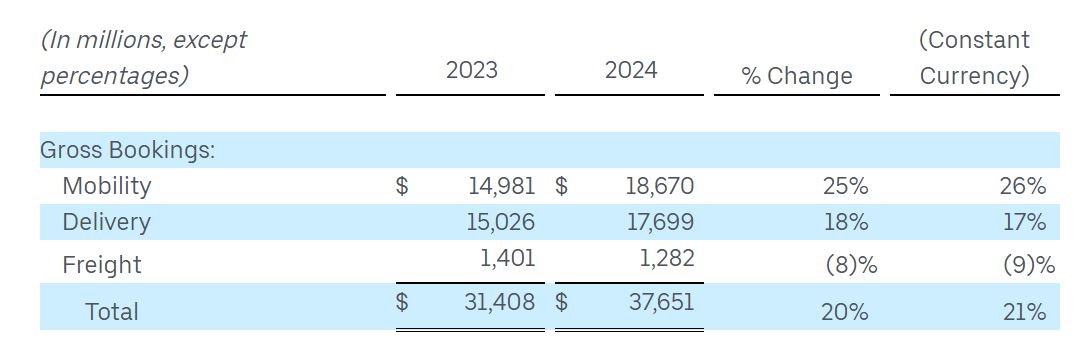
(Source: investor.uber.com)
- Uber statistics indicate that Uber hawk an unbreakable prophecy in 2024 since these gross bookings came in with USD 37.65 billion, a growth of 20 % against USD 31.41 billion from 2023.
- Out of the bright line under the mobility umbrella, ride-hailing had the highest growth rate, where gross bookings shot up from USD 14.98 billion in 2023 to USD 18.67 billion in 2024-25%.
- In constant currency terms, growth in mobility bookings was up by 26 %, reflecting a buoyed underlying demand for Uber’s transportation services. Gross bookings also gained momentum in delivery, which includes Uber Eats and other food and package-delivery services. Gross bookings in this field increased from USD 15.03 billion in 2023 to USD 17.70 billion in 2024, or 18 %.
- Constant currency witnessed a growth of 17 %, reflecting steady demand for food and grocery deliveries globally.
- On the other hand, Uber’s freight business experienced de-growth. Gross bookings from freight services fell from USD 1.40 billion in 2023 to USD 1.28 billion in 2024, an 8 % decrease. Even with constant currency adjustment, this decrease became 9%.
- This decline accentuates adversity in the logistics margins due to uncertain transport costs and the economic downturn threatening freight demand.
- Thus, on average, Uber’s total gross booking grew at a good rate of 20 % year over year, predominantly due to mobility and delivery contributions, while freight was in decline.
- In constant currency, the growth of total gross bookings was 21 %, Thus portraying Uber’s resilience and other growth avenues in resilient markets.
Uber Revenue By Segment
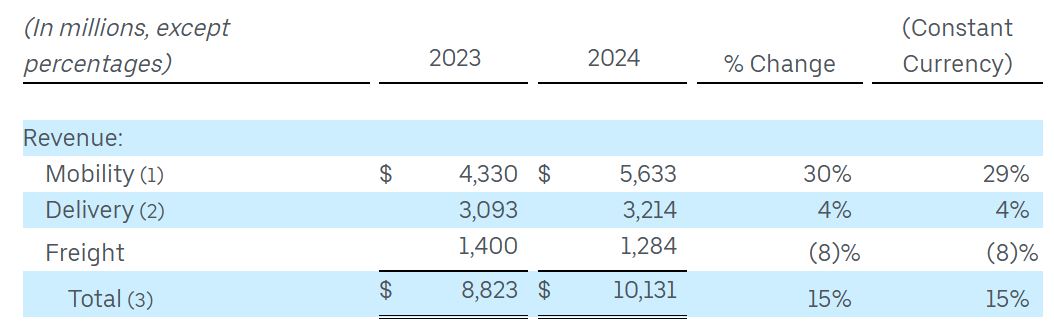
(Source: investor.uber.com)
- Despite the strange times of the pandemic and inflation, Uber’s financials reveal a very robust performance in the first quarter of 2024 across its well-sectioned lines of business.
- The company’s revenue increased from USD 8.82 billion in Q1 2023 to USD 10.13 billion in Q1 2024, a 15% year-over-year increase.
- Even if the constant currency is applied, the dollars grow. Mobility, which includes rides, has really grown – from USD 4.33 billion in Q1 of 2023 to USD 5.63 billion in Q1 of 2024, up 30%.
- These Uber statistics figures indicate that Uber’s ride-hailing services continue to attract consumers who may be travelling more, spending more, or improving the efficiency of operations.
- Revenue in the Delivery segment (Uber Eats and other delivery services) grew but at a lower rate: from USD 3.09 billion in Q1 2023 to USD 3.21 billion in Q1 2024, an increase of just 4%.
- This moderate increase reflects the continual demand for all the delivery of food and groceries, which is presumed to be stable even under conditions of market saturation or increased competition from other delivery platforms.
- The Freight segment, however, which manages logistics and shipping, recorded a revenue decline. Revenue declined from USD 1.4 billion in Q1 2023 to USD 1.28 billion in Q1 2024, representing an 8% decline from the previous year’s revenues.
- The decrease may result from reduced demand for freight services owing to the changing global condition of supply chains or increased competition hounding the logistics industry.
Uber Adjusted EBITDA
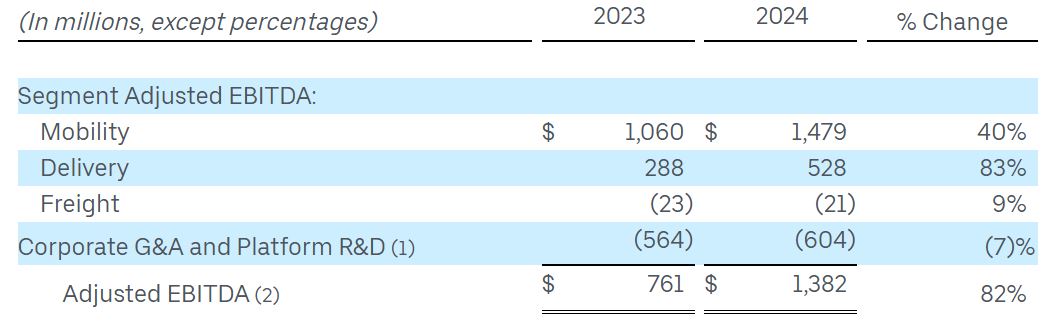
(Source: investor.uber.com)
- Uber’s financial performance has been positively dominant, and growth has been seen across all core segments in the first quarter of 2024. In terms of the overall adjusted EBITDA for the company, this increased by 82% year-on-year, from USD 761 million reported in Q1 2023 to USD 1.38 billion in Q1 2024.
- This massive improvement is evidence that the company has been able to streamline its operations and increase profitability.
- Mobility, which involves ride-hailing services, reported an Adjusted EBITDA of USD 1.06 billion for Q1 2023, which grew 40% year over year to USD 1.48 billion in Q1 2024.
- A higher demand for rides and increased efficiency in Uber’s core business are suggested by the high growth.
- The delivery segment of Uber, which captures deliveries for foods and groceries, recorded an even better increase of 83% when Adjusted EBITDA from USD 288 million in Q1 2023 suddenly increased to approximately USD 528 million around Q1 2024.
- This signifies that delivery has been greatly broadened under this company without diminishing profitability.
- Uber statistics showed a smaller loss compared to the same period the previous year. In Q1 2023, Uber Freight delivered a negative Adjusted EBITDA of USD 23 million; that amount improved slightly to USD 21 million negative in Q1 2024 and, thus, reflects a 9% dip in losses.
- The company’s general administration and incurred costs, together with the costs of platform R&D, increased from USD 564 million in Q1 FY 2023 to USD 604 million in Q1 FY 2024, a 7% increase. This indicates that while Uber continued to strengthen its overall profitability, it still made investments in technological and platform upgrades.
GAAP & Non-GAAP Costs and Operating Expenses
- Uber statistics state that Uber’s GAAP cost of revenue was USD 6.2 billion or 16.4% of Gross Bookings in Q1 2024, which is equal to the company’s non-GAAP cost of revenue.
- This has come down slightly from 16.7% in Q1 2023 and 16.1% in Q4 2023. The year-over-year decline in non-GAAP cost of revenue as a percentage of Gross Bookings was enabled by greater cost efficiency, where growth in Gross Bookings had outpaced growth in cost of revenue.
- In contrast, GAAP operations and support, with USD 685 million and non-GAAP operations and support with USD 616 million, represented 1.6% of Gross Bookings. This reduced from 1.9% in Q1 2023 and 1.7% in Q4 2023.
- The drop in non-GAAP operations and support as a %age of Gross Bookings was primarily determined by reduced driver background-checking costs.
- GAAP marketing and sales accounted for USD 917 million, while non-GAAP marketing and sales expenses were USD 895 million, which translates to 2.4% of Gross Bookings, down from 3.9% in Q1 2023 and constant with Q4 2023.
- The reduction year-over-year was affected by changes to a business model in certain countries, where some costs of sales and marketing were reclassified to contra revenue.
- In addition, a shift in Gross Bookings towards mobility, which generates less sales and marketing expense, also contributed to the decline.
- GAAP research and development expenses were USD 790 million; non-GAAP research and development expenses were USD 488 million or 1.3% of Gross Bookings, lower than 1.5% in Q1 2023 and equal to 1.3% in Q4 2023. This decline year-over-year was attributed to better-fixed cost leverage.
- General and administrative expenses amounted to USD 1.2 billion in accordance with GAAP, whereas the non-GAAP equivalent stood at USD 582 million, making up 1.5% of Gross Bookings.
- This was an improvement from 1.6% for Q1 2023 and flat from Q4 2023. The year-over-year decline was mainly due to the going down costs of employee headcount.
Uber Free Cash Flow
- The Uber statistics data compare Uber’s free cash flows with its net cash from operating activities for the three-month and full-year periods ending 31 December 2023 and 31 December 2024.
- The three-month period saw net cash from operating activities grow a great deal over 2023-USD 823 million to USD 1,750 million in 2024. In that same period, Uber reduced property and equipment purchases from USD 55 million in 2023 to USD 44 million in 2024.
- Thus, free cash flow, which is obtained by deducting capital expenditures from operating cash flow, increased steeply from USD 768 million in 2023 to USD 1,706 million in 2024.
- According to Uber statistics, net cash from operating activities changed dramatically upwards for the full year, increasing from USD 3,585 million in 2023 to USD 7,137 million in 2024.
- Uber’s capital expenses ranged slightly upward, from USD 223 million to USD 242 million. Yet, over that expenditure increase, free cash flow more than doubled, from USD 3,362 million in 2023 to USD 6,895 million in 2024.
- The overall trend indicates a strong improvement in Uber’s cash generation as a function of higher operating cash flow with relatively stable capital expenditures, signalling increased operational efficiency and profit improvements.
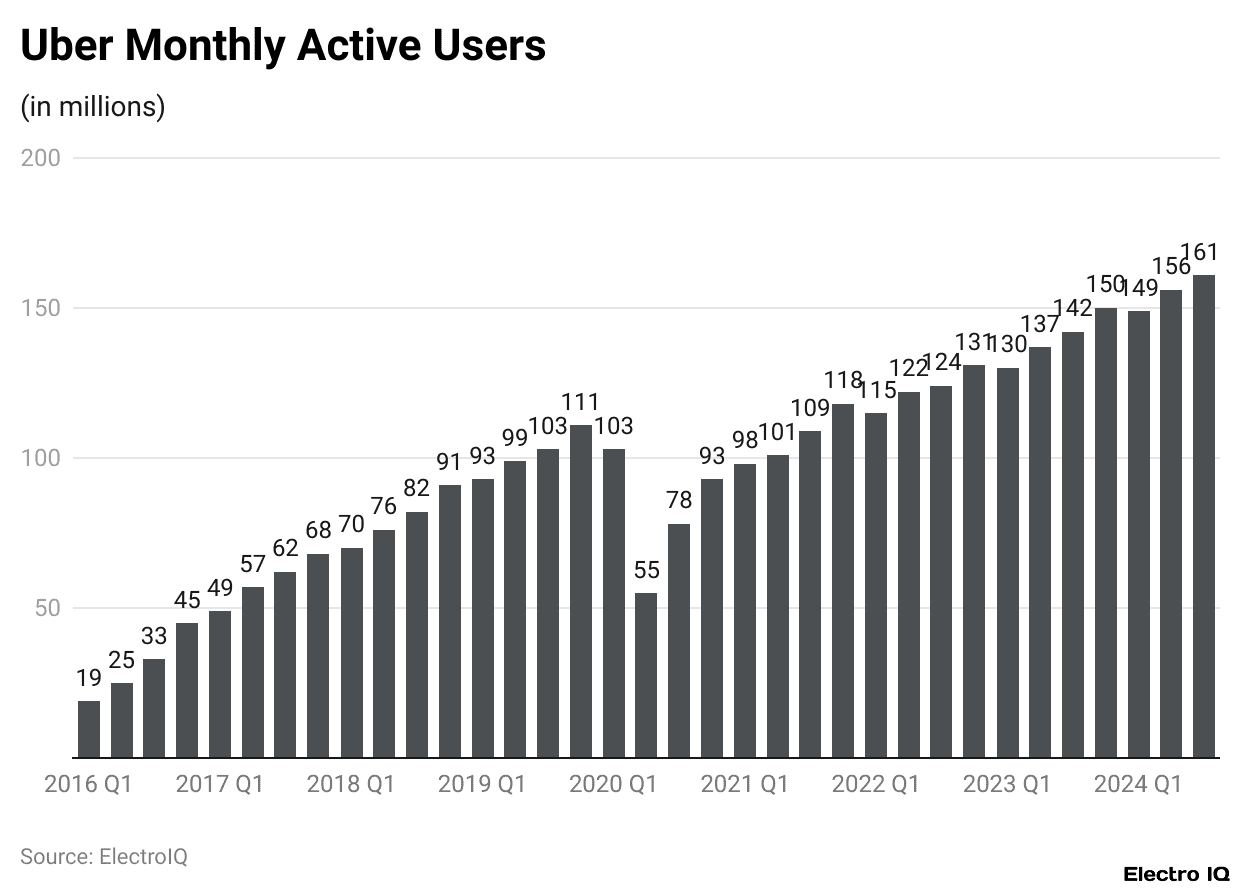
Uber Monthly Users
(Reference: backlinko.com)
- According to Uber statistics, Uber has shown consistent growth among its monthly active platform consumers in Q1 2021 through Q3 2024, reflecting the increasing consumer base and growing demand for ride-hailing and delivery services.
- In Q1 2021, the company had 98 million active consumers, which later grew to 101 million in Q2 and 109 million in Q3.
- By the end of 2021, the figure rose to 118 million. Steady upward growth was evident throughout 2022, as there was a slight fluctuation in numbers, with a drop to 115 million in Q1, followed by a strong recovery to 122 million in Q2 in terms of users.
- The final destination in the growth trajectory was 124 million in Q3, which earned it a spot on the list of the top platforms with 131 million by the last quarter.
- Although much lower than 202,1, the increase meant a strong position in the market and relied heavily on the use of services by people. Trends moving into 2023 include 130 million active consumers in Q1 and up to 137 million in Q2.
- By Q3, that number climbed to 142 million, and by the end of the year, Uber had reached 150 million. This represents a significant understanding of Uber’s services and further global uptake of the ride-hailing, food delivery, and mobility solutions from this travel business. 2024 was expected to have an excellent growth trajectory with little wiggle after Q1 dipped slightly to 149 million users to start but bounced back to 156 million in Q2.
- In the third quarter, Uber had 161 million active platform consumers, indicating the company’s ongoing expansion and high retention within its consumer base.
- Such numbers signify the resilience of Uber to maintain and grow its user base despite changing market dynamics.
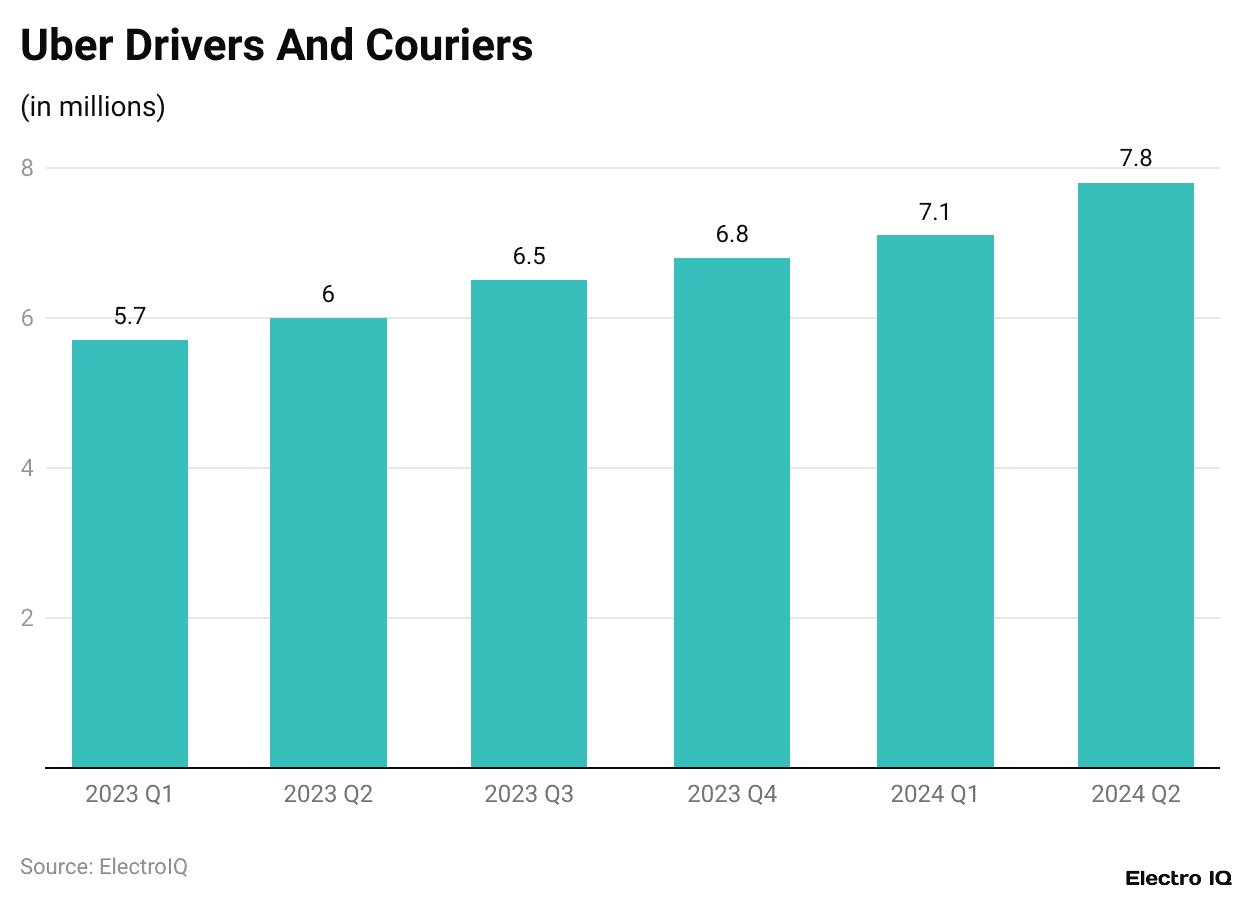
Uber Drivers And Couriers
(Reference: demandsage.com)
- Uber statistics show that, historically, while capturing the space for ride-hailing and delivery services, the number of Uber drivers and couriers kept increasing throughout 2024.
- In Q1 of 2024, Uber’s worldwide figure was 7.1 million. This figure continued to scale up during the second quarter of that same year to 7.8 million, allowing more people to join the fold and thus creating the possibility of earning some extra flexibility.
- In retrospect, such a wave of growth became conspicuous throughout 2023. Beginning in Q1 2023, the total number of Uber drivers and couriers stood at 5.7 million. In Q2, the number ramped to 6 million, depicting a consistent growth of new partners into service.
- The actual change picked up thereafter, with a leap in numbers up to 6.8 million active drivers and couriers by the last quarter of 2023—emphasising Uber’s recruiting and retention strength in the gig economy.
- Therefore, this represents an overall increase of 2.1 million drivers and couriers from Q1 2023 to Q2 2024 in a little over a year. This is a testament to Uber’s ongoing expansion and responsiveness to the need for gigs as an income-generating option.
Conclusion
Uber had a year of abundant revenue and operations in 2024, showing a remarkable increase in its activities concerning ride-hailing, food delivery, and autonomous vehicle services. The firm also provided an outlet for movement towards electric and autonomous cars to help towards a sustainable future.
Prosecution notwithstanding, Uber has retained a leading stance in the global mobility market. Therefore, it is expected that Uber will expand even further through innovation paths related to technology, driver incentives, and customer engagement strategies.
Sources
FAQ.
During this recent year, Uber added trip volume at a considerable scale. Uber recorded 2.57 billion trips completed in Q1, 2.77 billion in Q2, and 2.87 billion in Q3 this year, proving that ride-hailing demand is increasing.
In 2024, Uber’s gross bookings totalled US$37.65 billion, which translates to a 20% increase year-on-year; in the mobility segment, gross bookings rose by 25% to US$18.67 billion; delivery increased by 18% to US$17.70 billion, while the freight segment fell by 8% to US$1.28 billion.
By Q3 2024, Uber’s monthly active platform consumers had reached 161 million, up from 150 million in Q4 2023, which reflects its success in user engagement across its services for ride-hailing and delivery.
In Q1 2024, Uber’s revenue was up 15 % from year-ago figures, reporting US$10.13 billion; mobility soared 30 % to US$5.63 billion, delivery improved by 4 % to US$3.21 billion, while freight fell 8 % to US$1.28 billion.
The number of Uber drivers and couriers increased to 7.8 million in Q2 2024 from 6.8 million in Q4 2023, which constitutes a 1 million increase as more and more people enter the gig economy through Uber.

Barry Elad is a passionate technology and finance journalist who loves diving deep into various technology and finance topics. He gathers important statistics and facts to help others understand the tech and finance world better. With a keen interest in software, Barry writes about its benefits and how it can improve our daily lives. In his spare time, he enjoys experimenting with healthy recipes, practicing yoga, meditating, or taking nature walks with his child. Barry’s goal is to make complex tech and finance information easy and accessible for everyone.