Wearable Technology Statistics By Market, Consumers And Region
Updated · Aug 26, 2024
Table of Contents
Introduction
Wearable Technology Statistics: The wearable technology statistics show size is estimated to grow at a growth rate of 17.28% between 2023 and 2028. The growth of the wearable technology market hinges on various factors, including the popularity of wearable devices for payment, the increasing digitization of the global economy, and advancements in miniaturized electronic components.
These devices, serving as easy payment methods, are becoming increasingly sought-after by consumers as they are easily accessible and very easy to understand. Moreover, as the global economy continues its digital transformation, the demand for wearable technology is expected to surge.
Additionally, ongoing developments in miniaturization techniques for electronic components are enabling the creation of smaller, more efficient wearable devices, further fueling market expansion.
Editor’s Choice
- The fitness and healthcare sector is expected to grow at a rate of 11.2% between 2024 and 2033.
- The North American region has had the biggest market share of 39.14% in
- The eye-wear and head-wear product segment is expected to grow at a CAGR of 14.3% from 2024 to 2033.
- The global shipments of wearable medical sensors are likely to expand to 160 million units in 2024.
- The global market for wearables is assumed to reach USD 93.9 billion by 2026.
- Approximately 40% of global wearable technology users find these devices indispensable; on the other hand, 25% of people wear the devices while sleeping.
- The consumer electronics application segment contributed the largest revenue share of 49% in 2023.
- The trend continues with anticipated revenues of USD 79.0 billion in 2024 and USD 94.0 billion in 2025
- The trend continues as individuals reach the age of 75 and above, with an adoption rate of 0.8%.
- The fitness trackers segment is expected to see a CAGR of 13.5% from 2022 to 2030.
(Source: scoop.market.us)
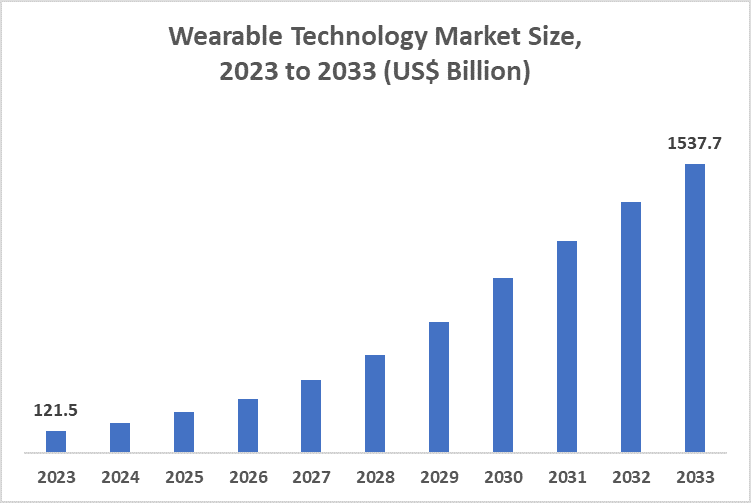
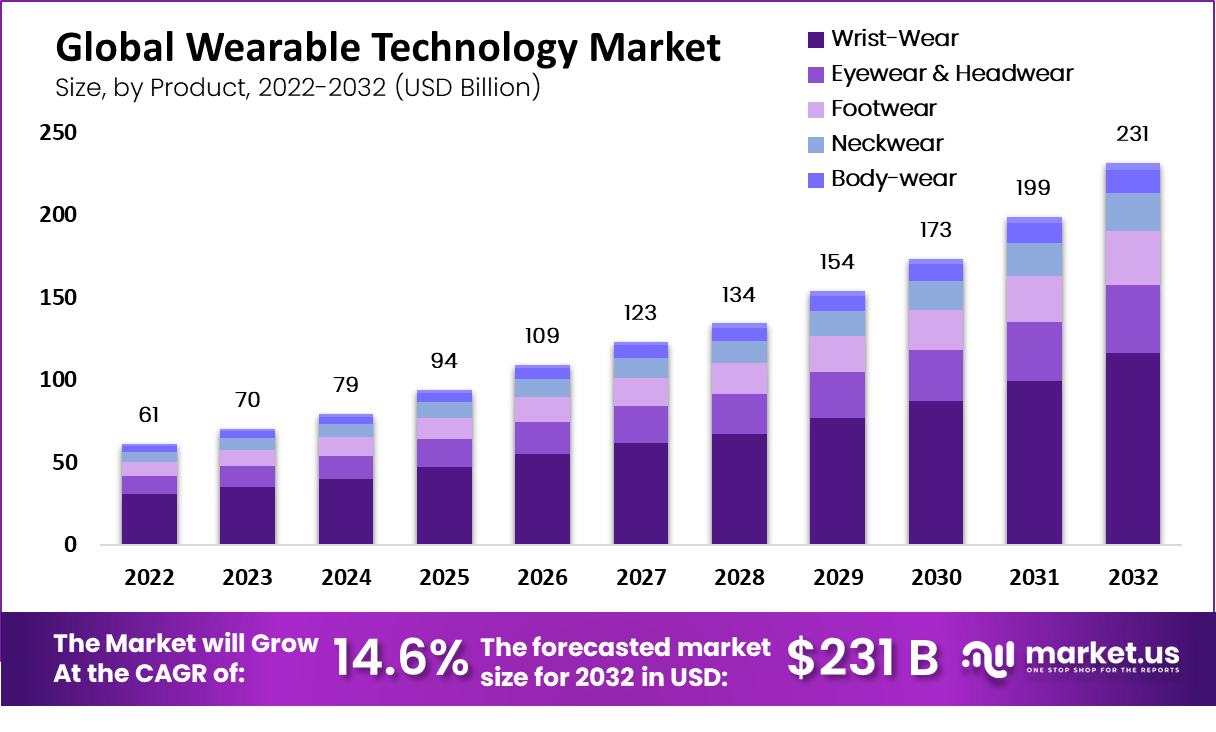
The above chart explains the global wearable technology market with the help of a bar graph representing different wearable devices. The chart shows the data on wearable devices like wristwatches, eyewear, headwear, footwear, neckwear, and bodywear. The wearable device market growth from 2022 to 2032 will be 14.6% (CARG). The most used product in wearable devices is wrist watch, with almost 43% of the market share. The forecasted amount of the wearable device market is 231 billion by 2032. In 2022, the amount touched by the wearable device market was 61 billion, and in 2024, it is 79 billion.
General Bearable Technology Statistics
- The global wearable sensors market revenue is projected to reach USD 10.19 billion by 2032.
- Samsung maintained consistent growth with figures of 7.90% in Q4 2022 and around 7-9% throughout 2023.
- The global market for smart athletic wear is expected to reach $14.74 billion by 2025.
- Smartwatches account for 61% of the total wearables market in terms of revenue.
- Fitbit is the leading wearable device vendor, with a market share of 28.5%.
- The global market for wearables is assumed to reach $93.9 billion by 2026.
- The global market for smart textiles is assumed to reach $4.2 billion by 2024.
- The global market for pet wearables is assumed to reach $2.36 billion by 2024.
- The global market for smart helmets is expected to reach $1.2 billion by 2027.
(Source: scoop.market.us)
Consumer Behaviour
According to a report by MarketsandMarkets, the wearable technology statistics market is expected to reach $94 billion by 2024. Understanding consumer behavior related to wearable technology is more important than ever. Analyzing consumer behavior can provide valuable insights for product marketing managers and research executives, enabling them to design products that meet different consumer segments’ needs and choices and develop effective marketing and pricing strategies. Consumers have adopted wearable technology so well that it has become part of their attire.
#1. Adoption rate:
- Approx 29% of global consumers have at least one wearable gadget in 2024; there has been a slight increase in the number from the previous year. The growth in the numbers is because we are now more health-conscious
#2. Demography
- Age: wearable technology is more hyped in the age group of 25-34, with over 40% infiltration in this age group. The 18-24 and 35-44 age groups also depict strong adoption, each with around 30-35%
- Gender: the assumption is slightly higher among men 55% as compared to females 45% and this difference in numbers is reducing because women are including wearables in their health and wellness routines
#3. Types of wearable
- Smartwatch: This device is the most popular and demanded wearable, accounting for 55% of the market. Fitbits and other tracking devices account for 30% of the total, with other wearables(for example, smart clothing and VR glasses) making up the remaining 15%.
- Health monitoring: Over 60% of consumers use these gadgets primarily for health monitoring, including tracking steps, heart rate, sleep pattern, and more.
#4. Purchase drivers
- Health and fitness: 70% of users cite health and fitness tracking as the main reason for purchasing wearables. The integration of advanced health features like heart monitoring, ECG monitoring, and blood oxygen levels has increased consumer interest.
- Convenience: 25% of consumers purchase wearables for easy access to their other electronic devices like notifications, mobile payment, and voice assistants
#5. Purchase channels
- Online shopping: 60% of wearables tech purchases are made online, with e-commerce platforms and brand websites being the preferred channel
- In-store purchase: 40% of purchases still occur in physical stores, where consumers can try out devices before purchasing
#6. Consumer concern
- Privacy: 45% of the consumers and users of the wearable device show concern about data privacy and security, especially regarding health data
- Battery life: 30% of users prioritize battery life as a crucial factor in choosing a wearable. The consumer indicated a preference for devices that require less frequent charging.
(Source: technavio.com)
FAQ.
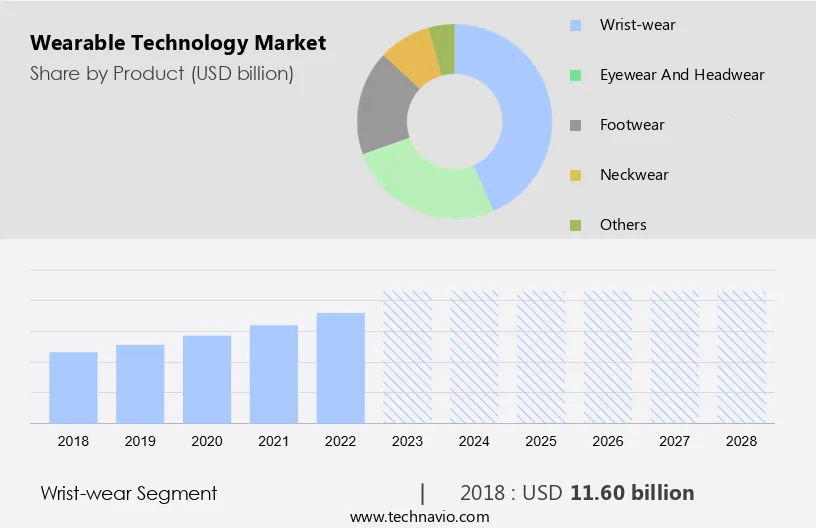
The market size of smartwatches in the wearable industry is 55% and leading as a product.
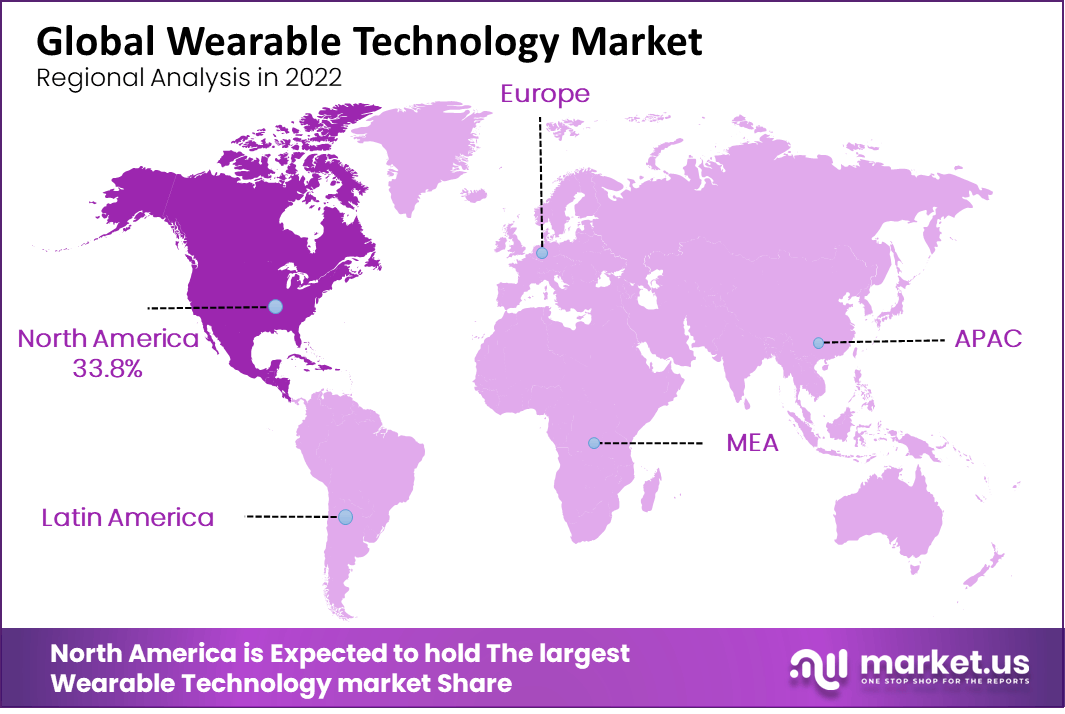
The North American region is mostly influenced by all wearable devices and technology, accounting for 33.8 % of the market share.
The age group which is mostly infiltrated by wearable devices are 25-34, over 35% and 18-24, over 40%.
AI-powered wearables are set to become more common, with 40% of new devices expected to feature AI capabilities by 2026.

Maitrayee Dey has a background in Electrical Engineering and has worked in various technical roles before transitioning to writing. Specializing in technology and Artificial Intelligence, she has served as an Academic Research Analyst and Freelance Writer, particularly focusing on education and healthcare in Australia. Maitrayee's lifelong passions for writing and painting led her to pursue a full-time writing career. She is also the creator of a cooking YouTube channel, where she shares her culinary adventures. At Smartphone Thoughts, Maitrayee brings her expertise in technology to provide in-depth smartphone reviews and app-related statistics, making complex topics easy to understand for all readers.

