Wish Statistics By Revenue And Users (2025)
Updated · Apr 29, 2025


Table of Contents
Introduction
Wish Statistics: Wish, from an e-commerce point of view, has many products and is one of the most affordable portals available in recent years. The company has undergone different changes yearly in its operational metrics and a few numbers in its financial metrics. 2025 is now, and Wish is grappling with the always-changing character of global online retail: the behaviour of customers and market conditions.
Here comes a descriptive analysis of Wish statistics, portraying the most crucial highlights and trends defining the company presently in the e-commerce sector.
Editor’s Choice
- Wish’s core marketplace revenue plummeted 58% in Q4 2023 compared with Q4 2022 from US$36 million to US$15 million and constituted declines from US$36 million to US$15 million.
- Wish total revenue in Q4 2023 went down to US$53 million, a 57% drop from Q4 2022’s US$123 million.
- In comparison, Wish’s net loss in Q4 2023 amounts to US$68 million, which is 128% of revenue, while in Q4 2022, it was US$110 million (89% of revenue).
- For the full year, Wish shrank its losses to US$317 million in 2023, against US$384 million in 2022; however, the loss relative to revenue increased from 67% to 110%.
- Adjusted EBITDA losses improved in 2023 to US$236 million compared to US$288 million in 2022, but represented still 82% of revenues, up from 50%.
- In 2023, Wish spent US$64 million on stock-based compensation and US$4 million on payroll taxes, compared to US$72 million and US$2 million in 2022.
- In 2023, the company brought up US$13 million for severance payments and continued with impairment and strategic evaluation costs.
- Monthly active users peaked at 107 million in 2020 and plunged to just 12 million today, a decline of about 89%.
- Registered users climbed from 300 million in 2017 to 680 million by the end of 2023, though engagement has dropped significantly.
- Wish was once worth US$11.2 billion in 2019, but it experienced a significant decline to just US$0.1 billion by 2023.
Wish Revenue
(Source: contextlogic.com)
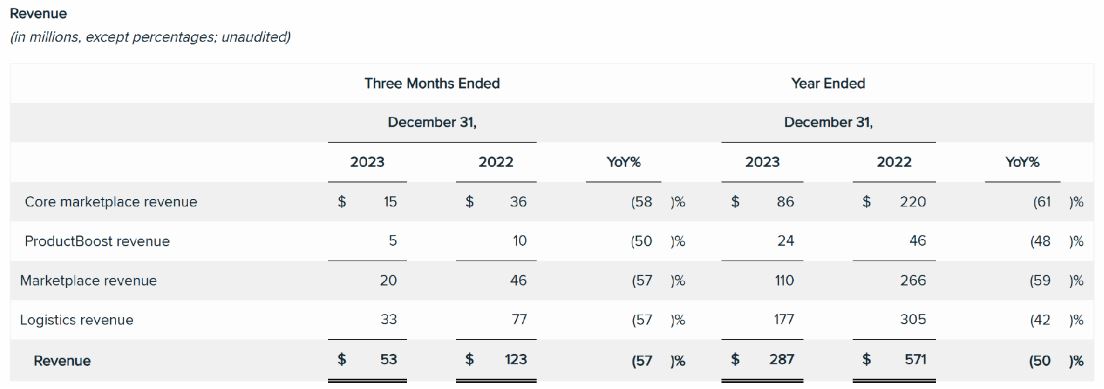
- The present figures Wish statistics describe Wish’s revenue performance across the last two quarters (the three months ending on the 31st December) and the whole year, comparing 2023 and 2022.
- Wish recorded a revenue of US$15 million from its core marketplace for Q4 of the year 2023, substantially lower than US$36 million in the same quarter of the previous year; hence, this indicates a 58% decrease compared with the previous year.
- ProductBoost, which is Wish’s advertising services to merchants, earned US$5 million, 50% lower than last year’s US$10 million in Q4 2022. The total marketplace revenue (core marketplace + ProductBoost) decreased from US$46 million in Q4 2022 to US$20 million in Q4 2023, which is a decrease of 57%.
- The revenues from Wish’s logistics also fell tremendously, from US$77 million to US$33 million in Q4, a 57% decline.
- Wish statistics show that the total quarterly revenues dropped from US$123 million to US$53 million, a decline of the same magnitude of 57% compared to the previous year.
- In the year 2023 as a whole, core marketplace revenues were actually less than two-thirds; their total decline stood at 61% from US$220 million in 2022 to just US$86 million in revenues.
- ProductBoost revenues went down by 48%, from US$46 million to US$24 million.
- Combining both, total marketplace revenue decreased by 59%, from US$266 million in 2022 to US$110 million in 2023.
- On the logistics side, the company earned US$177 million in 2023 as compared to US$305 million that it made in 2022, a percentage drop of 42.
- The total revenue for the full year 2023 stood at US$287 million, down from US$571 million in 2022, a 50% year-on-year decrease.
- Wish statistics reveal that this huge decline across all revenue streams indicates a substantial drop in merchant activity and customer purchasing on the platform.
Wish Other Financial Data
(Source: contextlogic.com)
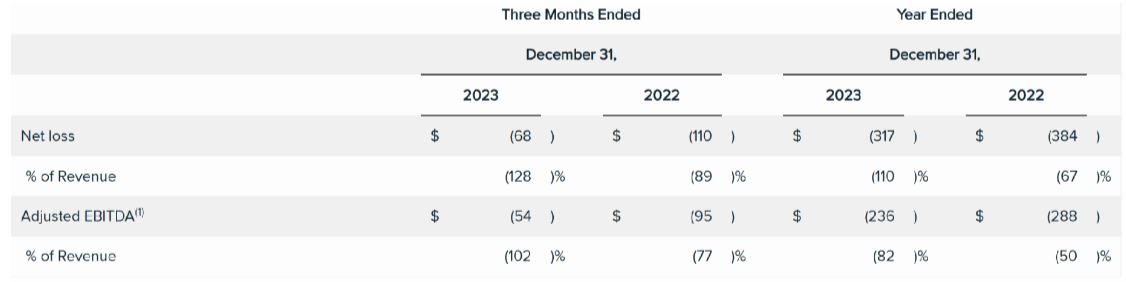
- Wish statistics illustrate Wish’s financial well-being, net loss, and adjusted EBITDA. The two observations are for the entire year of 2023, as well as the last quarter and the same period in 2022.
- In the last quarter of 2023, Wish experienced a net loss to the tune of US$68 million as opposed to the loss of US$110 million recorded in the same segment in 2022.
- Wish statistics indicated a drop in revenue, which translated to the same being 128% of its revenue, showing deterioration from the previous year’s 89% loss of revenue in Q4 2022.
- This indicates that the losses suffered by the company were higher about its revenue as compared to the year before.
- Likewise, adjusted EBITDA, which is a performance measure ignoring some expenses, curtailed much losses to US$54 million negative in Q4 2023 from a US$95 million loss in Q4 2022.
- Relative to revenue, this was again worse than 77%, with 102% reporting it. For the entire year, Wish incurred a net loss of US$317 million in 2023, which is an improvement over the net loss of US$384 million for 2022.
- However, this still amounted to 110% of the revenue, which was an increase from 67% in 2022, showing a very sharp increase in the proportion of lost revenue.
- Wish statistics show that the adjusted EBITDA for the entire year was a loss of US$236 million, as compared to the loss of US$288 million in 2022.
- Wish statistics reveal that in terms of total revenues, it represents 82% this time in 2023, which is proportionately again worse than the figure registered in 2022, which was at 50%. So, overall, while dollar losses eased marginally, the losses had widened against revenue, pointing towards a worsening operational efficiency.
Wish Key Expense Components And Strategic Costs
- Wish statistics depict that Wish’s stock compensation expense was US$64 million in 2023, with another US$4 million related to its payroll taxes on such stock awards. This was a slight decrease from 2022, where stock compensation was US$72 million and payroll taxes were US$2 million.
- This US$2 million increase in the payroll taxes in 2023 appears largely to relate to a catch-up adjustment for employees who had resided in Nevada in 2021, most probably related to a change in either tax reporting or compliance timing.
- Another US$13 million was charged against employee severance and one-time costs in reducing its workforce in 2023.
- In contrast, the 2022 personnel-related expenses were much broader, including one-time US$15 million discretionary cash bonuses to selected employees to help them offset tax liabilities from their restricted stock units that were granted upon the company’s IPO.
- Other costs included US$3 million for severance and US$11 million for asset impairments related to leases and equipment.
- Another one of the 2023 line items reflects impairment charges on lease assets and property/equipment, not connected to any restructuring.
- Wish witnessed third-party costs related to this initiative to explore strategic alternatives, including possibly a sale, merger, or restructuring, initiated by the Board of Directors and disclosed on an SEC 8-K filing on November 7, 2023. The objective of these efforts is to maximise shareholder value amidst some financial challenges.
Wish Users
| Year | MAUs (mm) |
| 2017 | 75 |
| 2018 | 82 |
| 2019 | 90 |
| 2020 | 107 |
| 2021 | 90 |
| 2022 | 27 |
| 2023 | 12 |
(Source: businessofapps.com)
- The Wish statistics show the trend of Wish’s monthly active users (MAUS) from 2017 to 2023, represented in millions.
- Over these seven years, Wish has been characterised not only by growth but also by unprecedented declines in user engagement.
- The year 2017 began with the platform hosting 75 million MAUs. From then on, this grew further each year to 82 million in 2018 and 90 million in 2019.
- The highest surge came in 2020, when Wish clocked in 107 million MAUs. This sudden influx was likely catalysed by the eruption of global e-commerce participation amid the COVID-19 pandemic lockdowns and restrictions on physical retail.
- However, beginning in 2021, the platform experienced a sharp downturn. From 90 million in MAUs in 2021, the platform had lost 17 million users, as compared to the previous year. In 2022, the drop accelerated to a calamitous drop to 27 million.
- Come 2023, Wish had recorded just about 12 million monthly active users. This steep two-year drop has been reflective of pronounced losses in consumer interest or satisfaction.
- An assortment of possible factors could have included negative customer experiences, an influx of competition within the low-cost e-commerce sector, delivery delays, or quality issues with products.
- From 2020’s peak to 2023, Wish lost an estimated 95 million monthly active users, an almost 89% drop.
- The steep drop exposes huge engagement challenges the company now has to contend with while weathering a highly competitive and fast-changing digital retail environment.
Wish Registered Users
| Year | Users (mm) |
| 2017 | 300 |
| 2018 | 400 |
| 2019 | 500 |
| 2020 | 600 |
| 2021 | 650 |
| 2022 | 675 |
| 2023 | 680 |
(Source: businessofapps.com)
- It could be seen that between 2017 and 2023, registered users grew on the Wish platform. In 2017, Wish had 300 million registered users. This number continued to grow over the years, reaching 400 million by 2018 and 500 million by 2019.
- In 2020, the growth was also seen, and registered users reached 600 million, signifying successful user acquisition during a time when everyone was switching to online shopping across the globe.
- In the year 2021, there were 650 million users on the platform, which continued to grow but at a slower rate. This grew to 675 million in 2022 and reached 680 million in 2023. This means that while user growth was present, it was really slow, with just a 5-million increment from 2022 to 2023, which may either indicate market saturation or a decline in appeal toward new users.
- The last number, “2023 – 12”, seems more likely to refer to monthly active users (MAUs) in millions, rather than total registered users. Accordingly, the total number of registered users at Wish by late 2023 was 680 million, while the bastion of activity was 12 million in any given month.
- The weighty contrast, of all accounts, strikes at the heart of the problem for Wish: engagement. Wish has an enormous user base; however, very few are consistently using the platform.
- Wish statistics show that users may have lost interest or satisfaction in Wish over time.
Wish Valuation
| Year |
Valuation ($bn)
|
| 2015 | 3 |
| 2017 | 8.7 |
| 2019 | 11.2 |
| 2021 | 8.9 |
| 2022 | 0.9 |
| 2023 | 0.1 |
(Source: businessofapps.com)
- According to Wish statistics, the valuation history of Wish from 2015 to 2023 shows an extreme rise and, consequently, a fall within less than a decade. In 2015, the valuation of the company was US$3 billion.
- The valuation almost tripled by 2017 to US$8.7 billion; it kept escalating to reach a peak of US$11.2 billion in 2019. This period was characterised by soaring investors’ confidence and a growth surge in e-commerce, especially for platforms selling cheaper goods.
- Nonetheless, valuation already dipped slightly in 2021 to US$8.9 billion, thus indicating the beginning of a downward trend.
- The decline then steepened, plunging into a sharp failure of just US$0.9 billion in 2022. In 2023, Wish’s valuation stood at a whopping US$0.1 billion (or US$100 million), corresponding to a staggering loss in market value.
- The collapse indicates severe operational problems, loss of user engagement, dwindling revenues, and possibly loss of confidence among investors.
Conclusion
According to Wish statistics, the platform is expected to be a significant player in the e-commerce landscape, with a vast registered user base and a diverse merchant ecosystem. However, the platform faces challenges in user engagement and financial performance, as evidenced by declining monthly active users and revenue.
Strategic decisions, such as focusing on high-growth markets and ensuring product quality, are crucial for Wish’s sustained success in the competitive online retail sector.
Sources
FAQ.
Wish experienced a broad drop across all major revenue streams in 2023. Core marketplace revenue dropped by 61%, logistics revenue fell 42%, and ProductBoost revenue declined 48%. The sharp overall revenue fall—from US$571 million in 2022 to US$287 million in 2023—reflects declining merchant activity, reduced consumer demand, and increased competition in the e-commerce space.
Monthly active users (MAUs) peaked at 107 million in 2020, driven by the e-commerce boom during the pandemic. However, by 2023, MAUs plummeted to just 12 million, an 89% decline. Despite reaching 680 million registered users by the end of 2023, only a small fraction remain active, indicating major engagement challenges.
While Wish’s net losses slightly improved in dollar terms (from US$384 million in 2022 to US$317 million in 2023), its losses relative to revenue worsened—from 67% to 110%. Similarly, adjusted EBITDA loss as a share of revenue rose from 50% to 82%. This indicates deteriorating operational efficiency, despite cost-cutting efforts.
In 2023, Wish incurred US$64 million in stock-based compensation and US$4 million in related payroll taxes. The company also spent US$13 million on severance as part of workforce reductions. Additional expenses included lease and asset impairments, and third-party costs tied to strategic evaluations like potential sales or restructuring.
Wish’s valuation peaked at US$11.2 billion in 2019 but dropped dramatically to US$0.1 billion (US$100 million) by 2023. This 99% decline reflects investor concerns over revenue shrinkage, user disengagement, and ongoing financial instability.

Maitrayee Dey has a background in Electrical Engineering and has worked in various technical roles before transitioning to writing. Specializing in technology and Artificial Intelligence, she has served as an Academic Research Analyst and Freelance Writer, particularly focusing on education and healthcare in Australia. Maitrayee's lifelong passions for writing and painting led her to pursue a full-time writing career. She is also the creator of a cooking YouTube channel, where she shares her culinary adventures. At Smartphone Thoughts, Maitrayee brings her expertise in technology to provide in-depth smartphone reviews and app-related statistics, making complex topics easy to understand for all readers.


