Cash App Statistics And Facts (2025)
Updated · Apr 29, 2026

Table of Contents
Introduction
Cash App Statistics: Block, Inc. (formerly Square) has recently developed Cash App, which has quickly established itself as a main player in the digital finance sphere. Operational since 2013, the app has diversified into investing, Bitcoin transactions, and banking features in addition to P2P payments.
The momentum maintained by Cash App during the year 2024 sees further measurable growth in its user base, revenues, and financial services. This article reviews the Cash App statistics and major happenings that characterized 2024.
Editor’s Choice
- According to Cash App statistics, Cash App users will total 50.7 million in 2024 and will be 17.8% of the U.S. population.
- Cash App user growth is expected to accelerate to 64.5 million in 2028 with steady annual growth.
- Conversely, Zelle and Venmo are forecasted to reach 73.2 million and 68.3 million users by 2024, respectively.
- Citing a recovery in revenues to US$16.2 billion in 2024, Cash App bounced back from dips in 2022 to show strong growth from US$0.4 billion in 2018.
- Cash App’s gross profit grew to US$5.23 billion in 2024 from US$0.19 billion in 2018, emphasising its long-term profitability.
- Bitcoin revenue through the Cash App reached US$10.1 billion in 2024, rebounding from a dip in 2022 and surpassing the peak in 2021.
- Cash App statistics state that growth in user count from 2016 to 2024, from 3 million to 57 million, was propelled by digital payment adoption.
- Most users aged 25-44 made up over 49% of the entire user base.
- However, 38% of monthly active Cash App users were from Gen Z (ages 13-25), indicating high engagement on the platform, even with limited income.
- The most financially loud groups are the Millennials (ages 26-41): 35% of all users and 42% of cash inflows; average income US$85K.
- Generation X accounted for 22% of cash inflows with a higher average income of US$113K, but only represented 19% of users.
- Baby Boomers accounted for the smallest percentage of users and inflows: 8%, showing minimal adoption within older demographics.
- Cash App’s adjusted operating income increased by 1,495% from US$25 million in Q2 2023 to US$399 million in Q2 2024 at an operating margin of 18%.
- In 2023, 22% of Cash Card spending was at big box and discount retailers, 19% at restaurants, and 15% at other retail.
Cash App Usage

(Reference: oberlo.com)
- Cash App is expected to have 50.7 million users in 2024, which makes up 17.8% of the population in the U.S. Therefore, one out of every six people in the U.S. uses Cash App at least once per month.
- User growth in the coming years is expected to be 54.9 million in 2025 (+8.3% from 2024), 58.5 million in 2026 (+6.6%), 61.7 million in 2027 (+5.5%), and 64.5 million in 2028 (+4.5%).
- Despite its healthy growth, Cash App has not reached the level of its competitors, particularly Zelle, which is expected to grow to 73.2 million users in 2024, an 8% increase from the previous year. Venmo will also reach 68.3 million users, growing 8.8%.
- The steady increase in Cash App users has been thanks to more and more attention from its parent firm, Block, towards enhancing app service related to features such as savings options and the Cash Card.
- Accordingly, the long-term vision is to ensure that Cash App gains acceptance as the wallet of choice for daily consumer transactions.
Cash App Annual Revenue
(Reference: businessofapps.com)
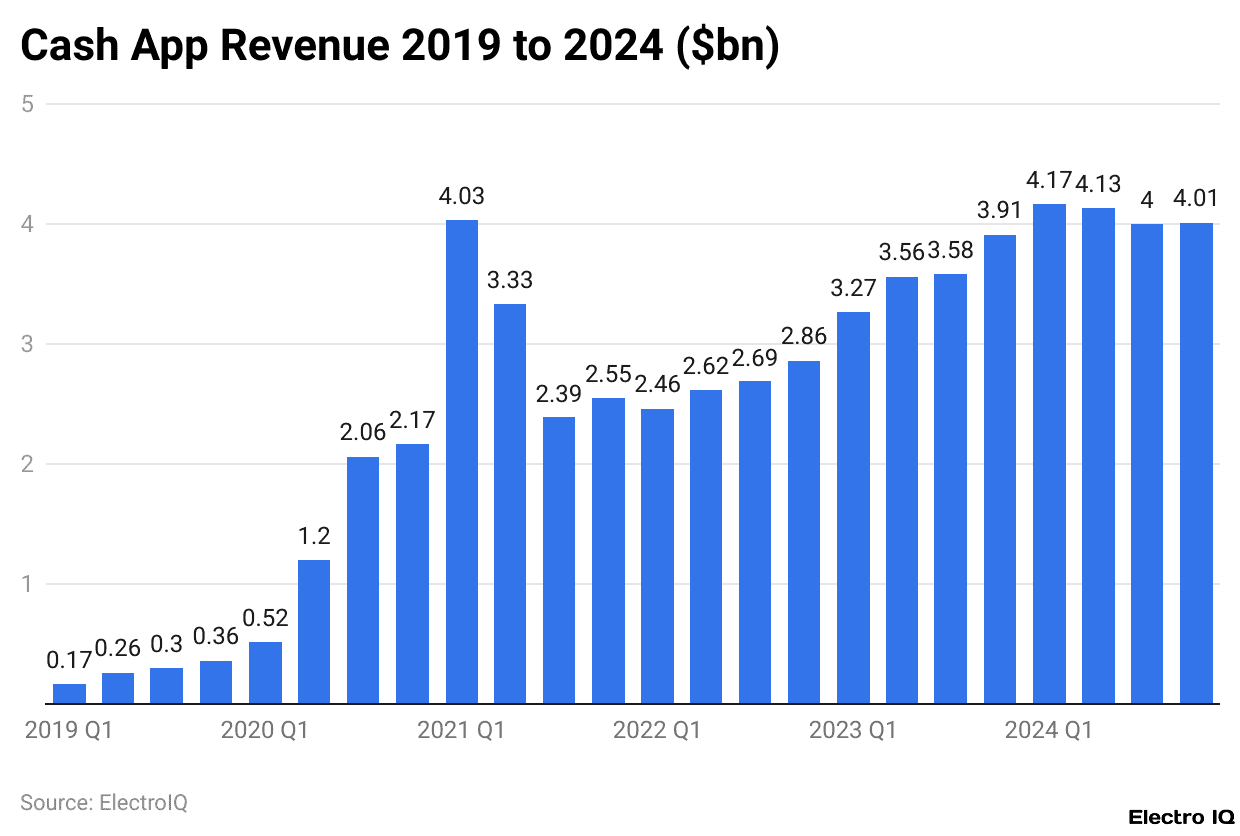
- There has been phenomenal revenue growth for Cash App over the years. The total revenue of the platform stood at US$0.4 billion in 2018. In 2019, this revenue increased more than threefold to US$1.3 billion.
- In 2020, revenue surged further to US$5.9 billion, almost five times the revenue just two years earlier. A sustained upward trend continued into 2021, when revenue was US$12.3 billion.
- However, in 2022, the revenue declined to US$10.6 billion, but then it soared back in 2023 and reached US$14.3 billion.
- According to Cash App statistics, the revenue further expanded in 2024 and reached US$16.2 billion. This is indicative of long-standing growth and significant recovery after a minor setback.
Cash App Users By Age Group
(Reference: businessdasher.com)
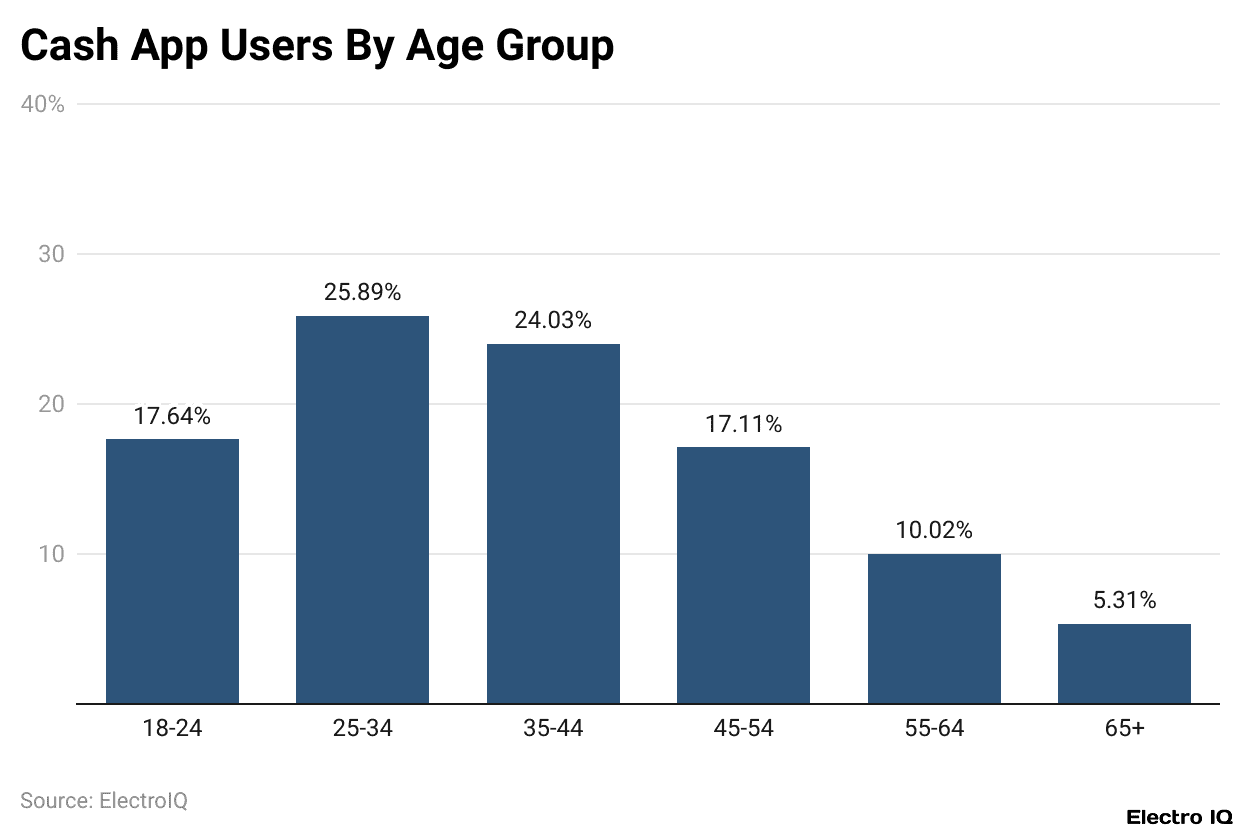
- Cash App statistics show that analysis of user age distribution indicates a fairly young adult demographic for Cash App. The biggest age cohort, 25-34 years of age, constitutes 25.89% of users.
- Close behind are those in the 35-44 age bracket, who constitute about 24.03% of the user base. In addition, 17.64% of active users are from the 18-24 group, suggesting high levels of engagement from the younger generation Z segment. 17.11% of users are from the 45-54 cohort.
- Adoption of the app decreases among older adults -10.02 % of users are aged 55-64 years, and only 5.31% are aged 65 years and above.
- This demarcation indicates that Cash App’s strongest appeal lies among those in their 20s, 30s, and early 40s, defined as being savvy in technology and most at ease digitally managing their money.
Cash App Bitcoin Revenue
| Year |
Bitcoin revenue ($bn)
|
| 2019 | 0.51 |
| 2020 | 4.57 |
| 2021 | 10.02 |
| 2022 | 7.11 |
| 2023 | 9.50 |
| 2024 | 10.10 |
(Source: businessofapps.com)
- Cash App statistics reveal that Cash App’s Bitcoin revenue has fluctuated significantly between 2019 and 2024 in terms of user activity and the external cryptocurrency space.
- Bitcoin’s revenue was only US$0.51 billion in cash. It then shot up from that modest figure in 2020 to US$4.57 billion.
- The reasons for the spectacular increase were the growing appetite of investors for cryptocurrency. The rising trend continued in 2021, with a peak of Bitcoin revenue at US$10.02 billion.
- Notably, in 2022, the revenue saw about US$7.11 billion, perhaps due to market instability and a fall in crypto prices.
- It picked up again in 2023 at US$9.5 billion and then returned again to slightly more than US$10.1 billion in 2024, thus making its highest revenue ever so far generated from Bitcoin.
- The growth signifies the continued relevance of Bitcoin as a significant cash source for the platform and illustrates how tightly coupled the performance of this revenue stream is with the trends in the crypto market.
Cash App Profit
- From 2018 to 2024, Cash App’s gross revenue soared, posting quite exceptional year-on-year growth. In the year 2018, a mere US$0.19 billion gross profit was reported on the platform.
- By 2019, this amount had more than doubled to about US$0.45 billion. Then, the profits saw astronomically increasing growth in the year 2020, whereby these profits accounted for a whopping US$1.23 billion, followed by US$2.07 billion in 2021.
- In the year 2022, profits jumped to US$2.95 billion, and the next year, 2023, they increased significantly to US$4.32 billion.
- Cash App statistics show that in 2024, gross profit moved to an even higher value of US$5.23 billion.
- This upward trend has stylishly shown how Cash App has quickly grown both in terms of financial services and its users, ranking it among major contributors to the bottom line of its parent, Block, Inc.
Cash App InFlows
| Date |
Inflows ($bn)
|
| Q4 2021 | 45 |
| Q1 2022 | 48 |
| Q2 2022 | 50 |
| Q3 2022 | 52 |
| Q4 2022 | 54 |
| Q1 2023 | 61 |
| Q2 2023 | 62 |
| Q3 2023 | 62 |
| Q4 2023 | 63 |
| Q1 2024 | 71 |
| Q2 2024 | 71 |
| Q3 2024 | 70 |
| Q4 2024 | 71 |
(Source: businessofapps.com)
- Cash App statistics show that assessment in the period 2021 and Q4 2025 actually results in a rise in inflows.
- Cash App experienced a further increasing trend in inflows, indicating a healthy engagement of customers at the end of the quarter, plus an increase in the volume of transacted dollars between quarters. The inflows added up to US$45 billion in Q4 of this year (2021).
- Over the upcoming years, inflows continued to rise quarterly within US$48 billion, the first quarter of 2022; US$50 billion, the second quarter; US$52 billion, the third quarter; and finalised within US$54 billion at the fourth quarter of 2022.
- Still continuing into 2023, an impressive leap was recorded at US$61 billion in the first quarter. This performance was duplicated in the following two quarters, with US$62 billion recorded for both Q2 and Q3. To wrap it up, in Q4, US$63 billion was recorded.
- The inflow hit US$71 billion during the first quarter of 2024 and will remain steady in Q2.
- Later, there was a slight dip to US$70 billion in Q3, but things came back to normal with US$71 billion in Q4.
- This pattern through the years emphasises the growing reliance and dependency of users towards the platform as far as financial transactions are concerned.
Cash App Users
| Year |
Users (mm)
|
| 2016 | 3 |
| 2017 | 7 |
| 2018 | 15 |
| 2019 | 24 |
| 2020 | 36 |
| 2021 | 44 |
| 2022 | 51 |
| 2023 | 55 |
| 2024 | 57 |
(Source: businessofapps.com)
- Cash App statistics reveal that between 2016 and 2024, Cash App had significant and continuous growth in users. In 2016, it had only 3 million users.
- Within a year, that number increased more than double to 7 million in 2017. The number of active users surged to over 15 million again by 2018.
- The user base was recorded at 24 million in 2019, marking another leap to 36 million in 2020, sparked by the increased number of digital transactions due to the pandemic.
- The continued growth into 2021 is recorded with 44 million users and then increasing again by 7 million to 51 million by 2022.
- Cash App also reported that it reached 55 million users in 2023 and was expected to hit 57 million by 2024.
- Such trends reaffirm that Cash App is growing more popular and continues to play an expansive role in digital payments over the years.
Cash App Gross Profit
- According to Cash App statistics, Cash App’s gross profit has shown an excellent and consistent upward trend from 2018 to 2024. The platform’s gross profit was US$0.19 billion in 2018, and it had more than doubled as of 2019, totalling US$0.45 billion, which showcased the early momentum and user interest.
- However, the real growth explosion happened in 2020 when profit soared to US$1.23 billion- nearly triple what it was a year before. This was probably stirred by the pandemic-led eruption of digital payments and online lending services.
- Growth has continued through 2021, where gross profit stood at US$2.07 billion, marking a year-on-year increase of 68%.
- The profits continued to grow in the following year, reaching an impressive US$2.95 billion, and in 2023, Cash App crossed the US$4 billion threshold, reporting US$4.32 billion in gross profit.
- By 2024, Cash App’s gross profit hit US$5.23 billion, signifying nearly 27 times in six years, from a mere US$190 million in 2018.
- The continued growth marks Cash App’s increasing innovation in the fintech space and its popularity in monetising services like Bitcoin trading, the Cash Card, and direct deposits.
- Additionally, retention of customers, increasing the number and volume of transactions, and diversifying sources of income reflect well on the platform.
Cash App Potential Customers
(Source: s29.q4cdn.com)
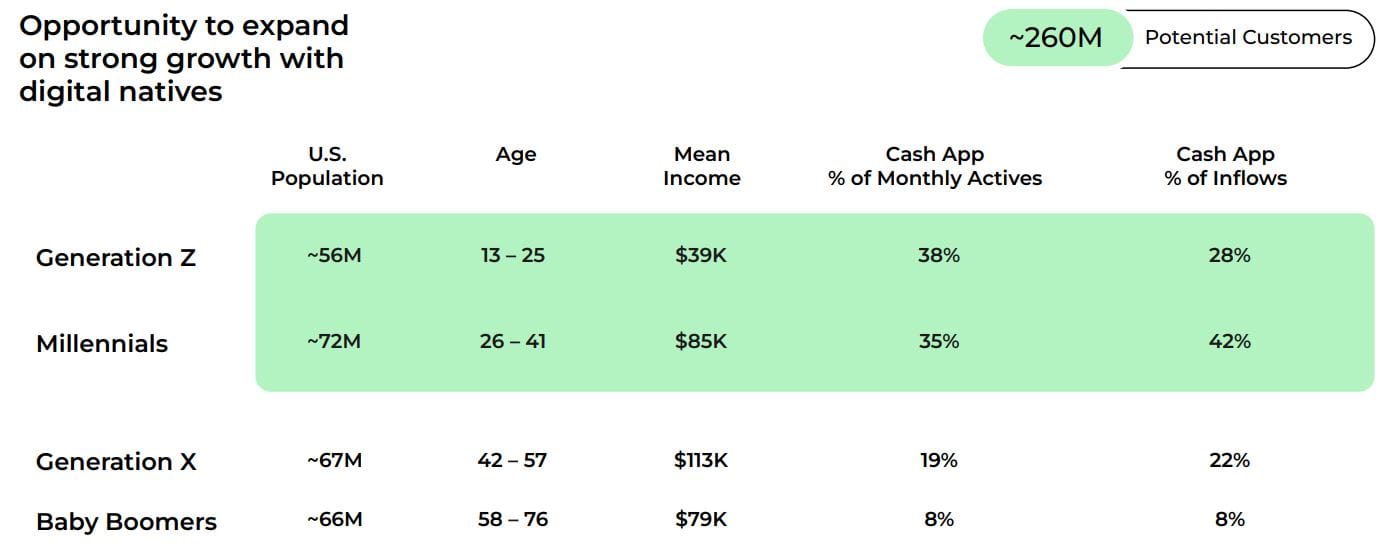
- Cash App statistics reveal that generational demographic data concerning Cash App usage in America show how varied age groups contribute differently toward activity in the platform and the financial inflows therefrom. Gen Z, arguably a loose definition, generally includes persons 13 to 25 years old, and the group has some 56 million members.
- Their average income is said to be US$39,000 per annum, which is much less in comparison to the previous generations. Hence, they represent 38% of the Cash App monthly active users and contribute 28% of the total inflows into the app.
- This shows that Gen Zs are most active on Cash App due to their comfort with mobile technology and digital payments. They are followed closely by the millennials, 26 to 41 years old, numbering about 72 million, with a considerably higher income of US$85,000.
- They are 35% of Cash App’s monthly active users and account for this being the highest inflow, at 42%. Arguably, this group exerts the most significant financial impact on Cash App today since they are at the peak of their earning years and use the app for direct deposits, investments, and purchases via Cash Card.
- Generation X, or people aged 42 to 57, numbering about 67 million, has the highest average income at US$113,000. This generation accounts for only 19% of Cash App’s active user base, contributing 22% toward the platform’s inflows.
- Cash App statistics indicate that while Gen X uses Cash App less than younger generations, they most likely transfer more money via the app than most.
- Baby Boomers, aged 58-76, about 66 million in population, averaging an income of US$79,000, constitute only 8% of Cash App’s active users, with 8% contribution toward inflows.
- Hence, Cash App is less engaging for the older generations, who, perhaps, either have adopted fewer financial technologies or prefer to use more traditional banking systems.
- In sum, the data reflect how the growth and use of Cash App are propelled by younger generations, whereas the older generation, despite earning more, prefers Cash App less.
Cash App Adjusted Operating Income (Loss)
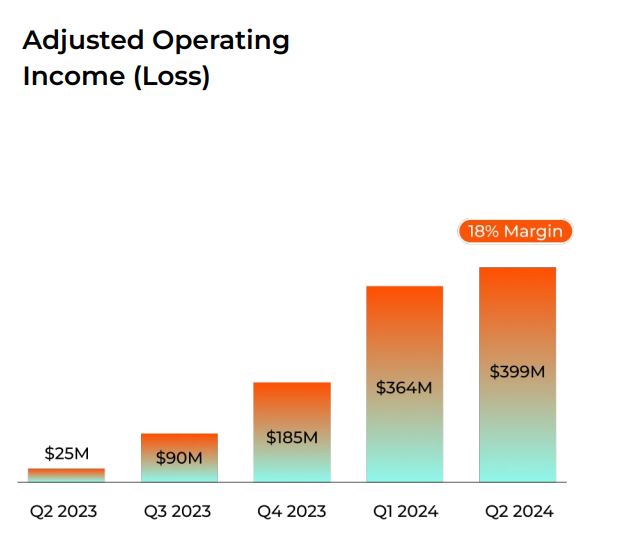
(Source: s29.q4cdn.com)
- Cash App statistics describe the trend of Cash App’s adjusted operating profit through a number of quarters, showing the tremendous increase in profitability over this time.
- In Q2 2023, the adjusted operating income came to US$25 million, which indicates a relatively small income at that point.
- Strikingly, however, it shot up US$90 million in Q3 2023, representing a dramatic quarter-over-quarter increase of 260% and meaning a drastic change in operational efficiency or income generation.
- Continuing the direction for Q4 of 2023, adjusted operating income extended further up to US$185 million, more than doubling that of the previous quarter.
- Such continued climbing indicates enhanced attendance by users using more and more features such as a Cash Card and direct deposits, and better monetisation strategies.
- The year 2024 began with an even further acceleration for Cash App.
- In Q1 2024, the adjusted operating income thus increased to US$364 million, almost double that in Q4 2023, achieving US$399 million by Q2 2024.
- Adjusted operating income shot up by more than 1,495% throughout one year from Q2 2023 to Q2 2024. These numbers go hand in hand with an 18% operating margin.
- It implies that after taxes and interests are excluded from company revenue, almost one-fifth is retained as pure profit. That is sustained and explosive growth, matured by Cash App as a profitable financial platform.
Cash App Spending On Top Merchants
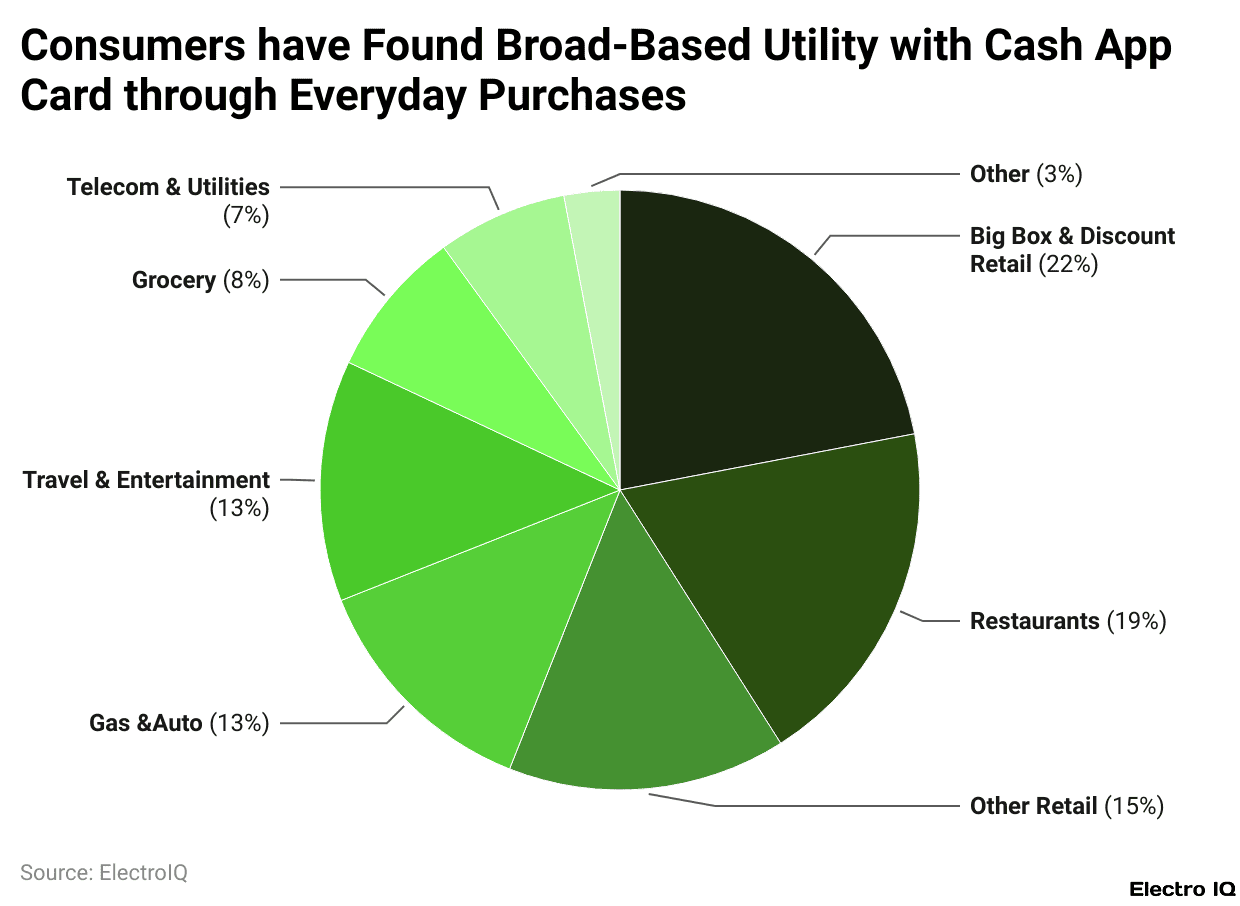
(Reference: s29.q4cdn.com)
- According to Cash App statistics, big-box and discount retail stores received the largest share of Cash App cardholder spending in 2023, at 22%, in spending on the top 250 merchants where users spent their funds across various categories.
- These include retailers such as Walmart, Target, and similar chains where likely purchases are made for all sorts of materials, from household goods to electronics.
- This, therefore, indicates that a large percentage of Cash App users account for essential and bulk purchases on their Cash Cards.
- Restaurants garnered a significant share of 19% of spending and ranked second-highest in this regard. This indicates that Cash App users frequently use the card when dining out, when taking out food, or when using delivery services, showing convenience-based spending patterns.
- Other retail purchases accounted for 15% of total cash spending. This broad category could include clothing, online shopping, specialty stores, and personal care items, indicating a strong use of the Cash App Card for various shopping events that don’t qualify as strictly essential.
- Travel and entertainment, as well as gas and auto, each accounted for 13% of the overall spend. This shows that users are also employing the Cash Card for mobility and leisure activities- from fueling vehicles to booking flights, as well as attending concerts and events.
- Grocery spending accounted for 8% of the total. The total is indeed low, given that groceries form a basic necessity and perhaps suggests that users are availing other payment methods or benefits when it comes to grocery purchases.
- Cash App statistics show that payments to telecoms and utilities accounted for 7%, indicating that a portion of users pays their different bills such as phone, internet, and energy using a Cash App Card.
- The remaining 3% is classified as Other, which may imply disjointed miscellaneous and less frequent purchases.
- Overall data seems to indicate that Cash App Card usage is well-diversified but is heavily slanted towards retail, dining, and lifestyle expenditure.
Conclusion
As per Cash App statistics, the company appears to be making its mark in the digital finance industry by increasing the number of its users under diversified revenue streams and through initiatives touching on financial inclusion. Safety measures have become all the more important given the regulatory fuss it now faces.
As Cash App moves along known and unknown paths, its future seems envisioned to be in constant innovation and accessible services for users that would love to make it grow in the years coming forward.
FAQ.
With projections to reach 50.7 million users in 2024, Cash App is expected to be 17.8% of the U.S. population. Year-on-year user growth has been witnessed, jumping from 3 million users in 2016 to 57 million in 2024. It is anticipated that it will grow to 64.5 million by 2028.
Cash App exercised revenues worth US$16.2 billion and gross profit worth US$5.23 billion in the year 2024. In 2018, it recorded revenues of only US$0.4 billion and profits of US$0.19 billion. The company has recorded quite steady growth in revenue and profits, especially after a brief slump in 2022.
Most users of Cash App are young people: Ages 25-34: 25.89%, Ages 35-44: 24.03%, Ages 18-24 (Gen Z): 17.64%. Gen Z comprises 38% of the monthly users, while Millennials (ages 26 to 41) comprise 35%, contributing the highest inflow of 42%.
Bitcoin comprises a big chunk of revenue for Cash App. By 2024, revenue from Bitcoin activities had reached US$10.1 billion, as it recovered from the dip of 2022 to surpass even the highest points recorded in 2021. This clearly displays the robust positioning of the application in the crypto economy.
For 2023, the highest transaction spenders using the Cash App Card include the following: big box/discount retailers (22%), Restaurants (19%), and Other retail (15%). Other outstanding classifications would comprise travel & entertainment (13%), gas & auto (13%), groceries (8%), and telecom/utilities (7%).

Aruna Madrekar is an editor at Smartphone Thoughts, specializing in SEO and content creation. She excels at writing and editing articles that are both helpful and engaging for readers. Aruna is also skilled in creating charts and graphs to make complex information easier to understand. Her contributions help Smartphone Thoughts reach a wide audience, providing valuable insights on smartphone reviews and app-related statistics.