Solana Statistics, Trends And Facts (2025)
Updated · Jul 15, 2026


Table of Contents
Introduction
Solana Statistics: Solana (SOL) emerged as a strong leader in 2024, setting the pace in the blockchain ecosystem across several key areas. Its high-performance network gained substantial traction in decentralised finance (DeFi), non-fungible tokens (NFTS), stablecoin transactions, and developer adoption. The Solana blockchain recorded over 200 million transactions per day by early 2024, supported by its lightning-fast throughput of 65,000 transactions per second.
The total value locked (TVL) in Solana’s DeFi ecosystem surged past USD 2.5 billion, reflecting growing investor confidence. On the NFT front, Solana hosted over 33 million NFT mints with more than USD 3 billion in total sales volume. Additionally, Solana Pay processed over 1 million transactions in Q1 2024, indicating rising adoption in real-world commerce. The number of active developers contributing to the Solana GitHub repositories reached over 2,500 by March 2024, highlighting increasing interest from the global dev community.
As of April 2024, the Solana token (SOL) traded in the range of USD 130 to USD 160, driven by increased usage and network activity. This article explores key statistics from GitHub and the wider ecosystem that showcase Solana’s rapid growth and technical development. In this article, we seek to deeply address the relevant figures that indicate Solana statistics.
Editor’s Choice
- According to Solana statistics, after a considerable price drop brought about by the 2022 FTX crash, it had a sharp rise, peaking at US$263 in November 2024 before dropping to the range of US$188 in April 2025, an impressive 88% annual increase.
- Solana attained 120 million daily active addresses in October 2024, with 138 million daily transactions recorded in December, which is shown to be high scalability and adoption.
- Total value locked (TVL) in Solana grew to US$9.5 billion in December 2024, the highest value reached since January 2022.
- The distributed network spanned across 1,177 nodes in approximately forty-six countries, with about 1,400 mainnet validators, which portrays a good degree of decentralisation.
- Solana statistics show that the company achieved around 99% uptime in 2024, with a single five-hour outage in February.
- Monthly returns in 2024 varied wildly, with major gains in March (+100%) and November (+41.3%), while significant declines occurred in April (-37.3%) and December (-20.5%).
- The price history of Solana is among the most volatile, including a 918.4% gain in 2023 and a devastating 94.2% drop in 2022.
- In dollar volume of sales among the top three blockchains in the NFT space in 2023, Solana achieved US$346 million in December, recognising the narrowing gap versus Ethereum.
- This increased NFT activity was partly attributed to the activity involving SPL-20s, akin to inscription-style NFT collections.
- Revenue from the ecosystem grew from US$6 million at the beginning of 2024 to US$92 million in November, an increase of 15 times.
- Over the same period, DApp revenue also grew from US$26 million to US$365 million, becoming the majority share of the leading top protocols.
- Solana statistics state that 50% of the total revenue that goes into the Solana ecosystem is set aside for buyback and burn of SOL tokens.
- 83.7% of the protocol revenues earned through Solana come from DeFi, while wallet revenues are only 9.6%, followed by infrastructure with 3.4%, NFTs with 2.2%, and Gaming with only 0.9%.
- Meme coin protocols brought in most of the revenue for DeFi, with US$509 million generated. Since then, monthly DApp revenue has grown from January to November at an astonishing rate of 305 times.
- Raydium is the largest DEX in this category with a monthly revenue of US$32 million, boosted by its meme coin launches using pump.fun.
- Raydium used US$28 million in November to repurchase 5.4 million RAY tokens to reward stakers.
- FDV of DEX tokens vs. revenue remained stable at around 85 % ± 10%; this shows market maturity.
Solana Price Per Day

(Source: statista.com)
- The summer of 2021 proved a massive time for the cryptocurrency Solana (SOL), news that tripled in price compared to its previous price direction over the last few years and was seen to spike alongside its popularity on NFTS and an influx into the decentralised finance department.
- However, the price would lose close to all of those gains by late 2022. The price of SOL on April 16, 2025, was US$131.45, close to what it was early in 2021; this indicates that the hype had largely receded. One of the main reasons for this decline in value was the collapse of cryptocurrency exchange FTX in 2022.
- Solana statistics reveal that FTX and its associated company, Alameda Research, had liquidated SO to avoid bankruptcy, thus precariously affecting the performance of the Solana market. Solana works in the same way as Ethereum, with both allowing users to create and trade non-fungible tokens through a blockchain.
- Solana, however, uses another underlying technology called Proof of History (Poh), which enhances the speed of processing transactions.
- While Ethereum processes about 16 transactions a second, the Solana Foundation (which is based in Switzerland and the creators of the Solana protocol) claims Solana can take up to 65,000 transactions per second.
- Solana’s other big advantage is that capital gains tax is not charged; instead, it is referred to as “gas” in Ethereum. This led to an unfair cost burden on users and an increase in the number of transaction fees per Ethereum, compared to Solana, which operated faster and more cost-effectively.
- This has spurred the popularity of Solana among NFT creators, especially in August 2021 during the NFT boom.
Solana Financial Highlights
- Solana statistics show that the date marked October 2024, in which Solana achieved a phenomenal milestone – an equitable 120 million daily active addresses in-network, which is understood to illustrate the increase in usage and community engagement.
- The network recorded an all-time high of around 138 million daily transactions just two months later in December, clearly demonstrating its extremely impressive scalability and increasing acceptance among decentralised applications and services.
- By the end of this same month, Solana’s Total Value Locked (TVL) reached US$9.5 billion, its highest since the early part of January 2022, reflecting re-trust and renewed capital inflows into the ecosystem.
- Through its over 5,170 nodes spread across 46 countries and 204 cities, the network possesses a strong global infrastructure. About 1,400 of these mainnet validators are operating within 282 data centres worldwide. This helps in reinforcing the protocol’s decentralisation and resilience.
- On the other hand, there were some changes in the validator landscape during the first half of 2024.
- Galaxy and Helius registered at the very top by total stake, joining long-time leaders like Binance, Coinbase 02, and Ledger by Figment.
- Everstake continued to be the leading validator, with over 166,000 stake accounts delegating their SOL tokens. Solana’s technical performance was equally noteworthy, having maintained almost a year of 100% uptime and registering only one disruption, which happened in February 2024 when the network had a five-hour outage.
- Thus, this record strengthens the argument for a growing reputation for reliability. On top of that, restaking got its momentum within the Solana ecosystem in 2024.
- It enabled tokenholders to restake their assets into different protocols, essentially intensifying the security, efficiency, and decentralisation of the network.
Solana Monthly Returns

(Source: cryptorank.io)
- According to Solana statistics, Solana’s USD monthly returns from 2020 to early 2025 show the volatility and performance trends over time of the cryptocurrency.
- The year started well with a gain of 22.3% in January, but an immediate downside of 36% was experienced in February, followed by a decline of 15.7% in March.
- After that, April was a modest recovery month with an increase of 6.82%, while data for the rest of the months is yet to be provided. 2024 was mixed in performance: in January, it fell by 4.64%, then in February and March posted strong recoveries of 29.4% and 100%, respectively, before another decline of 37.3% in April. May and June turned volatile again, delivering 30.5% of profit, followed by an 11.6% loss.
- There was a rise of 17.3% in July, while August diminished much of that with 21.2%. In September and October, there were slight gains of 12.5% and 10.6%, respectively, with major gains in November at 41.3%, but December also closed the year with a 20.5% loss.
- In January of the year 2023, the highlights were a return on Solana of 140.2%. However, the remaining months displayed more temperate behaviour, with February and March declining moderately by 8.7% and 3.25%, respectively.
- Solana statistics reveal that April showed some recovery by increasing 8.31% on a month-on-month basis. May and June returned to negative territory, losing 8.66% and 8.97%, respectively. July, however, saw an impressive recovery of 25.4%, but August lost 16.7%.
- September delivered 8.22%, then October (80.1%), November (54.1%), and December (71.4%) paid major returns. Solana was bearish for most parts of 2022. January opened with a major 41.6% drop and continued with the trend of generally negative returns.
- In April, the cryptocurrency saw sharp losses of 30.6%, and worse continued in May with 46.3% declines. In June, there was a further 26.8% worth of decline.
- Recovery in July amounted to 26.3%, and losses resumed in August with 25.8%. The worst month of November registered a collapse of 56.6%.
- December further added a final 29.6% kill to the year. All in all, the data depict the volatility associated with Solana and rapid swings in either direction, which characterise many cryptocurrencies, especially at the time of major events in the market or hype cycles.
Solana Annual Change In Price
(Source: cryptorank.io)
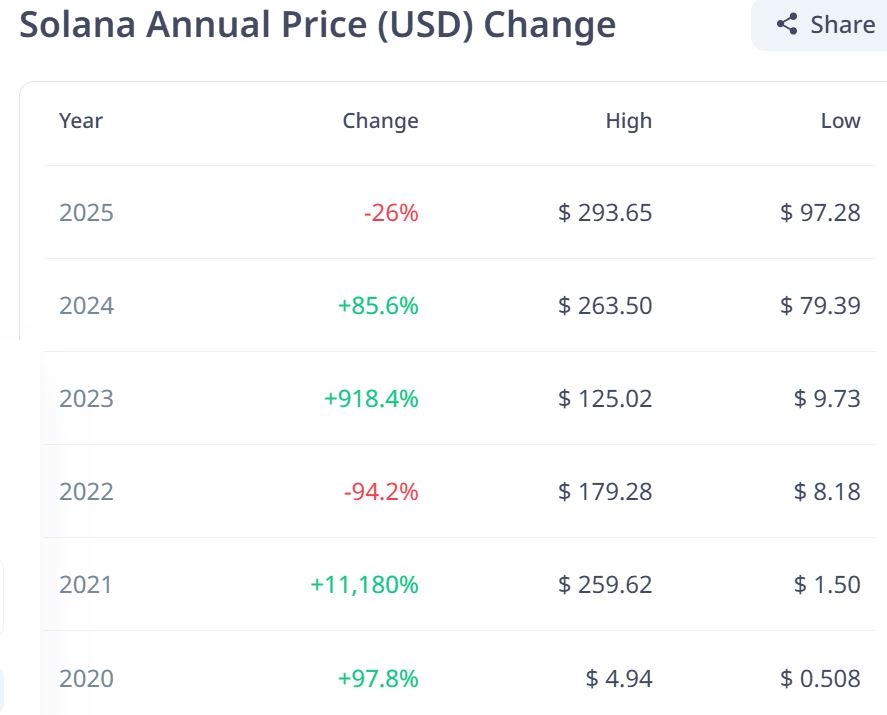
- Solana statistics indicate that USD Annual pricing fluctuations of Solana from 2020 to 2025 depict how much this cryptocurrency has risen and fallen during the respective years.
- By this present date in 2025, Solana’s price has declined by 29.6%, with its price reaching a high of US$293.65 and a low of US$97.28. This fall came after a promising year in 2024, with an increase of 85.6%, reaching a high of US$263.50 and touching down on the low of US$79.39 during the year.
- Most extraordinary growth was in 2023, when Solana was up by 918.4%. The price soared from US$9.73 to US$125.02, inarguably one of the greatest comebacks in a challenging 2022 for cryptos.
- In 2022, Solana faced a catastrophic drop of 94.2%, from its high of US$179.28 down to only US$8.18.
- Majorly, this resulted from the overall decline in the crypto market and the collapse of FTX, which had a major stake in the token.
- Meanwhile, 2021 was simply stellar for Solana, soaring 11,180%. The price bounced from US$1.50 to US$259.62, underpinned by the tremendous NFT and DeFi adoption on the Solana blockchain.
- Solana also started to be a little relevant back in the day, having posted a yearly growth of 97.8% in 2020.
- The price reached a high of US$4.94 and dropped to a low of US$0.508, the frame of reference for its super growth in the next couple of years.
- Notably, this timeline expresses that the asset is heavily volatile and dynamic, soaring very high or going deep into the valley very fast, depending on the mood of the market or the sentiment of investors.
Solana NFT Data and Trends

(Source: members.delphidigital.io)
- In the course of 2023, Solana consistently ranked in the top three blockchains in terms of NFT sales volume, confirming its viability in the digital collectables industry.
- Ethereum maintained its dominance over NFTS, yet appeared to lose considerable market activity.
- The NFT sales volume on Ethereum dropped from US$2.68 billion in February to a meagre US$750 million by December.
- In contrast, the NFT trading volume on Solana remained comparatively low during the early three quarters of 2023.
- Activity was muted due to an all-encompassing bear market in cryptocurrencies and cautious investor sentiment.
- The windfall for Solana came toward the end of the year, with the volume of NFT trading surging in November and peaking at US$346 million in December.
- This stood as the closest Solana has ever approached Ethereum in trading volume, and it has greatly reduced the gap between the two.
- Part of this lift would be provided by a White Christmas of interest around SPL-20’s brand new genre of inscribed-based NFT collection on the Solana blockchain.
- While the frenzy lasted briefly, it nevertheless contributed to the spike in activity and served as a reminder that Solana could still command interest and traffic on special occasions.
Solana DApps Revenue

(Source: bitget.com)
- Solana showcased impressive new records for the year for its revenue for the ecosystem, as well as DApp revenue in the month of November.
- Solana statistics show that the ecosystem generated US$92 million during the month, an increase from just US$6 million at the start of the year, which is a major jump of over 15 times.
- DApp revenues also became very robust, rising from about US$26 million to approximately US$365 million in November, which is nearly a 14-fold rise. With these numbers, we have a clear demonstration of rapid expansion and use of Solana within the year.
- Half of the ecosystem’s revenue is used to buy SOL back and burn it, which really helps in reducing the total supply and in having a possible impact on the value of the token.
- It needs to be clarified that DApp revenues are mainly reflective of the significant protocols and do not account for every possible source, implying that the total could be much higher. Solana’s price performance shows that the year began at around US$101.
- By November 23, it peaked at about US$263 to set a new record for the year.
- Since then, it has been on a downward trend, averaging about US$188 but still representing an approximate annual increase of around 88% despite the market changes.
Solana Ecosystem Revenue Breakdown And DeFi Dominance In 2024
- Solana statistics reveal that almost 83.7% of the protocol income within Solana’s ecosystem derives from DeFi. This shows how important decentralised finance is for the network.
- Wallet-related protocols bring in 9.6%, infrastructure types make up 3.4%, NFTS provide 2.2%, gaming only generates 0.9%, and less than 1% goes to both payment and Depin sectors.
- Taken as a whole, these figures point to the view that while DeFi is the current powerhouse of this ecosystem, there exists ample capacity for new things in gaming, payments, and even decentralised physical infrastructure (DePIN).
- Further zooming in on DeFi, protocol revenue mainly comes from the meme coins and the protocols orbiting them. Combined, these generated US$509 million in annual revenues, effectively making them the biggest players.
- According to Solana statistics, next came Telegram bot-related protocols with US$300 million, followed by spot decentralised exchanges (DEXS) with US$141 million. The meme coin-related DApps enjoyed super growth, moving from US$600,000 in monthly revenue in January to US$183 million in November, or a staggering 305-fold increase. This remarkable rise has indeed been described as “an industry marvel.”
- Among those benefiting hugely from this rise is Raydium, a significant DEX on the Solana platform. Much of Raydium’s success could be attributed to the launch of meme coins through the pump, a fun site that holds a crucial role in drawing trading volume.
- This November, platform revenue at Raydium stood at a staggering US$32 million, greatly surpassing any of its competition, about 8 times that of Orca, and as stated, 32 times that of Lifinity for the same period.
- The completely diluted FDV of DEX tokens started stabilising from April onwards, in relation to their monthly protocol revenue, within the healthy margin of 85% ± 10%, which shows improvement regarding maturity in the market, with a more consistent performance.
- Raydium also undertook a significant token buyback in November due to its exceptional revenue generation performance by buying back 5.4 million RAY tokens worth US$28 million for stakers.
Conclusion
As per Solana statistics, the company is strong and leads among blockchain platforms. Growth in market cap, transaction volume, DeFi and NFT ecosystems, and developer traction is making Solana earn its place in the crypto space. Scalability of the network, low transaction costs, and growth in institutional adoption suggest a very promising future.
Explore How Crypto Is Used in Practice
Cryptocurrency is used for more than trading and long-term holding. The guides below explore how different coins work as payment methods on platforms that accept direct wallet deposits and withdrawals.
FAQ.
After FTX collapsed in 2022, Solana made a fast recovery because of a 94.2% price drop. In 2023, SOL rose by 918.4%, and it made another 85.6% in 2024, reaching a top of US$263 sometime in November. The price corrected to US$131.45 in April 2025, marking a considerable recovery and growth.
Increased ecosystem revenue and DApp revenue experienced massive increases in 2024, much more than 15x and 14x, respectively, earning their place as growth drivers for Solana. The 120 million daily active addresses and 138 million transactions accompanied them. DeFi protocols, especially those meme coins, were the money printing machines, pulling 83.7% of all protocol revenue.
PoH on Solana allows for 65,000 transactions every second, while Ether could only manage 16. Features like this and cheap fees drew NFT makers to Solana. Solana NFT volume stood at US$346 million in December 2023, as it drew near Ethereum, which saw its volume drop to US$750 million.
Launches of meme coins through the pump resulted in Raydium being crowned the top DEX on Solana. In November 2024, Raydium grossed US$32 million in revenue and bought back 5.4 million RAY tokens worth US$28 million to reward stakers, massively outperforming competing DEXS.
Solana was running strongly with 5,170 nodes located in 46 countries with a decent level of decentralisation, including 1,400 mainnet validators. The network experienced 99% uptime since February 2024, with just one recorded outage of five hours during the month. Some prominent validators counted by stake are Everstake, Galaxy, and Helius.

Barry Elad is a passionate technology and finance journalist who loves diving deep into various technology and finance topics. He gathers important statistics and facts to help others understand the tech and finance world better. With a keen interest in software, Barry writes about its benefits and how it can improve our daily lives. In his spare time, he enjoys experimenting with healthy recipes, practicing yoga, meditating, or taking nature walks with his child. Barry’s goal is to make complex tech and finance information easy and accessible for everyone.