Trello vs Asana Statistics By Visitors, Web Traffic And Facts (2025)
Updated · Jun 23, 2025
Table of Contents
Introduction
Trello vs Asana Statistics: In 2024, Trello remains stronger in the user niche for small organisations. Parallely, Asana serves users in large organisations needing task and workflow management. This article thus performs a Trello vs Asana comparison in terms of web traffic, pricing, and scholarly insights.
Using raw numbers, percentages, and straightforward breakdowns, you’ll be guided toward which may better suit your needs, whether it’s for working on projects alone or conducting an enterprise workflow.
Editor’s Choice
- Trello grabbed much more web traffic than Asana in May 2024, with almost twice the number of weekly visitors, according to the drawing-peak numbers of 18.53 million and 8.91 million for Asana in the second week.
- Geographically, Brazil gave 19.87% (up 4.67%) of traffic to Trello, while the USA gave 33.83% (down 6.86%) to Asana, showing stronger LatAm growth for Trello and opposite for Asana.
- Direct visits are more likely to happen with Trello users (83.53% direct traffic) than with Asana (75.16% direct traffic): higher brand loyalty or bookmark use for Trello.
- Trello is beaten by Asana in organic search traffic (18.94% to 10.66%), pointing to either better SEO for Asana or just a stronger presence in search.
- Trello gets nearly half its social media traffic from YouTube (46.94%), whereas Asana depends on YouTube (37.60%) too, but with higher shares of social media traffic coming from X (14.50%) and Facebook (12.32%), suggesting a more balanced approach.
- Trello users skew younger and male, with 56.73% male users and 55.35% users under 35, whereas Asana tilts towards females at 52.98%, with more users in the age bracket 35 and above.
- Asana lowered GAAP operating losses for the fourth quarter of FY 2024 to US$67.9 million (40% of revenue), from US$99.2 million (66%) the year prior; the non-GAAP net loss stood at US$10.1 million from US$33.2 million in the prior year.
Trello vs Asana Visitor
Trello

(Source: similarweb.com)
Asana

(Source: similarweb.com)
- According to Similarweb, Trello vs Asana statistics show that in May 2024, Trello consistently led Asana in terms of weekly web traffic, swallowing almost twice the crowd for every measured period.
- In the first week of May (1st to 7th), Trello attracted roughly 16.59 million visitors while Asana managed only about 8.07 million.
- The trend only continued in the second week (8th to 14th), wherein Trello hit a monthly peak with 18.53 million visitors, with Asana trailing with 8.911 million for the same period.
- In the third week (15th to 21st), Trello dropped just a little to 17.66 million visitors while Asana was fairly steady at 8.871 million.
- Both platforms then saw modest declines in the fourth week (22nd to 28th), with Trello falling to 17.14 million versus 8.391 million for Asana. From May 29 to 31, Trello got 6.684 million visitors, while Asana drew 3.264 million.
- The partial-weekly statistics thus point toward the continuing maintenance of an approximate 2:1 ratio of top-level visitor volume favouring Trello in the full month.
- Despite some weekly changes, the main measure of engagement in May 2024 still gives Trello an upper hand with stronger user engagement and brand visibility.
Website Traffic By Country
Trello
(Source: similarweb.com)
Asana
(Source: similarweb.com)
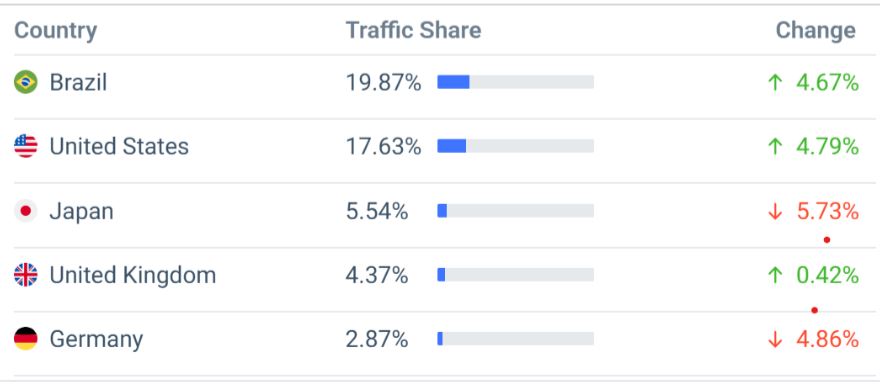
- Trello vs Asana statistics show that the traffic that hits Trello’s website is inbound from policy-wise a few big countries: Brazil leads with a share of 19.87%, with an unprecedented spike of 4.67%, perhaps a newfound interest in or acceptance of Trello.
- The United States comes in second, with a share of 17.63%, climbing at a similar pace of 4.79%. Japan represents 5.54% of the traffic, but a 5.73% reduction signals the possibility of a declining user base or less user activity.
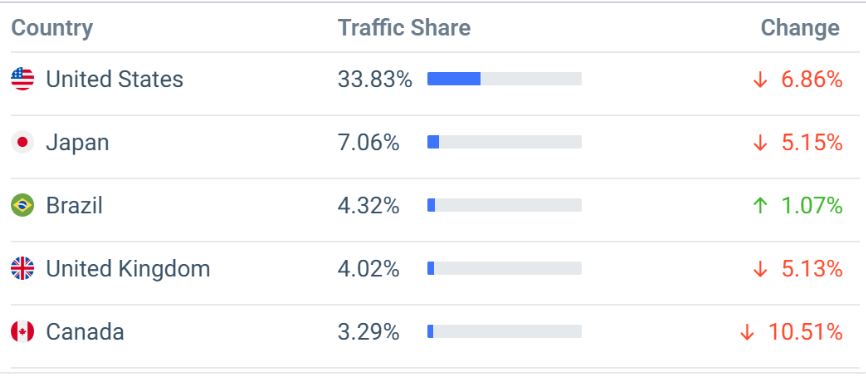
- The United Kingdom is worth 4.37% of the traffic, showing some mellower increase of 0.42%, while Germany announced 2.87%, declining sharply by 4.86%. For Asana, the United States continues to be the biggest web traffic source, contributing 33.83%.
- However, such traffic from the U.S. was seen to decrease by 6.86%, potentially a function of shifting user behaviour or market saturation.
- Japan is another contributor to the traffic, constituting 17.63%, although it underwent a decrease of 5.15%, suggesting that there might be a larger pattern of dwindling engagement in the region.
- Among the few markets undergoing augmentation, Brazil contributes 5.54% of the traffic to Asana, growing by 1.07%. The UK, which provides 4.37% of Asana traffic, saw a decrease to the tune of 5.13%.
- Canada contributes 2.87%, however, having recorded the highest shrinkage in traffic share, with a decrease of 10.51%.
Marketing Channels
Trello

(Source: similarweb.com)
Asana

(Source: similarweb.com)
- At Trello, acquiring users is highly dependent on direct traffic since 83.53% of its visits come from users typing the URL directly or having it bookmarked. This implies that the brand enjoys a huge brand presence and brand loyalty, presumably from existing users who recall the platform in their heads rather than searching or clicking on advertisements.
- Organic search contributes 10.66% to Trello’s traffic, suggesting that Trello is moderately visible in search engines such as Google.
- Paid search and referral traffic sit equally at 3.59%, meaning Trello lightly invests in advertisements and benefits from referral links from other sites.
- Social media accounts for 0.73% of traffic; display advertising is negligible with 0.04%. Email marketing is practically nothing at 0.05%, which means very little use of newsletters or promotional emails.
- As with Team Collaboration Software: Trello traffic comes predominantly from direct sources (75.16%); this represents a strong returning user base.
- However, Asana has done better in total organic search traffic coming from search engines, about 18.94%, which implies either better SEO or more intent search queries.
- Paid searches account for 2.05% of Asana’s traffic, indicating a more cautious advertising spend than Trello’s.
- While referrals come at 3.01%, display ads rank at 0.15%; on the other hand, social media has a 0.61% stake, and email marketing contributes 0.08%, both marginally higher than Trello but still negligible.
- Both platforms mostly rely on direct and organic channels, while Trello is more dependent on direct traffic; meanwhile, Asana sees more benefit from search engine visibility.
Social Traffic
Trello
(Reference: similarweb.com)
Asana
(Reference: similarweb.com)
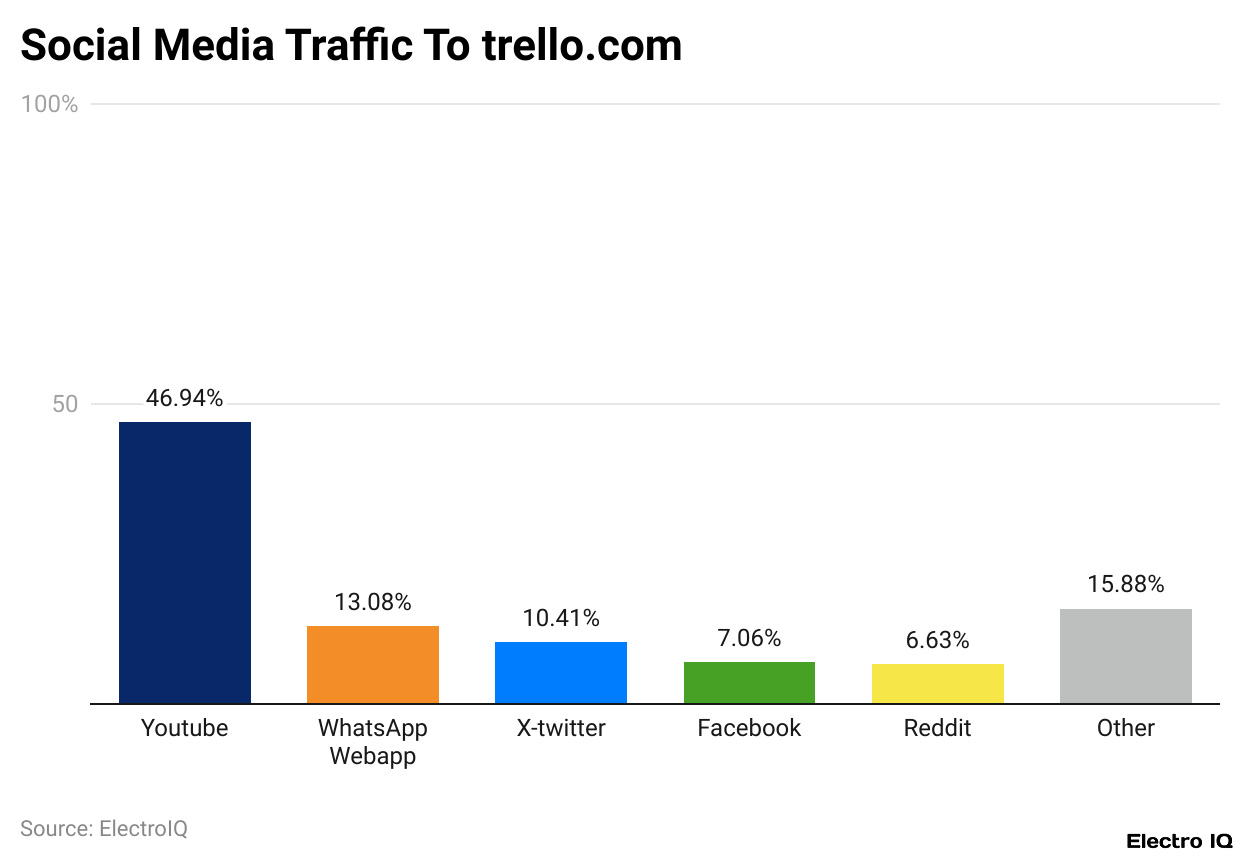
- Trello receives the majority of its social media traffic from YouTube, accounting for 46.94% of its total social traffic. This suggests that Trello’s user engagement and promotional content on YouTube are particularly strong.
- WhatsApp contributes 13.08%, indicating that users often share Trello links or content via direct messaging. X (formerly Twitter) makes up 10.41%, followed by Facebook at 7.06%, and Reddit at 6.63%.
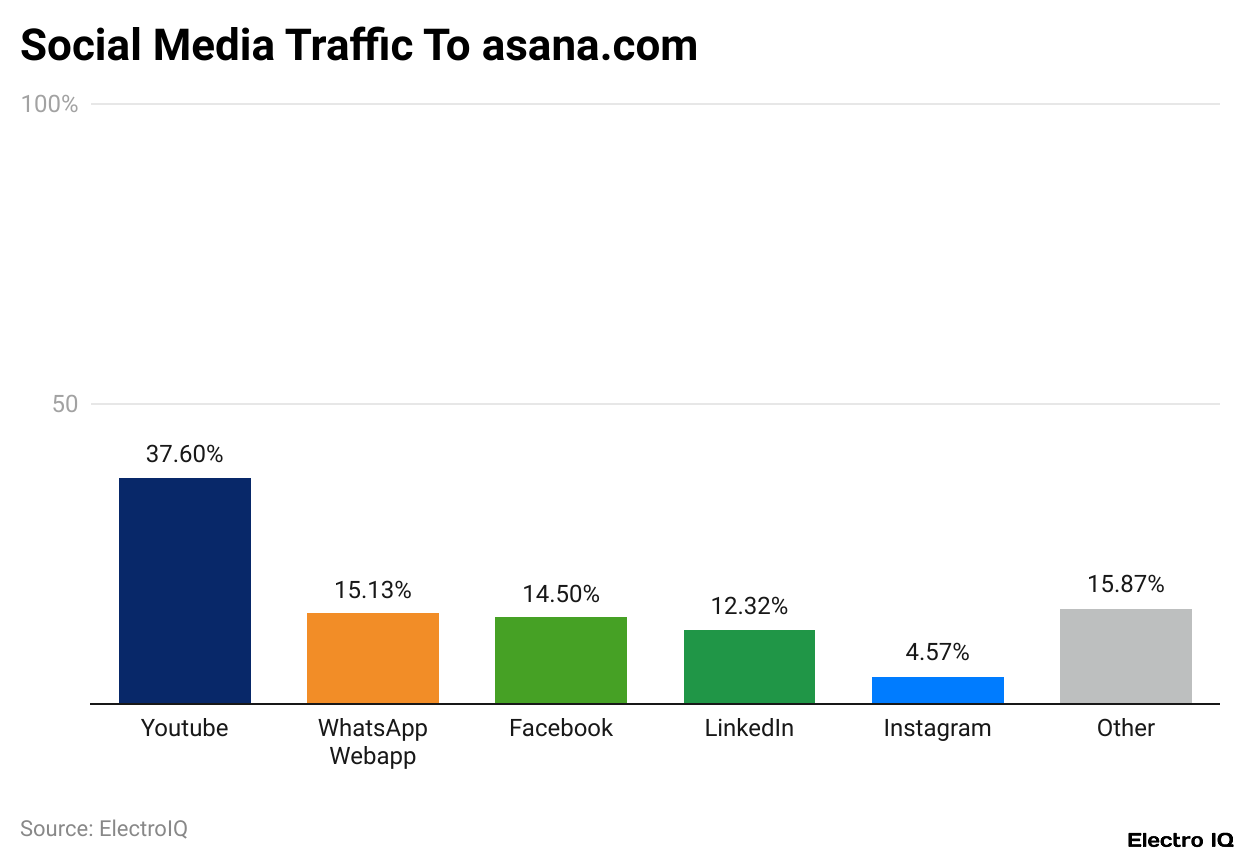
- The remaining 15.88% comes from various other social platforms. For Asana, YouTube also leads as the top source of social traffic, but at a slightly lower percentage of 37.60%.
- WhatsApp accounts for 15.13%, a bit higher than Trello’s, showing greater peer-to-peer sharing.
- X contributes 14.50%, which is notably higher than Trello’s share, suggesting more active discussions or link sharing related to Asana on that platform.
- Facebook drives 12.32% of social traffic—also higher than Trello—while Reddit contributes 4.57%. Like Trello, 15.87% of Asana’s traffic comes from other miscellaneous sources.
- In general, both applications are heavily YouTube-dependent, but Asana shows a more equitable traffic spread across X, Facebook, and WhatsApp, while the presence of Trello is consolidated on YouTube.
Website Demographics
Trello

(Source: similarweb.com)
Asana

(Source: similarweb.com)
- More males than females make use of the platform, with 56.73% of Trello users describing themselves as males and 43.27% as females.
- The platform draws a younger crowd, with the largest age group being 25 to 34 years, comprising 30.17% of users.
- Followed are in the 18 to 24 age bracket with 25.18%, and then 35 to 44 with 17.46%.
- On the other hand, Asana records a higher percentage of female users, 52.98% female and 47.02% male, and it draws a slightly older user set compared to Trello.
- The biggest one is 25 to 34 at 31.37%, followed by 35 to 44 at 21.02%, and 45 to 54 at 17.54%. Meanwhile, only 10.24% of Asana’s users are 18 to 24 years, whereas, from 55 and above, the larger age set is more active on Asana.
- This is to imply that Trello is more appealing to a majority of younger and male audiences, whereas Asana is somewhat of an all-purpose term for older generation audiences with more equitable gender distribution.
Asana Financial Performance
- The financial results of Asana for Q4 of FY 2024 showed substantial enhancement over those of a similar period in FY 2023.
- The company had reported a GAAP operating loss of US$67.9 million, or 40% of revenue, showing major improvement from US$99.2 million (66% of revenue) reported for Q4 of FY 2023. On a non-GAAP basis, operating loss was US$15.6 million or 9% of revenue, compared to US$37.4 million or 25% of revenue for the same quarter in the previous year.
- Net losses also came down for Asana. Net loss GAAP for the quarter was US$62.4 million, down from US$95.0 million in the year-ago quarter. That translated into a GAAP net loss per share of US$0.28 as compared to US$0.44 in Q4, FY 2023.
- On a non-GAAP basis, net losses stood at US$10.1 million, an improvement from US$33.2 million reported during the same quarter last year. The non-GAAP net loss per share correspondingly shrank to US$0.04 from US$0.15 reported in the year-ago quarter.
- The cash flow situation did show signs of improved financial management. Operating cash flows stood at minus US$15.3 million, against the operating cash flows of minus US$31.1 million for Q-4 FY2023. Free cash flow was minus US$17.0 million against the previous year of minus US$26.5 million.
Trello vs Asana – Comparison of Pricing Structure
- Trello and Asana are both tiered pricing models that try to appeal to several user types, with Trello normally being cheaper and Asana being more expensive with advanced features.
- Both software providers offer free plans. Trello’s free plan allows for 10 users, while Asana can handle 15 users on its free plan. Trello’s free tier is just basic functionality with some limits on Power-Ups above that, whereas Asana’s free tier is a little more feature-rich in terms of task tools and collaboration.
- An entering paid plan is US$5 per user per month billed annually, giving Trello the ability to expand their views on boards and introduce very simple automation features; from a premium level, prices go higher up to US$9.99 plus extra charges based on the options and add-ons that you select for your project management tools.
- The first paid tier of Asana is Premium, which goes for US$10.99 per user/month and offers features for timeline views, task dependencies, advanced reporting, and more. The Business tier costs US$24.99 per user/month and contains features that go higher in sophistication, like workload management, custom rules, and integrations for overseeing projects at a larger scale.
- Trello is for teams or individuals working on smaller budgets looking for straightforward task management, while Asana is for professional teams needing more in-depth features and workflow automation.
Conclusion
Trello vs Asana Statistics: In 2024, Trello and Asana continue to serve distinct yet overlapping audiences. The market share of Trello is higher (1.51% vs 1.13%). On the contrary, being less in numbers but highly featured, Asana caters to large teams and enterprises with better workflow automation and governance, collaboration that goes on to justify its Premium tier of US$10.99 per user.
Both have average ratings of 4.5/5, but Trello boasts a larger number of users. Ultimately, it depends on your project requirements: opt for Trello if it’s simple; for advanced and complex projects, use Asana.
Sources
FAQ.
Trello had much higher web traffic in May 2024, averaging close to double the weekly visitors that Asana would get. Trello also hit a peak at 18.53 million weekly visitors, considerably ahead of Asana’s best at 8.91 million visitors. Overall, Trello kept a 2:1 visitor ratio to Asana throughout the month.
Trello’s crowd is skewed younger and male, with 56.73% males and 55.35% under 35 years old. Asana’s users are 52.98% female and have more people in the 35-and-above range, so they are more broadly accepted at the pro and enterprise team levels.
When it comes to price, Trello is the cheaper of the two, billed at US$5/user/month. It is perfect for people or small teams who must engage in basic tracking of projects. Asana starts at US$10.99/user/month and provides more sophisticated tools, like timeline views, task dependencies, and workload management. This makes it suitable for bigger teams and complex projects.
Trello has its largest market in Brazil at 19.87%, growing actually in Latin America, and next in the U.S. at 17.63%. For Asana, the U.S. remains the main market, though it saw a decline in May 2024 in U.S. traffic; Japan is a significant market for both as well, but it has seen a drop in engagement.
Asana managed to improve its financial condition by lowering its GAAP operating loss to US$67.9 million, up from US$99.2 million YOY; meanwhile, the net loss on a non-GAAP basis was down to US$10.1 million from US$33.2 million. Free cash flow loss at –US$17.0 million also improved under cost controls and enhanced financial position.

Joseph D'Souza founded ElectroIQ in 2010 as a personal project to share his insights and experiences with tech gadgets. Over time, it has grown into a well-regarded tech blog, known for its in-depth technology trends, smartphone reviews and app-related statistics.


