Pet Ownership Statistics, Trends And Facts (2025)
Updated · Jun 10, 2026

Table of Contents
- Introduction
- Editor’s Choice
- U.S. Overall Pet Ownership Statistics 2025
- Pet Population and Density 2025
- Demographics – Generation by Generation in 2025
- Total Pet Industry Spending in the US in 2025
- Cost, Insurance, and Financial Burdens
- Adoption Sources and Pet Acquisition Trends
- Human-Pet Bonding and Behavioral Trends
- State-by-State Pet Ownership Variation in 2025
- Global Pet Ownership Statistics 2025
- Pet Tech and Accessory Trends in 2025
- Conclusion
Introduction
Pet Ownership Statistics: If you’ve ever wondered how big the pet world has become, you’re in the right place. In 2025, pets aren’t just companions; they’re family, emotional support, and a huge part of our lifestyle. I put together this article to help you truly understand what pet ownership statistics look like today, not just with numbers, but with real insight into how we live, spend, and care for our animals.
We’ll explore everything from how many households have pets to how much people spend, what generations are leading the way, and even how technology is changing how we care for our pets. Think of this as a data-packed guide, the kind you’d want to read, adopt, or, if you’re just curious about where the pet world is heading
Editor’s Choice
- In 2025, over 94 million households in the U.S. will have at least one pet. That’s a huge 71% of homes. It clearly shows how emotionally bonded Americans are with their pets.
- With nearly 7 million dogs being owned nationwide, they remain the most popular pets. Cats follow with 73.8 million. It’s safe to say these two rule the pet kingdom in America.
- Millennials make up 30% of all pet owners now, and Gen Z is not far behind. Around 20% of all pet-owning households are Gen Z, that’s about 8 million households. They treat pets like their own children.
- Spending on pets has exploded. From food and treats to vet care and accessories, Americans are set to spend over US$157 billion in 2025. That includes inflation-adjusted surges in pet services and specialty products.
- The average cost of owning a dog ranges from US$1,390 to US$5,292/year, depending on breed and health needs. For cats, it’s slightly lower, but still significant. With inflation and emergency vet visits, the financial burden is real.
- About 31% of cats and 23% of dogs are adopted from shelters. That’s a positive trend, showing how people are increasingly opting to give rescues a second chance at life.
- Around 97% of pet owners say their pets are part of the family. Gen Z, in particular, has the lowest overall pet ownership at just 2%. Regional culture and urbanization play a big role.
- For instance, Idaho has the highest dog ownership rate at 3%, while the District of Columbia has the lowest overall pet ownership at just 38.2%. Regional culture and urbanization play a big role.
- The worldwide market is expected to expand to hit over US$368.88 billion by 2030. The U.S. leads the charge, but countries like Brazil, China, and the UK are also seeing rapid growth in pet ownership numbers.
- Smart collars, AI feeders, GPS tracking, and even pet wellness apps are becoming mainstream. The pet tech market is expected to be valued at nearly US$7 billion by 2030. It’s changing how urban households manage pet care.
| Insight No. | Summary |
| 1 |
94M + U.S. households own pets in 2025 |
|
2 |
Dogs: 89.7M owned; Cats: 73.8M |
| 3 |
Millennials: 30%; Gen Z: 20% pet households |
|
4 |
The pet industry is projected $ be $157B in 2025 |
| 5 |
Average annual pet cost: $1,390 to $5,295 |
|
6 |
31% of cats, 23% of dogs come from shelters |
| 7 |
97% see pets as family; Gen Z buys gifts, cakes, etc. |
|
8 |
State Variance: Idaho (58.3%), D.C. (38%.2%) |
| 9 |
Global markets: $368.88b by 2030 |
|
10 |
Pet tech revolution: AI feeders, GPS, wearable collars |
U.S. Overall Pet Ownership Statistics 2025
 (Reference: petfoodindustry.com)
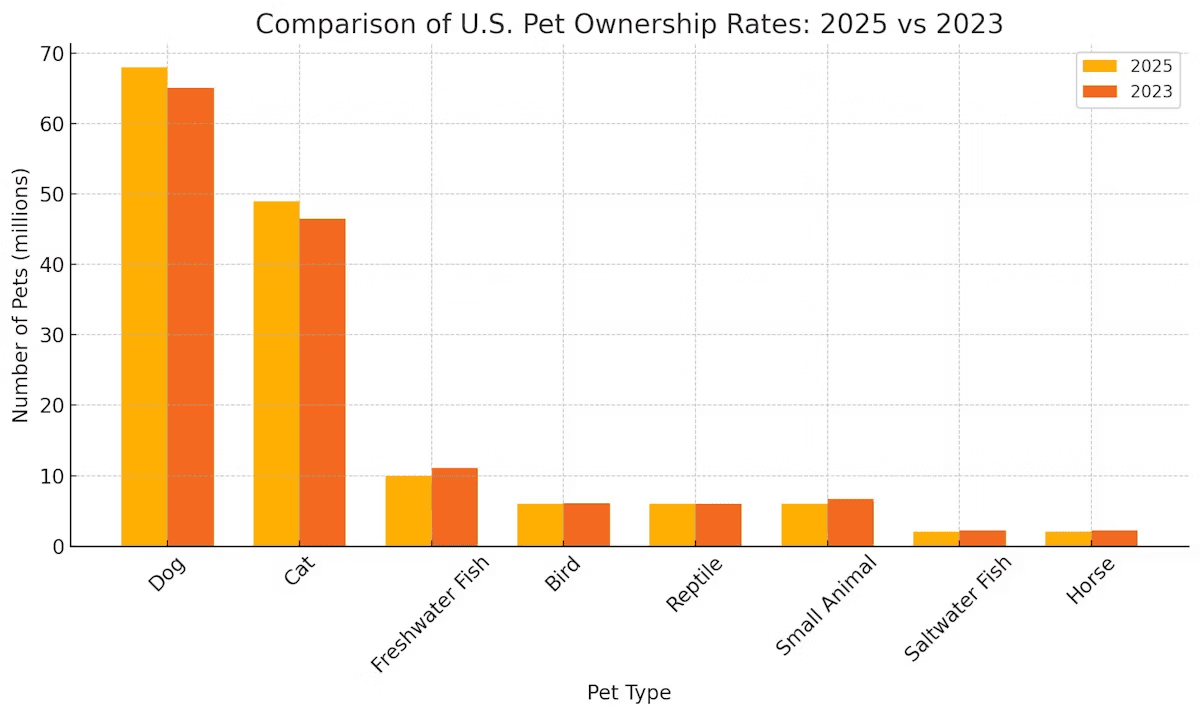
- In 2025, 94 million U.S. households own a pet, representing 71% of all households, up from 82 million ie 66% in 2023, a clear indicator of consistent growth.
- Dogs are owned in 68 million households, about 51% in 2025. This is an increase from 65.1 million in 2023 to 24 million, showing stable interest in canine companionship.
- Cats are present in 49 million households, around 37% in 2025, rising from 46.5 million the year prior, moving in step with dog ownership growth.
- Freshwater fish ownership dropped slightly to 10 million households, which is 2.9% down from 11.1 million in 2023 to 2024, signaling shifting preferences.
- Ownership of small mammals declined to 6 million households, down from 6.7 million, suggesting consolidation in niche pet segments.
- Bird owners remained steady at 6 million households, virtually unchanged YoY, showing stable interest in avian pets.
- Reptile ownership held steady at approximately 6 million households, reflecting a consistent niche audience.
- Saltwater fish and horses both saw minor declines of roughly 0.2 million households in 2025, indicating small fluctuations in specialty pet ownership.
- Millennials represent 30% of pet owning households, making them the largest single generation in this statistic set for 2025, ahead of Gen X, and older aged people.
- Gen Z comprises 20% of pet-owning households, about 18.8 million, up 43.5% from 2023, highlighting rapid growth in younger adoption patterns.
| Metric | 2025 Estimate |
| Total pet-owning households | 94 million, about 71% |
| Dog-owning households | 68 million, which is 51% |
| Cat-owning households | 49 million, about 37% |
| Freshwater fish households | 10 million (2.9%) |
| Small mammal households | 6 million |
| Bird-owning households | 6 million |
| Saltwater fish and horse households | Slight decline of 0.2 million |
| Millennial pet households | 30% of all households |
| Gen Z pet households | 20% of all households (18.8 million) |
| Reptile-owning households | 6 million |
Pet Population and Density 2025
 (Reference: worldanimalfoundation.org)
- The estimated total number of pet dogs in the U.S. stands at 89.7 million, with an average of 1.5 dogs per dog-owning household, consistent with AVMA data from 2024.
- There are approximately 73.8 million pet cats in the country, averaging 1.8 cats per cat-owning household, reflecting higher clustering per household.
- Smaller pet types: 3.9 million households keep freshwater fish, making fish the third most common pet segment by household count.
- Reptile households number about 2.3 million, accounting for roughly 1.8% of all U.S. households, a consistent niche figure.
- Birds are kept by around 2.1 million households, making up 1.6% overall, a stable long-term figure.
- Small mammals such as hamsters and gerbils live in 1.3 million households, about 1% showing a modest but meaningful presence.
- Rabbits are pets in 0.9 million households, about 0.7% indicating a specialized animal segment still relevant to enthusiasts.
- Approximately 0.7 million U.S. households own horses is 0.5% showing that equine ownership remains stable but limited.
- Poultry such as backyard chicken reach 0.7 million households, around 0.5% though APPA places backyard chicken ownership at 11 million households, revealing reporting variation.
- These density figures help illustrate how concentrated pet populations are and which species dominate based on average household counts.
| Pet Type | Population / Stats |
| Dogs | 89.7 million |
| Ctas | 73.8 million |
| Freshwater Fish | 3.9 million households |
| Reptiles | 2.3 million households |
| Birds | 2.1 million households |
| Small Mammals | 1.3 million households |
| Rabbits | 0.9 million households |
| Horses | 0.7 million households |
| Poultry (Chicken) | 0.7 million households |
| Average Pets/Household | Dogs: 1.5, Cats: 1.8 |
Demographics – Generation by Generation in 2025
 (Reference: worldanimalfoundation.com)
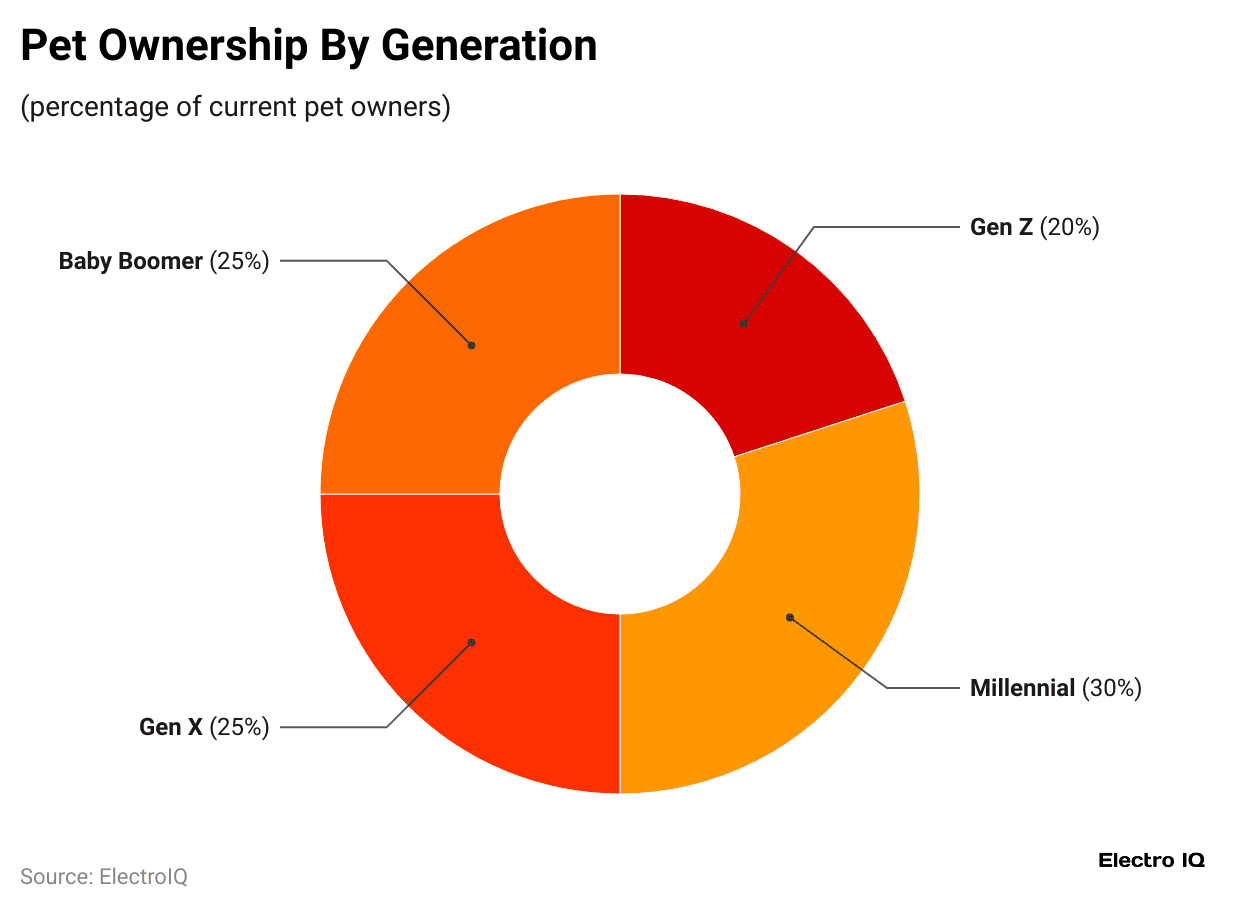
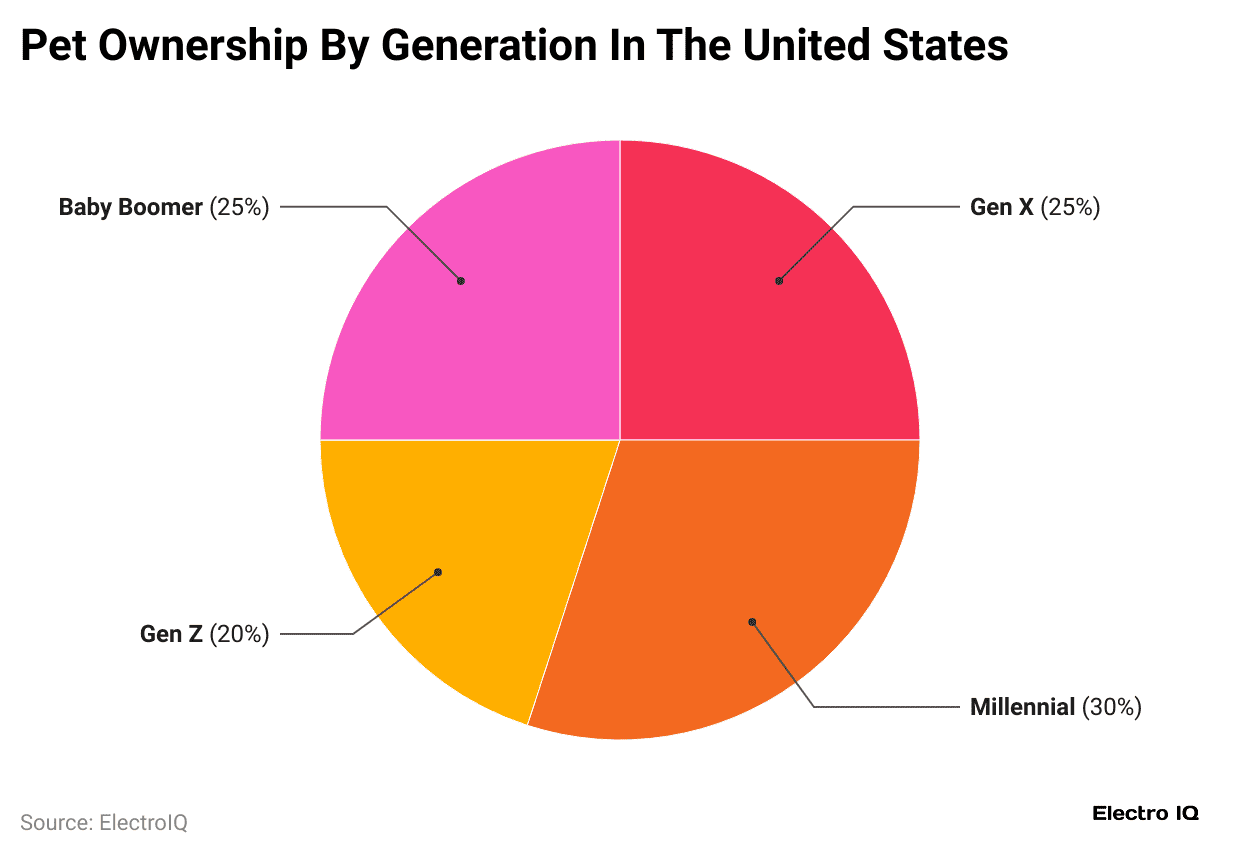
- Millennials compose 30% of all pet-owning households in the U.S., making them the largest generational cohort in this space for 2025.
- Gen X and Old age people each account for 25% of pet-owning households, maintaining a substantial presence, albeit with slower growth than younger cohorts.
- Gen Z makes up 20% of pet-owning households, representing about 18.8 million homes, and this is a 43.5% YoY growth from 2023.
- Notably, 70% of Gen Z pet owners report having two or more pets, a much higher multi-pet growth from 2023.
- Among Gen Z dog owners, 58% are men, marking a 15% increase over 2023 gender breakdowns.
- Among Millennial dog owners, 63% are men, showing a strong gender shift in canine ownership patterns.
- Cat ownership among younger men also rose sharply: 38% of Gen Z cat owners and 46% of Millennial cat owners are men, both double-digit jumps from prior years.
- Social media plays a big role: Gen Z pet consumers rely heavily on platforms like TikTok, YouTube, and Instagram for pet product discovery and community influence.
- Younger generations are driving humanization trends, fwith ully 50% of Gen Z now describing their pets as actual children, per survey data.
- Gen Z pet owners spend significantly more monthly, which is equal to $216 Vs. Older people aged $134. Reflecting both emotional and financial commitment to their pets.
| Generation | Stat |
| Millennials | 30% of pet households |
| Gen X | 25% |
| Older aged people | 25% |
| Gen Z | 20% 18.8 million households |
| Gen Z with 2+ pets | 70% |
| Gen Z dog owners (men) | 58% |
| Millennial dog owners (men) | 63% |
| Gen Z cat owners | 38% |
| Millennial cat owners (men) | 46% |
| Gen Z vs. Older Aged | $216/month vs. $134/month |
Total Pet Industry Spending in the US in 2025
 (Reference: worldanimalfoundation.com)
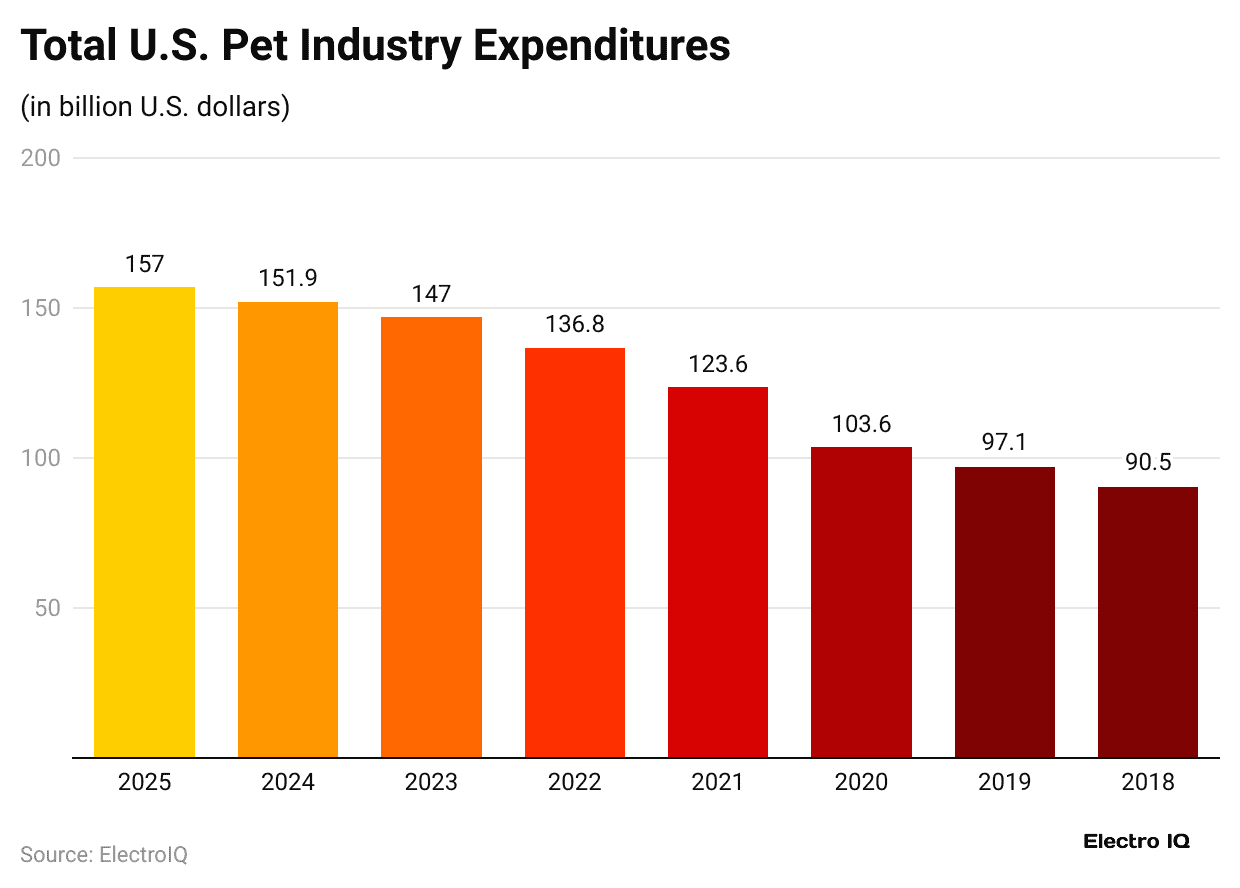
- In 2024, total U.S. pet-industry expenditures reached US$152 billion, a robust increase from previous years.
- The industry is projected to reach US$157 billion in sales in 2025, reflecting steady upward momentum in pet spending.
- Pet food and treats accounted for about 44% of total spend in 2023 to 2024, holding a dominant share of the market.
- Vet care and product sales made up around 25.8% of total industry sales, totaling about US$39.1 billion in 2023.
- Supplies, live animals, and OTC medicines represented about 21.3% or US$32 billion of expenses in the same period.
- Pet services, including grooming, boarding, and training, rose sharply: services inflation ran at about 4.6% YoY in April 2025, compared to food inflation at around 22% since 2019.
- Spending at pet stores declined by about 4% YoY in April 2025, while vet spending dropped 1% YoY, possibly due to more purchases through grocery or insurance usage.
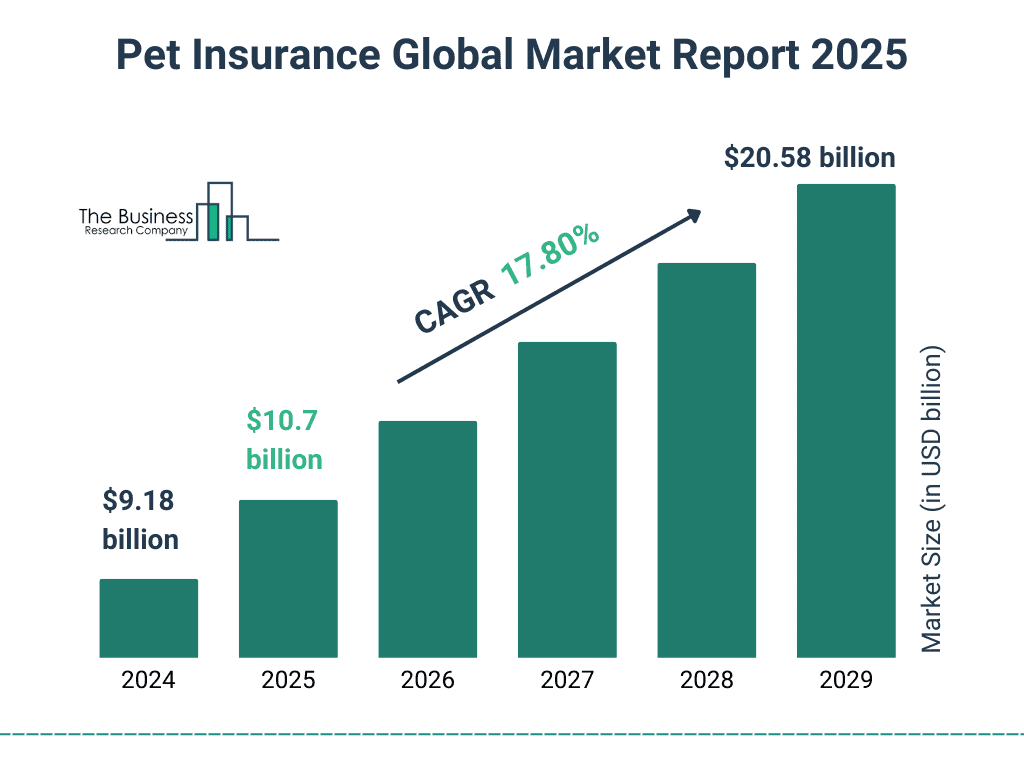
- The rise of pet insurance is notable, with 20% annual growth since 2020, though the overall insured share remains relatively low, providing room for expansion.
- A strong 77% of U.S. pet owners say economic uncertainty has not affected their decision to keep a pet, illustrating the resilience of pet spending behaviour.
- Many younger and child-free couples are willing to go into debt average pet emergency expense expectations reach $5,004, and 68% of child-free couples reported readiness to incur debt for such emergencies.
| Category | Stats |
| Total pet industry expenditure (2024) | US$152 billion |
| Projected industry sales (2025) | US$157 billion |
| Pet food and treats | 44% of total spend |
| Veterinary care and products | US$39.1 billion over 25.8% |
| Supplies & OTC medicines | US$32 billion (21.3%) |
| Pet services inflation | 4.6% inflation (since 2023) |
| Pet store spending YoY | 4% YoY |
| Vet spending YoY | 1% YoY |
| Pet insurance annual growth | 20% annual growth |
| Emergency vet cost expectation | $5,004 |
Cost, Insurance, and Financial Burdens
 (Source: thebusinessresearchcompany.com)
- The average annual cost of owning a dog ranges widely from US$1,390 to US$5,295, depending on breed, size, health, and geographic location.
- The average annual cost of owning a cat is lower, often under US$1,500, but varies based on medical care and premium diets. Financial burden remains meaningful.
- Only about 24% of pet owners in the U.S. carry pet insurance, even though veterinary costs are rising rapidly.
- Among those child-free adults, 68% said they would incur debt to cover pet emergencies, demonstrating a deep emotional connection that outweighs finances.
- Nearly one-third of pet owners have used credit cards to pay for vet treatments, signaling financial strain in some households.
- A recent analysis found that pet services inflation is 42% above 2019 levels, compared to 22% in pet food prices, showing diverging cost trends.
- Veterans of all ages cite affordability and appointment availability as major barriers, 60% cite cost, and 32%convenience regarding vet care access.
- Concerns about access to pet services like grooming or boarding affect 22% of owners, with 38% citing cost and 31% citing appointment difficulty.
- Despite rising costs, many owners consider pets equivalent to family: 97% of pet owners see pets as part of their family unit, with Gen Z most likely to see pets as actual children.
- Many owners face emotional as well as financial distress when caring for sick pets; some sell personal items or take loans to fund medical care, highlighting the psychological impact.
| Aspect | Details |
| Annual dog ownership cost | $1,390 to $5,295 |
| Annual cat ownership cost | $1,500 |
| Pet insurance coverage | 24% of pet owners |
| Willing to incur debt (Child-free) | 68% |
| Credit card use for vet care | 33% |
| Pet services inflation | 42% |
| Pet food inflation | 22% |
| Veterinary care affordability concern | 60% cite cost, 32% cite convenience |
| Access to pet services concern | 38% cost, 31% access |
| Pets considered family | 97% of owners |
Adoption Sources and Pet Acquisition Trends
 (Reference: thebusinessresearchcompany.com)
- Approximately 23% of dogs and 31% of cats originate from animal shelters or humane societies in 2025, highlighting growing rescue and adoption trends.
- ASPCA reports 38% of dog owners and 40% of cat owners adopt from shelters or rescues, reinforcing the leading role of nonprofit adoption channels.
- Around 20% of dog owners and 28% of cat owners report pets were obtained from friends or family, indicating informal networks remain relevant.
- 34% of dog owners obtained pets from breeders, while only 3% of cat owners did, showing that breed-based acquisition is much more common for dogs.
- 6% of dogs and 27% of cats were rescued as strays, a strong reflection of spontaneous adoption and stray recovery efforts.
- Private sales accounted for 12% of dogs and 6% of cats, showing that informal purchases remain part of acquisition pathways.
- Other miscellaneous sources account for 32% of dog acquisitions and 39% of cat acquisitions, capturing miscellaneous or undefined sources.
- The pandemic adoption surge (March 2020 to May 2021) remains visible, with roughly 1 in 5 households acquiring a dog or cat during that period, according to APPA.
- Shelters remain the leading channel, but younger owners (Gen Z, Millennials) are more likely to adopt versus purchase, which continues into 2025 trends.
- Pet ownership statistics 2025 shape adoption pathway,s shape demographic, pet culture. Rescue adoption is now normalized and preferred by many socially conscious owners.
| Source / Trend | Percentage / Info |
| Dogs from shelters | 23% |
| Cats from shelters | 31% |
| Dogs from friends/family | 20% |
| Cats from friends/family | 28% |
| Cats from breeders | 3% |
| Dogs from breeders | 34% |
| Dogs found as strays | 6% |
| Cats found as strays | 27% |
| Dogs via private sale | 12% (dogs), 6% (cats) |
| Pandemic adoption surge | 1 in 5 households (2020 to 2021) |
Human-Pet Bonding and Behavioral Trends
 (Reference: habri.org)
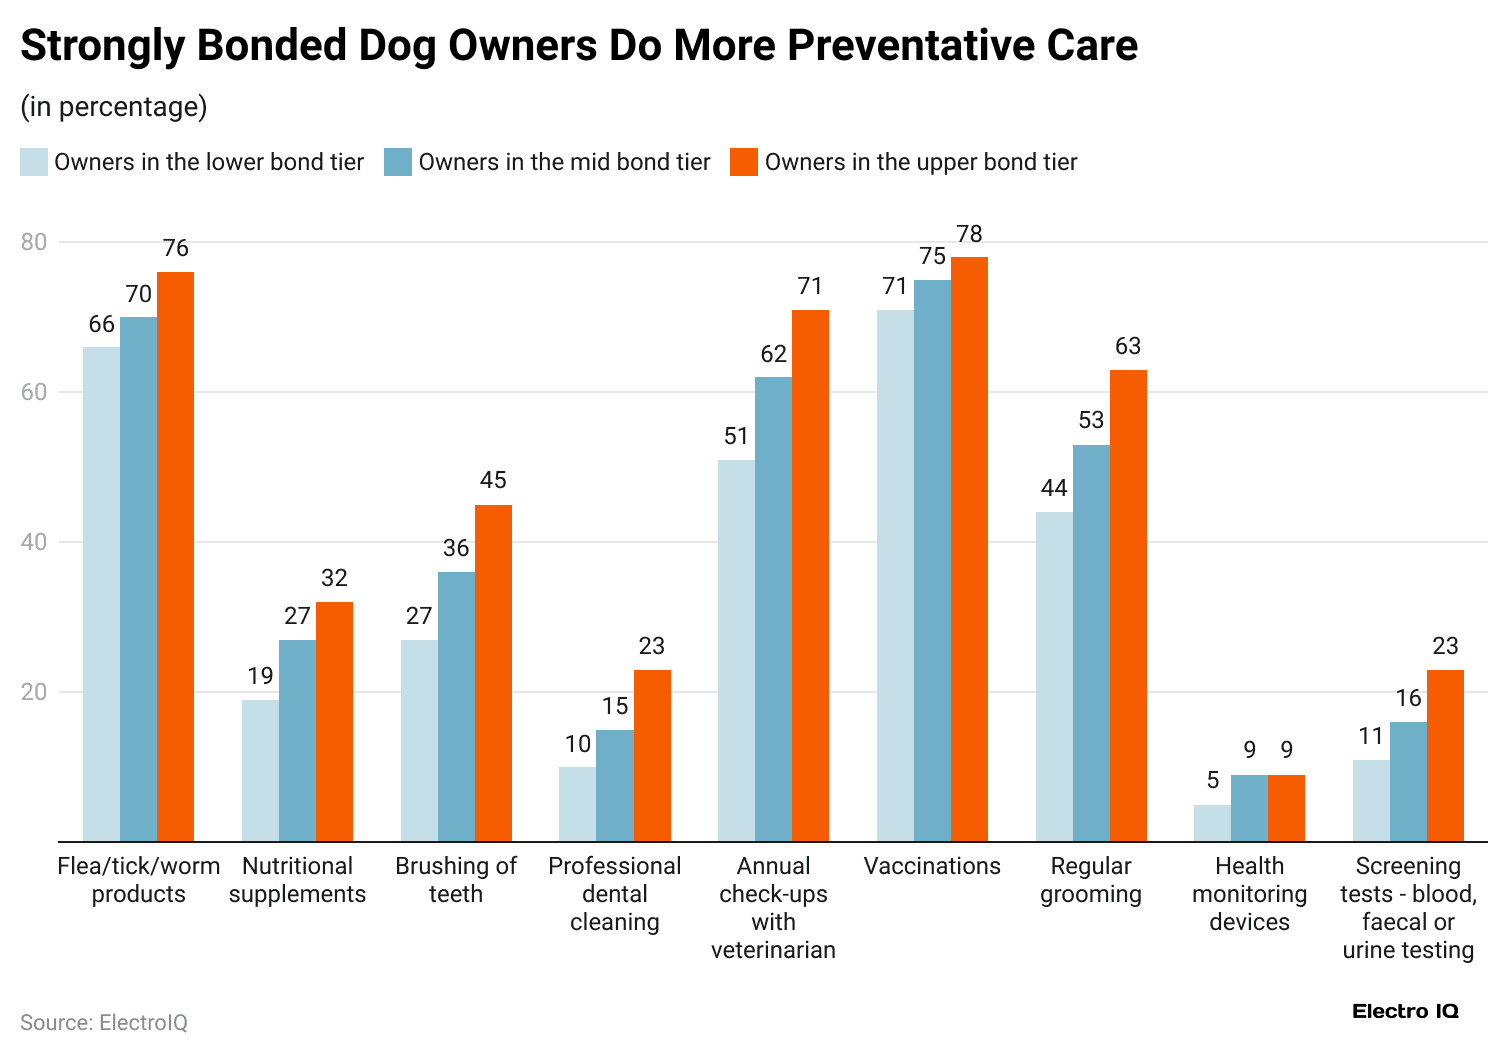
- In 2025, 97% of pet owners view their animals as part of the family, with Gen Z especially likely to see pets as actual children.
- Gen Z leads the trend, nearly half see pets as literal children, highlighting deep emotional investment in companion animals.
- 34% of Gen Z pet owners spoil their pets with birthday cakes, and 39% with gifts, reflecting strong emotional attachment and celebratory behaviour.
- 32% of Gen Z owners dress pets in outfits or costumes, signaling increased humanization and personalization of pet care.
- Pet-focused social media content drives product choices. Gen Z owners rely heavily on TikTok, YouTube, and Instagram for guidance on pet purchases and care.
- Regional cultural differences show states like Alaska and Wyoming have the most emotionally attached pets; Massachusetts owners most likely celebrate birthdays, and Maryland pet owners pamper with wardrobe photo shoots.
- The majority of younger couples opt for pets instead of children due to cost or time burdens: U.S. households with children dropped to 39% in 2024 while pet ownership rose to 71% in 2025.
- Many child-free and younger adults view pet ownership as part of their identity and life decisions, and pets replace traditional family roles in lifestyle planning.
- Emotional stress is reported when pets are sick: owners take loans, sell valuable or make lifestyle changes to save pets, reflecting how pets are prioritized like family members.
- Workplace pet-friendly policies are growing: 53% of remote or hybrid workers report seeing reduced stress and stronger coworker bonds from pet presence during work hours.
| Behavior / Insight | Stat / Insight |
| Pets are seen as family | 97% of owners |
| Gen Z sees pets as children | 50% of Gen Z |
| Birthday cake for pets (Gen Z) | 34% of Gen Z |
| Pet gifts monthly (Gen Z) | 39% of Gen Z |
| Dressing pets (Gen Z) | 32% of Gen Z |
| Pet product discovery via TikTok | Influences the majority of Gen Z purchases |
| Emotional attachment by region | Most attached: Alaska, MA, MD |
| Child-free prefer pets | Children’s households, pet households |
| Owners sell valuable items for vet care | Common practice |
| Workplace pet policies boost well-being | 53% report reduced stress at work |
State-by-State Pet Ownership Variation in 2025
 (Source: petradar.org)
- Idaho has the highest dog ownership rate at 58.3% of households, reflecting a strong canine culture in that state.
- Montana follows with dog ownership at 51.9%, also a high-adoption region for pets.
- West Virginia holds the third-highest dog ownership rate at 51.6%, showing regional clustering in pet adoption.
- Vermont leads cat ownership across states at 44.6%, reflecting strong feline preference in New England.
- States with the lowest pet ownership rates are the District of Columbia (38.2%), indicating urban owners more often lack pets.
- Other low-ownership states include Rhode Island (45.4%) and South Dakota (48.6%), illustrating regional variation.
- States like New Jersey and Maryland also rank below 50% pet ownership, around 48.6%, showing socio-economic influences on pet access.
- Massachusetts and Illinois also fall under 50%; Massachusetts (49.1%), New York (49.7%) Connecticut (49.9%).
- Georgia’s household pet ownership is approximately 51.1%, close to the national average but still lower than some rural states.
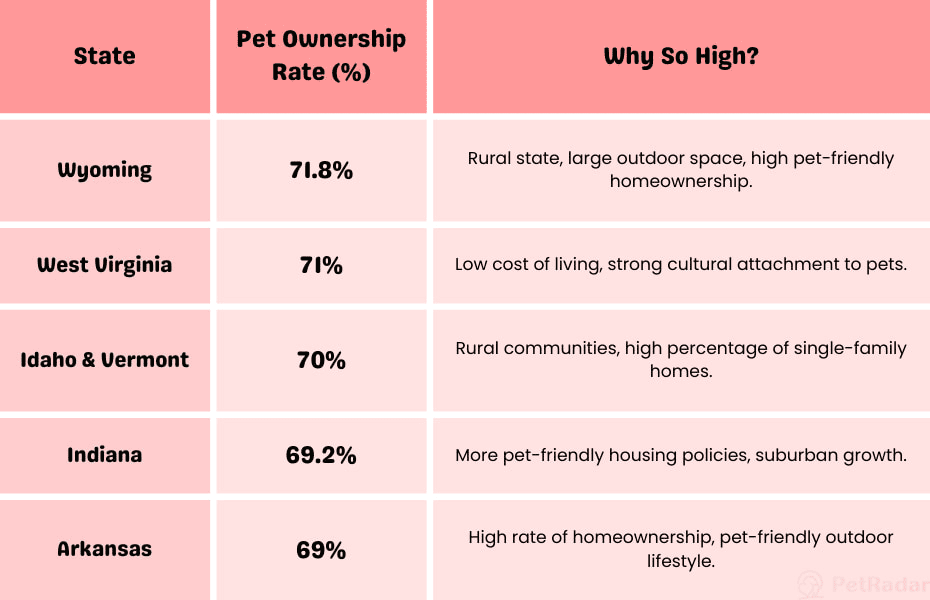
- These geographic patterns reflect how rural areas and smaller states often report higher pet ownership, while urban centers and high-cost states trend lower.
| State / Region | Pet Ownership Rate |
| Idaho (dogs) | 58.3% |
| Montana (dogs) | 51.9% |
| West Virginia (dogs) | 51.6% |
| Vermont (cats) | 44.6% |
| Distinct of Columbia | 38.2% |
| Rhode Island | 45.4% |
| South Dakota | 46.4% |
| New Jersey | 48.6% |
| Massachusetts | 49.1% |
| New York | 49.7% |
Global Pet Ownership Statistics 2025
 (Reference: petfoodindustry.com)
- The U.S. leads globally with about 69.9 million dogs and 74.1 million cats, the highest counts in the world according to World Population Review estimates.
- China ranks second in dog population (27.4 million) and third in total cat population, showing rapid market growth in Asia.
- Russia and the United Kingdom follow with approximately 17.6 million dogs in Russia and 12.7 million in the UK; the cat population is also high but trailing the U.S.
- Japan owns about 12 million dogs, marking it as one of Asia’s leading pet nations alongside China.
- Global totals estimate roughly 900 million pet dogs and 370 million pet cats worldwide by 2024 to 2025, illustrating the sheer scale of companion animals globally.
- Freshwater fish are the third most popular pet globally, though the exact households varies, mirroring the US. Trends in fish interest.
- In many countries, dogs predominate in pet percentages, but cats lead in numbers in places like France, Italy, and Germany, per reporting data.
- Brazil is also a major pet market, ranking high globally, though not matching U.S. numbers. The Brazilian dog population is estimated to be around 35 million and growing fast.
- Global pet ownership trends mirror U.S. humanization, premium food, and tech integration growth, particularly in developed markets.
- The worldwide pet-care market size was valued at $246,66 billion in 2023 and projected to hit $368.88 billion by 2030, showing strong global market growth.
- 2030, showing strong global market growth.
| Country / Region | Stat / Detail |
| United States | 69.9M dogs, 74.1M cats |
| China | 27.4M dogs |
| Russia | 17.6M dogs |
| United Kingdom | 12.7M dogs |
| Japan | 12M dogs |
| Brazil | 35M dogs |
| Global dogs (2025) | 900M dogs |
| Global cats (2025) | 370M cats |
| Pet care market 2023 | $246.66B |
| Pet care market 2030 | $368.88B (projected) |
Pet Tech and Accessory Trends in 2025
- The pet tech market was valued at about $5 billion in 2022, and is forecast to grow by roughly 6 to 15% annually, aiming for $35 to $37 billion by 2030.
- Wearable pet tech (e.g., smart collars) is expected to generate $6.89 billion by 2030, up from $2.7 billion in 2023, driven by owner interest in health monitoring.
- Owners of unusual pets increasingly invest in specialty technologies like AI‑enabled feeders that monitor behavior, hydration, and diet trends.
- Regional spending habits show pet owners in states like Massachusetts and Maryland invest heavily in accessories such as wardrobes, costumes, and photoshoots.
- Millennials are the most frequent accessory buyers, with 51% buying gifts for their pets monthly or more often, reflecting emotional gifting behavior.
- The pet accessories market alone is expected to grow by $9.2 billion by 2025, covering toys, clothing, beds, and decorative items.
- Experts caution that some accessories, like bubble backpacks or over‑clothing, may stress pets, functionality must come before trendiness.
- Premium pet food consumption is strong: 61% of U.S. pet owners prioritize nutritious or premium diets for their pets.
- The trend toward organic or specialized diets is growing; the market for organic pet food alone is valued at over $2.3 billion in recent years.
- Online buying is widespread: nearly 40% of pet owners purchase food and treats online, with e‑commerce channels like Chewy leading the market.
| Trend / Product | Data / Insight |
| Pet tech market value (2022) | $5B (2022) |
| Wearable pet tech 2030 | $6.89B (2030) |
| AI feeders | Used for diet and behavior monitoring |
| State spending on accessories | Massachusetts, Maryland leading |
| Millennial gift frequency | 51% gift monthly |
| Accessory market 2025 | $9.2B |
| Stress from novelty accessories | Some causes stress |
| Premium food prioritization | 61% of owners |
| Organic food market | $2.3B |
| Online pet food shopping | 40% buy online |
Conclusion
So, what do all these pet ownership statistics tell us? In 2025, pets will have become an inseparable part of our lives. From record-breaking ownership numbers to the billions we spend on food, care, and tech, it’s clear we’re more connected to our pets than ever before.
Whether you’re a Gen Z first-time dog owner or a long-time cat lover, the bond is strong, and the trends show no signs of slowing down. The future of pet ownership is more thoughtful, more tech-driven, and more human. And honestly, it’s a great time to be a pet parent. Thanks for holding on to me til the end. What type of pet do you own?
Sources
FAQ.
As of 2025, around 94 million U.S. households have at least one pet. That’s about 71% of all American homes. This number has steadily increased post-pandemic, reflecting the growing emotional value people place on pets as part of the family. It’s not just dogs and cats either, reptiles, birds, and even backyard chickens are seeing a rise in popularity.
Dogs remain the most popular pet in the U.S., with an estimated 89.7 million currently owned. Cats follow closely behind at 73.8 million. Other rising categories include freshwater fish, reptiles, birds, and small mammals like rabbits and hamsters. On average, pet owners tend to have 1.5 dogs or 1.8 cats per household.
Millennials (ages 27 to 43) lead pet ownership, making up about 30% of all pet-owning households. Gen Z (ages 18 to 26) is the fastest-growing segment, now accounting for 20% of all pet owners, with many adopting multiple pets. Interestingly, Gen Z treats their pets like their own children, throwing birthday parties, buying outfits, and spending on premium food.
In 2025, Americans are projected to spend around $157 billion on pets. This includes expenses on food and treats (44%), vet care (25.8%), accessories, pet insurance, and grooming services. The average dog owner may spend anywhere from $1,390 to $5,295 per year, depending on breed and medical needs. Even emergency vet visits can cost upwards of $5,000.
A growing number of people are turning to shelters and rescues. In 2025, 31% of cat owners and 23% of dog owners reported adopting from shelters. Breeder purchases still remain high, about 34% of dogs and 3% of cats come from breeders. But there’s a visible shift toward adoption, especially after the pandemic-era surge in fostering and pet rescue awareness.
Yes, pet insurance is gaining traction. About 24% of pet owners in 2025 have pet insurance. It’s growing at a 20% annual rate, especially among millennials and Gen Z. While not everyone opts for it, insurance can help manage large unexpected bills like surgery or chronic illness, which might otherwise run into the thousands.
Pet ownership varies significantly by state. Idaho has the highest dog ownership rate at 58.3%, while Montana and West Virginia follow closely. On the other hand, states like Rhode Island and the District of Columbia have the lowest ownership rates, often due to high-density urban living and restrictive housing policies that limit pet-friendly spaces.
Globally, the numbers are massive. In 2025, there are around 900 million dogs and 370 million cats worldwide. The U.S. leads with 69.9 million dogs and 74.1 million cats. China, Brazil, and the UK are also major pet-owning nations. The global pet care market is valued at $246.6 billion (2023) and is expected to hit $368.88 billion by 2030.
Tech has completely reshaped how we care for pets. From AI-powered feeders and smart water dispensers to wearable health monitors, pet tech is making it easier to track health, activity, diet, and safety. The pet tech market, worth $5 billion in 2022, is projected to reach $6.89 billion by 2030. Many pet parents now rely on mobile apps for vet bookings, food deliveries, and behavior tracking.
There’s a strong emotional shift happening. Around 97% of pet owners consider their pets as full-fledged family members. For younger generations, especially Gen Z, pets often take the place of children, partly due to changing lifestyles, economic pressures, and evolving social values. Many celebrate their pets’ birthdays, buy holiday gifts, and even include them in travel and daily routines.

Barry Elad is a passionate technology and finance journalist who loves diving deep into various technology and finance topics. He gathers important statistics and facts to help others understand the tech and finance world better. With a keen interest in software, Barry writes about its benefits and how it can improve our daily lives. In his spare time, he enjoys experimenting with healthy recipes, practicing yoga, meditating, or taking nature walks with his child. Barry’s goal is to make complex tech and finance information easy and accessible for everyone.