Buy Now Pay Later Statistics By Market Size, Users and Facts (2025)
Updated · Sep 10, 2025

Table of Contents
- Introduction
- Editor’s Choice
- General Buy Now Pay Later Statistics
- Buy Now Pay Later Market Statistics
- Geographic Analysis of Buy Now Pay Later Market Statistics
- Buy Now Pay Later Statistics by Mode
- By Verticle
- Buy Now, Pay Later (BNPL) Market Share in Domestic E-Commerce by Country/Region (As of mid-2025)
- BNPL Users Demographics Statistics
- Consumer Usage of Buy Now, Pay Later (BNPL) Services
- Buy Now Pay Later User Statistics
- BNPL Users Shares Who’ve Paid Late on a BNPL Loan, 2025
- Buy Now Pay Later Usage Statistics
- Buy Now Pay Later Statistics by Popular Purchases
- By Lender
- Reasons for Consumers to Prefer Buy Now Pay Later Statistics
- Conclusion
Introduction
Buy Now Pay Later Statistics: Have you ever liked something but held back from buying it because you didn’t have enough money to pay for it all at once? This payment process is termed Buy Now Pay Later, which allows customers to buy products or services by paying a lump sum amount at the time of purchase. The remaining payment is to be paid later, either in single or multiple instalments, depending on the platform’s guidelines.
In recent years, this has become a convenient and flexible method that has become very popular, especially among young buyers who want easy and affordable ways to pay. In recent years, both online and offline retailers have adopted BNPL to attract more buyers and boost sales. The following statistics highlight how this payment trend is shaping consumer behavior and retail growth worldwide.
Editor’s Choice
- Market.us reports that the global market size of Buy Now Pay Later is expected to reach around USD 26 billion by the end of 2025.
- Meanwhile, adding BNPL services to regular credit cards could raise U.S. credit limits to around USD 1.28 trillion by 2025.
- Similarly, Bank of America Corp. predicts that the BNPL market may grow 10 to 15 times its current size.
- A 2025 survey by LendingTree found that almost 25% of American BNPL users used it for groceries, up from 14% in 2024.
- A report published by Precedence Research also shows that in 2024, the Asia Pacific region led the global market of Buy Now Pay Later, securing the largest share of 36.42%.
- In contrast, the buy now pay later market size in China reached USD 2,396.7 million.
- Moreover, almost 53% of BNPL users were aged 35 and under, compared with 35% for traditional credit card holders in 2024.
- Leading Tree report analysis further depicts that in August 2025, almost 62% of users who asked for a late fee waiver had it approved, and another 24% had the fee reduced.
- Meanwhile, only 23% of BNPL users said they had three or more active loans at the same time.
- Gen Z and millennials are two times as likely as baby boomers to have multiple loans, while 40% never do.
- Use of BNPL is expanding beyond shopping, with 25% now using it to buy groceries, up from 14% last year.
General Buy Now Pay Later Statistics
- Wikipedia report analysis shows that in 2024, Buy Now Pay Later (BNPL) purchases in the United States reached nearly USD 46 billion, making up about one-third of the total American credit card debt.
- As of 2025, nearly 50% of respondents had used BNPL at least once, over one-third more than once, showing a 33% annual rise.
- Looking at purchase sizes, over 40% of purchases by financially stable borrowers in 2024 were under USD 250, while loans between USD 1750 and USD 2000 made up around 18% of total purchases.
- Among financially fragile households, almost 60% used BNPL more than five times in the past year.
- More than two-thirds of financially stable BNPL users used it twice, but less than 25% used it more often.
- BNPL users often face financial trouble, being 12% likely to file bankruptcy, 43% lien holders, and 118% landlord disputes.
- In 2024, 53% of BNPL users were aged 35 and under, compared with 35% for traditional credit card holders.
- Among Americans aged 18 to 24 years, BNPL debt accounted for 28% of unsecured credit, compared to 17% for other age groups.
- Nearly 60% of Coachella attendees used BNPL to pay for tickets.
- Lendingtree.com shows that more people are using Buy Now Pay Later (BNPL) in 2024, around 41% admitted they paid late, up from 34% the previous year.
- Around 76% of these late payments were only a few days overdue.
- DoorDash partnered with Klarna to let customers pay with BNPL for deliveries in 2025, and 16% have used it for restaurant takeout.
- Many see BNPL as a short-term financial tool, in which 33% use it to cover expenses until their next paycheck, rising from 30% last year and 27% the year before.
- More than 60% mistakenly believe paying BNPL on time boosts their credit score, while only 13% know it does not, and 26% are unsure.
Buy Now Pay Later Market Statistics
 (Source: shortpixel.ai)
- The above graph shows that the global market size of Buy Now Pay Later is expected to reach around USD 26 billion by the end of 2025, up from USD 19 billion in 2024, growing at a CAGR of 25.3% during the forecast period from 2023 to 2032.
- Furthermore, the market valuation in the coming years is going to reach USD 33 billion by 2026, followed by USD 40 billion (2027), USD 46 billion (2028), USD 58 billion (2029), USD 71 billion by 2030, USD 89 billion (2031), and USD 115 billion (2032).
- A report published by Precedence Research also shows that in 2024, the Asia Pacific region led the global market of Buy Now Pay Later (BNPL), holding the largest share of 36.42%.
- North America is projected to grow the fastest, with a growth rate of 15.11% CAGR from 2025 to 2034.
- Looking at components, the platform or solution segment accounted for the highest revenue share of 67% in 2024.
- When analysing purchase ticket size, small-ticket items up to USD 300 captured the largest market portion at 42.98%, while mid-ticket items ranging from USD 300 to USD 1000 are expected to grow at a significant CAGR of 15.84%.
- Business-driven services contributed the major revenue share of 70.99%, whereas customer-driven models are predicted to expand at a solid CAGR of 15.49%.
- In 2024, online transactions made up the largest usage share of BNPL at 55.88%.
- Looking at different sectors, electronics brought in the highest revenue at 35.94%, while the fashion segment will grow at a CAGR of 15.53%.
Geographic Analysis of Buy Now Pay Later Market Statistics
 (Reference: precedenceresearch.com)
- The above pie chart shows that in 2024, the Buy Now Pay Later market in the Asia Pacific region held the largest share of 36%.
- In contrast, the buy now pay later market in China reached USD 2,396.7 million, while Japan recorded USD 1,507.0 million. South Korea’s market was around USD 918.6 million, and India exhibited USD 1,097.2 million.
- Europe followed with a 29% market share, while North America accounted for 24%.
- As of 2024, the U.S. led with USD 4,095.6 million, followed by Canada at USD 1,038.4 million,
- Latin America contributed 8% to the market, and the Middle East and African region made up the smallest share of 3%.
Buy Now Pay Later Statistics by Mode
- The precedenceresearch.com report analysis stated that in 2024, the online segment held the dominating share of 55.65% in the buy now pay later market.
- In the same duration, the buy now pay later market was valued at USD 4,237.9 million for online transactions.
- Besides, offline transactions accounted for USD 3,345.9 million.
By Verticle
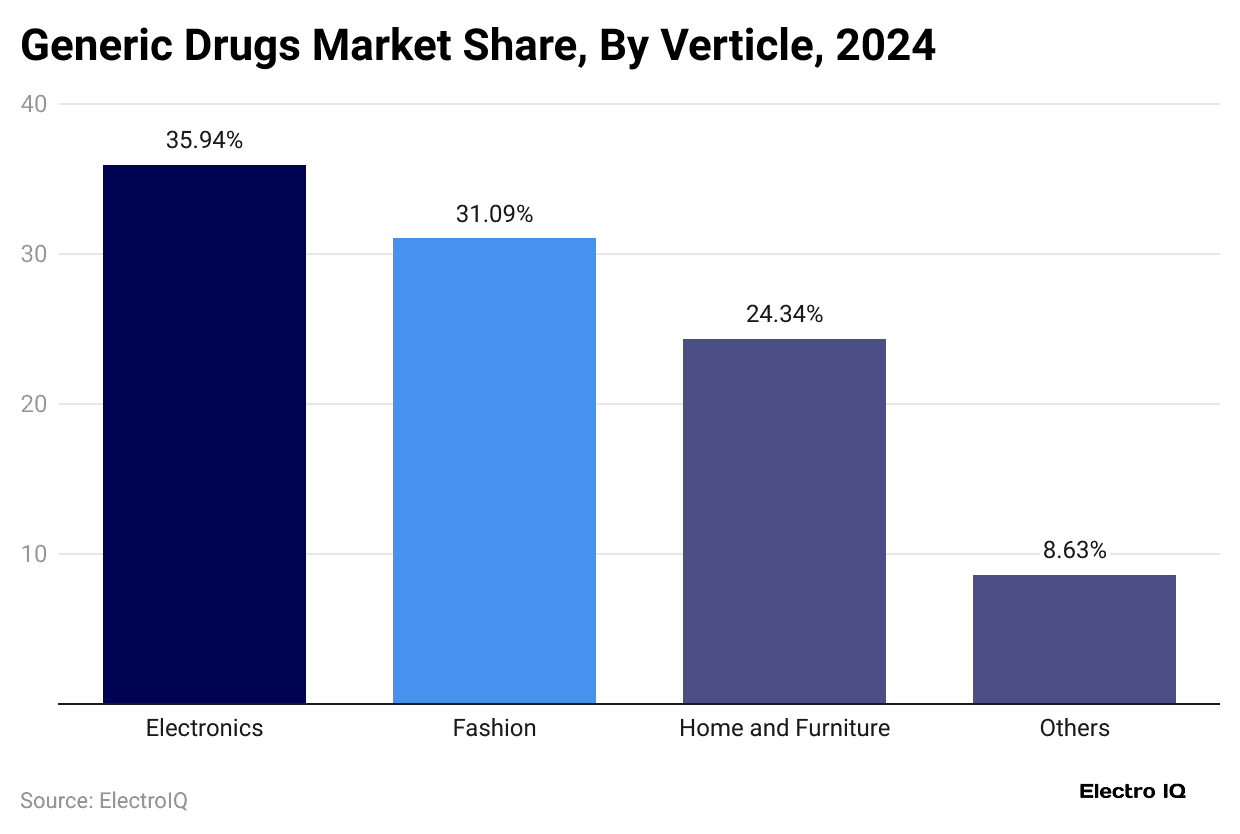
- In 2024, the electronics sector led the generic drugs market, making up 35.94% with a value of USD 6,908.2 million.
- Fashion came next with a 31.09% share, worth USD 5,975.8 million. The home and furniture category held 24.34% of the market, totalling USD 4,679.1 million.
- The home and furniture segment accounted for 24.34% (USD 4679.1 million).
- Meanwhile, other categories, including travel, fitness gear, and sports and outdoor products, contributed 8.63% to the overall market with a market valuation of USD 1658.9 million.
| Country | BNPL Market Share |
| Sweden |
23% |
|
Germany |
19% |
| Norway |
15% |
|
Finland |
12% |
| Australia |
10%
|
|
New Zealand |
|
| Denmark |
9% |
|
Netherlands |
85 |
| United Kingdom |
7% |
|
Canada |
6% |
| United States |
5% |
|
France |
4% |
| Italy |
3% |
|
Spain |
- On the other side, Poland, Belgium, Austria, Switzerland, Ireland, and Portugal each account for 2%.
- While Greece, the Czech Republic, Slovakia, Hungary, Romania, Bulgaria, Croatia, Serbia, Slovenia, Estonia, Latvia, Lithuania, Ukraine, and Russia each have a 1% share.
- Similarly, in Central Asia and the Middle East, Kazakhstan, Uzbekistan, Georgia, Armenia, Turkey, Israel, the United Arab Emirates, Saudi Arabia, and Egypt each hold 1%, and in Africa, South Africa also accounts for 1% of the BNPL market.
BNPL Users Demographics Statistics
 (Reference: nimbleappgenie.com)
- As of May 2025, the Buy Now Pay Later users’ demographics show that Gen Z makes up the largest share at 47.4%, followed by Millennials at 40.6%.
- Besides, Gen X accounts for 30.9% of users, while Baby Boomers represent the smallest portion at 14%.
- In terms of growth rates, Gen X is increasing the fastest at 13.7%, closely followed by Gen Z at 10.6% and Millennials at 10.3%.
- Baby Boomers are growing more slowly, with a rate of 8.6%.
Consumer Usage of Buy Now, Pay Later (BNPL) Services
 (Reference: lendingtree.com)
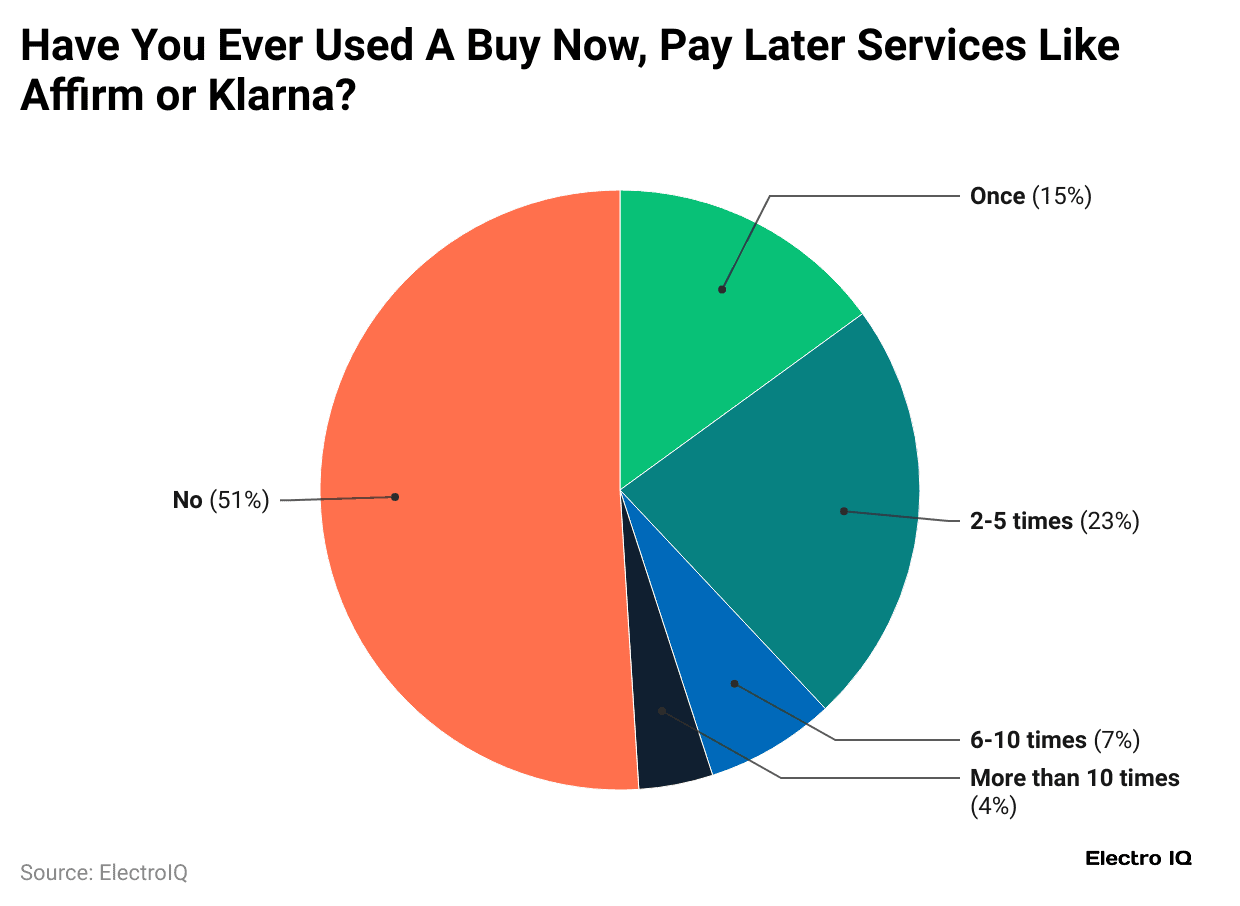
- A survey conducted on 2,000 consumers in April 2025 shows that 51% have never used a Buy Now, Pay Later (BNPL) service like Affirm or Klarna.
- Among those who have, 23% reported using it 2 to 5 times, 15% used it once, 7% used it 6 to 10 times, and 4% have used it more than 10 times.
- As of 2025, men are slightly more likely than women to have used a Buy Now Pay Later (BNPL) loan, at 53% versus 46%.
- Based on ages, almost 64% of Gen Zers (ages 18 to 28) have used a BNPL loan, including 16% who’ve used them six or more times, while only 29% of baby boomers (ages 61 to 79) report using one.
- Millennials (ages 29 to 44) are the most likely to consider applying for a BNPL loan this month at 50%, followed by Gen Z at 47% and Gen X at 41%.
- Baby boomers are the least likely at 24%.
Buy Now Pay Later User Statistics
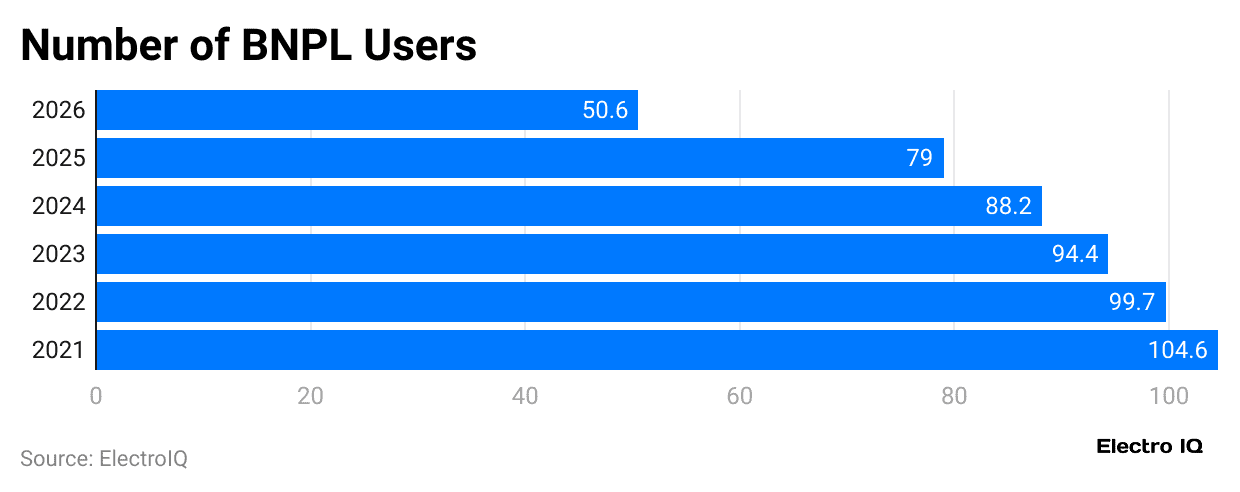
- The above graphical analysis states that in 2021, the U.S. had 50.6 million BNPL users, more than doubling from the previous year.
- By 2022, the number grew to 79 million, and in 2023 it reached 88.2 million.
- BNPL adoption is expected to rise steadily, reaching 94.4 million in 2024, 99.7 million in 2025, and 104.6 million by 2026.
| Metrics | Yes, in the past year | Yes, but not in the past year | No |
| Overall | 41% | 13% | 46% |
| Gender | |||
| Men | 46% | 14% | 40% |
| Women | 35% | 13% | 52% |
| Generation | |||
| Gen Zers | 57% | 15% | 28% |
| Millennials | 49% | 17% | 34% |
| Gen Xers | 32% | 11% | 57% |
| Baby boomers | 11% | 5% | 84% |
| Parental Status | |||
| Parents with children younger than 18 | 55% | 13% | 33% |
| Parents with children older than 18 | 22% | 12% | 67% |
| Adults without children | 33% | 15% | 52% |
| Household Income | |||
| Less than USD 30,000 | 39% | 14% | 47% |
| USD 30,000 to 49,999 | 33% | 19% | 48% |
| USD 50,000 to 99,999 | 42% | 12% | 46% |
| USD 100,000 or more | 46% | 11% | 43% |
Buy Now Pay Later Usage Statistics
 (Reference: market.biz)
- Around one-third of BNPL users use the service every month, while 19% make monthly transactions and 8% engage weekly.
- In contrast, only 2% use it more than once per week.
- About 22% use BNPL every three months, and 29% make purchases at least once every six months.
- Meanwhile, 20% of users rely on BNPL just once a year or less.
Buy Now Pay Later Statistics by Popular Purchases
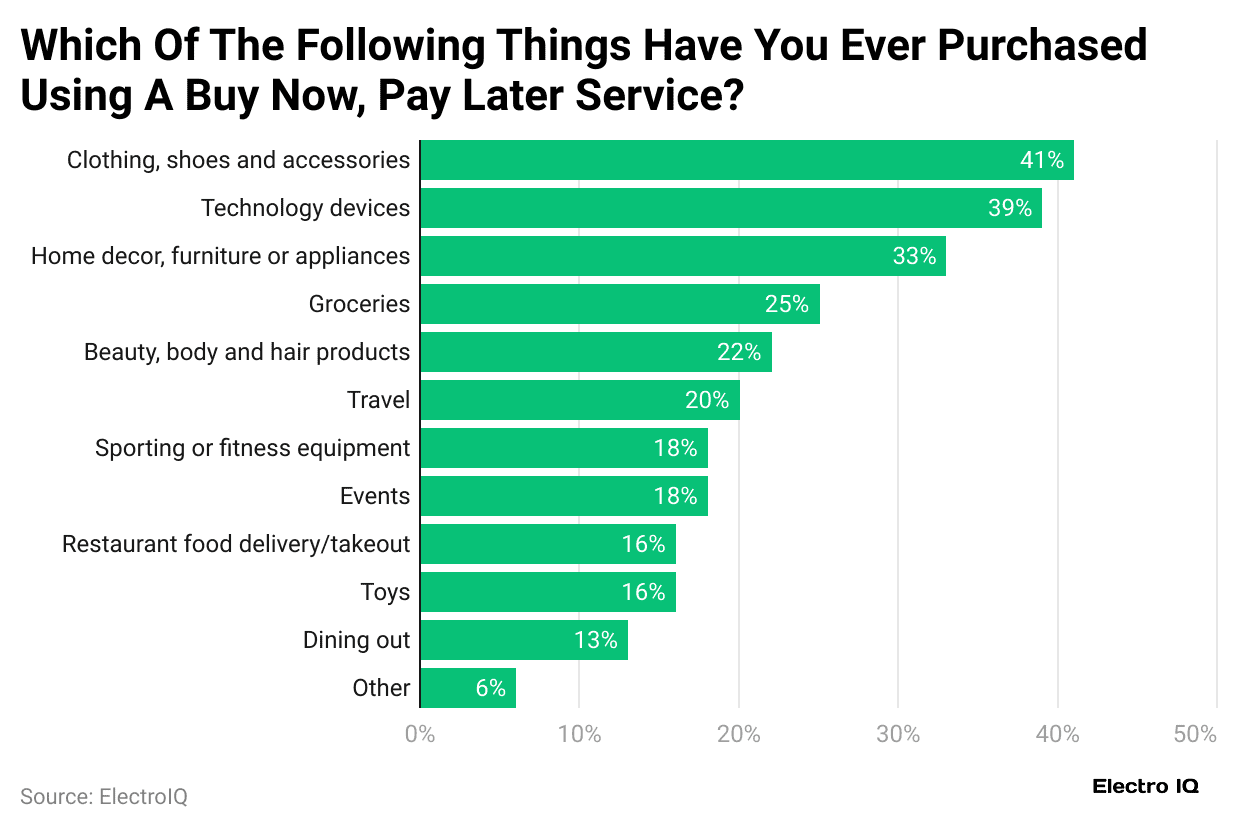 (Reference: lendingtree.com)
- In Q1 2025, almost 41% purchased items like clothing, shoes, and accessories, followed closely by technology devices such as laptops and gaming systems (39%).
- Home decor, furniture, or appliances come next at 33%, while groceries account for 25% of purchases.
- Beauty, body, and hair products were bought by 22% of users, and travel-related expenses like flights or hotels by 20%.
- Sporting or fitness equipment and event tickets each represent 18%, restaurant food delivery and toys both 16%, dining out 13%, and other purchases 6%.
By Lender
- In the lendingtree.com survey, PayPal was the top choice for buy now, pay later (BNPL) users, with 56% saying they use it.
- Klarna, Affirm, and Afterpay were also popular, each being used by 38% of BNPL users.
- Furthermore, others are followed by Zip (15%), Sezzle (11%), Splitit (6%), and Others (6%).
Reasons for Consumers to Prefer Buy Now Pay Later Statistics
- The market.biz report states that many users choose buy now, pay later (BNPL) for its convenience and flexibility.
- About 45% find it simplifies payments, while 44% value the added flexibility.
- Lower interest rates attract 36%, and 33% use it when credit cards are maxed out, and for easy approval.
- Around 22% prefer BNPL for low credit limits and interest-free payments.
Conclusion
To sum up, buy now, pay later (BNPL) is gaining huge popularity along with increased use globally, which gives people an easier way to pay, more flexibility, and reduced financial pressure. Many users appreciate quick approvals, interest-free plans, and support for those with limited credit. Its rising popularity comes from the ability to handle bigger purchases without immediate full payment. Nevertheless, even with its advantages, some people are concerned about the financial risks and see BNPL as a potentially risky choice. Despite this, BNPL continues to grow as a significant method for managing purchases in modern shopping.
FAQ.
BNPL lets you buy products immediately and pay in smaller instalments over time, often with no interest if paid on schedule.
Many BNPL plans are interest-free if payments are made on time, but late fees may apply.
Anyone with a valid credit or debit account can usually access BNPL with quick approvals.
People prefer BNPL due to its convenience, flexible payment processes, easy approvals, interest-free options, and ability to manage large purchases.
Missing payments, hidden fees, and potential impact on credit scores are the main risks.

Maitrayee Dey has a background in Electrical Engineering and has worked in various technical roles before transitioning to writing. Specializing in technology and Artificial Intelligence, she has served as an Academic Research Analyst and Freelance Writer, particularly focusing on education and healthcare in Australia. Maitrayee's lifelong passions for writing and painting led her to pursue a full-time writing career. She is also the creator of a cooking YouTube channel, where she shares her culinary adventures. At Smartphone Thoughts, Maitrayee brings her expertise in technology to provide in-depth smartphone reviews and app-related statistics, making complex topics easy to understand for all readers.


