Brother Statistics By Revenue, Region And Employees
Updated · Feb 04, 2025

Table of Contents
- Introduction
- Editor’s Choice
- Brother Industries Revenue
- Brother Total Sales Revenue
- Brother Sales Growth
- Brother Sales Revenue By Region
- Brother Sales Revenue By Business Segment
- Brother Workforce By Region
- Brother Number Of Employees
- Brother Business Segment Profit
- Brother Business Segment Profit Ratio
- Brother Number Of Males And Females Employees
- Brother Net Income Growth
- Brother Industry Resource Consumption And Product Raw Materials
- Brother Industry R&D Expenses
- Conclusion
Introduction
Brother Statistics: Brother Industries, Ltd., located in Nagoya, Japan, is a reputed manufacturer involved in communications and printing equipment. Its various activities extend to Printing & Solutions, Machinery, Domino, Nissei, Personal & Home, and Network & Contents.
Brother Statistics posted financial results for the fiscal year 2024, with highlights such as revenue, net income, profit margins, and sales.
Editor’s Choice
- According to Brother statistics, In 2024, moderate revenue growth was recorded at 0.94%, which stood at 822.93 billion yen, down from a high of 14.68% in 2023 and 12.52% in 2022.
- The pace of sales growth was sluggish in 2024 due to several impediments in comparison to previous years. By region, the greatest contribution came from the Americas, at 34.4%, while Europe came next at 27.7%, whereas Japan contributed only 14.2%.
- The biggest share segment is the Printing and Solutions Business (62.6% revenue), with the Domino Business following at 13.3%.
- Under employee distribution, the largest portion (63.9%) is assigned to Asia and other regions, while Japan accounts for 23.3%.
- Brother statistics reveal that the number of employees at Brother has been gradually trending upward over the years, with a peak of 41,653 in 2023 before declining slightly to 40,538 in 2024.
- Female employees saw an increase from 774 in 2019 to 806 in 2023, still representing a small fraction of the general staff (about 20%).
- Brother statistics show that Brother expects a 19.03 percent increase in net income in 2024 after having a tough year in 2023 with a 35.96 percent drop.
- The company continued robust growth of 148.89 percent in 2022, while revenue was down again in 2021 and 2020.
Brother Industries Revenue
 (Reference: stockanalysis.com)
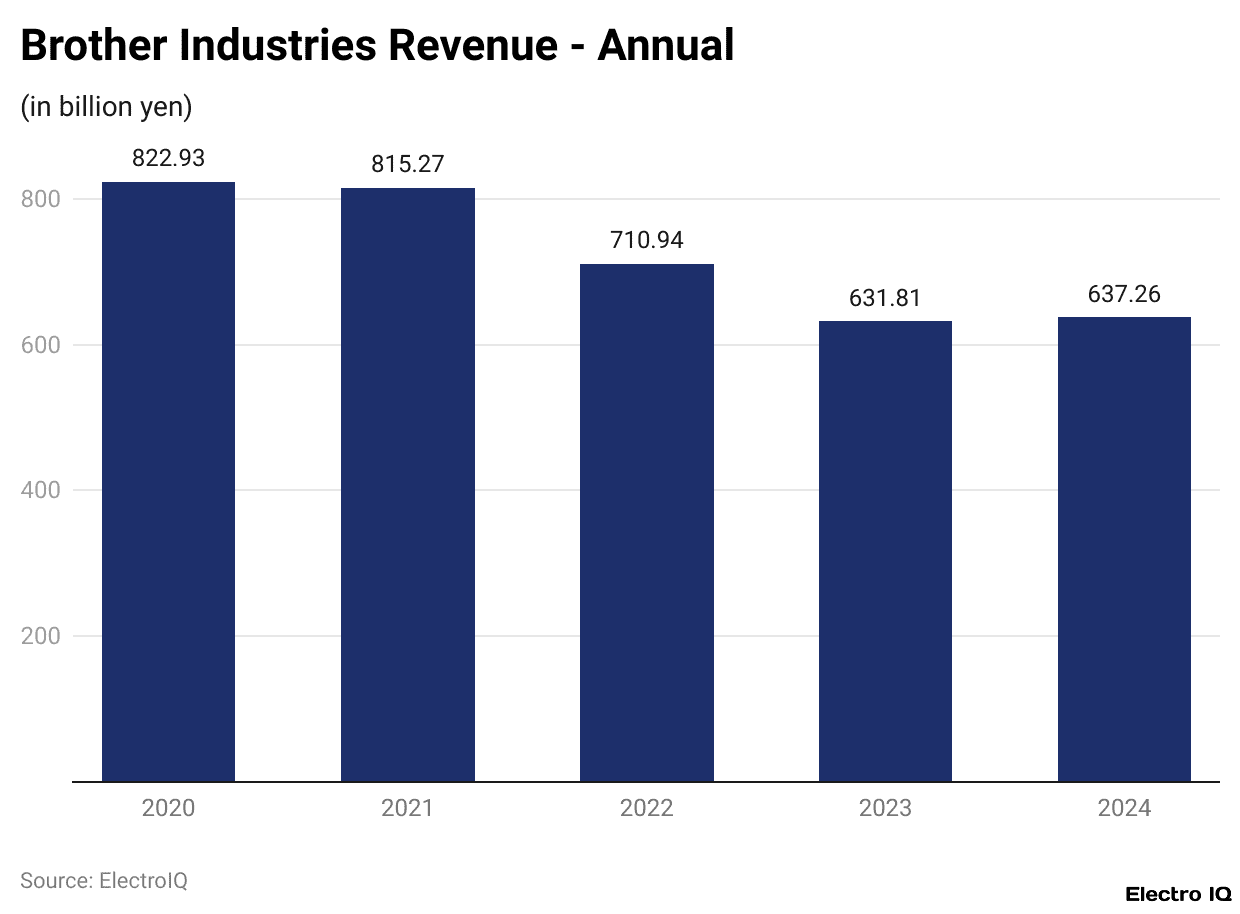
- In general, Brother Industries’ revenues show an increasing trend during the last five fiscal years.
- Brother statistics state that in the latest fiscal year ended March 31, 2024, Brother’s revenue amounted to 822.93 billion yen, up slightly by 7.66 billion yen or 0.94% from the prior year.
- There was a huge spike in revenue for the year ended March 31, 2023, which increased to 815.27 billion yen, a 14.68% increase (104.33 billion yen) from 2022.
- That followed another very good year in 2022 when revenue reached 710.94 billion yen and grew 12.52% (79.13 billion yen) from 2021.
- There were revenue decreases in 2021 and 2020. Revenues in 2021 fell slightly to 631.81 billion yen; this translated to a drop of 0.85% (5.45 billion yen) compared to the prior year.
- The largest decline came in 2020 when revenues fell to 637.26 billion yen, a 6.83% drop (46.71 billion yen) from 2019.
- The evidence suggests that the company recovered strongly from the pandemic-induced decline, enjoying steady growth in 2022 and 2023 before the growth sharply slowed down in 2024.
Brother Total Sales Revenue
 (Reference: download.brother.com)
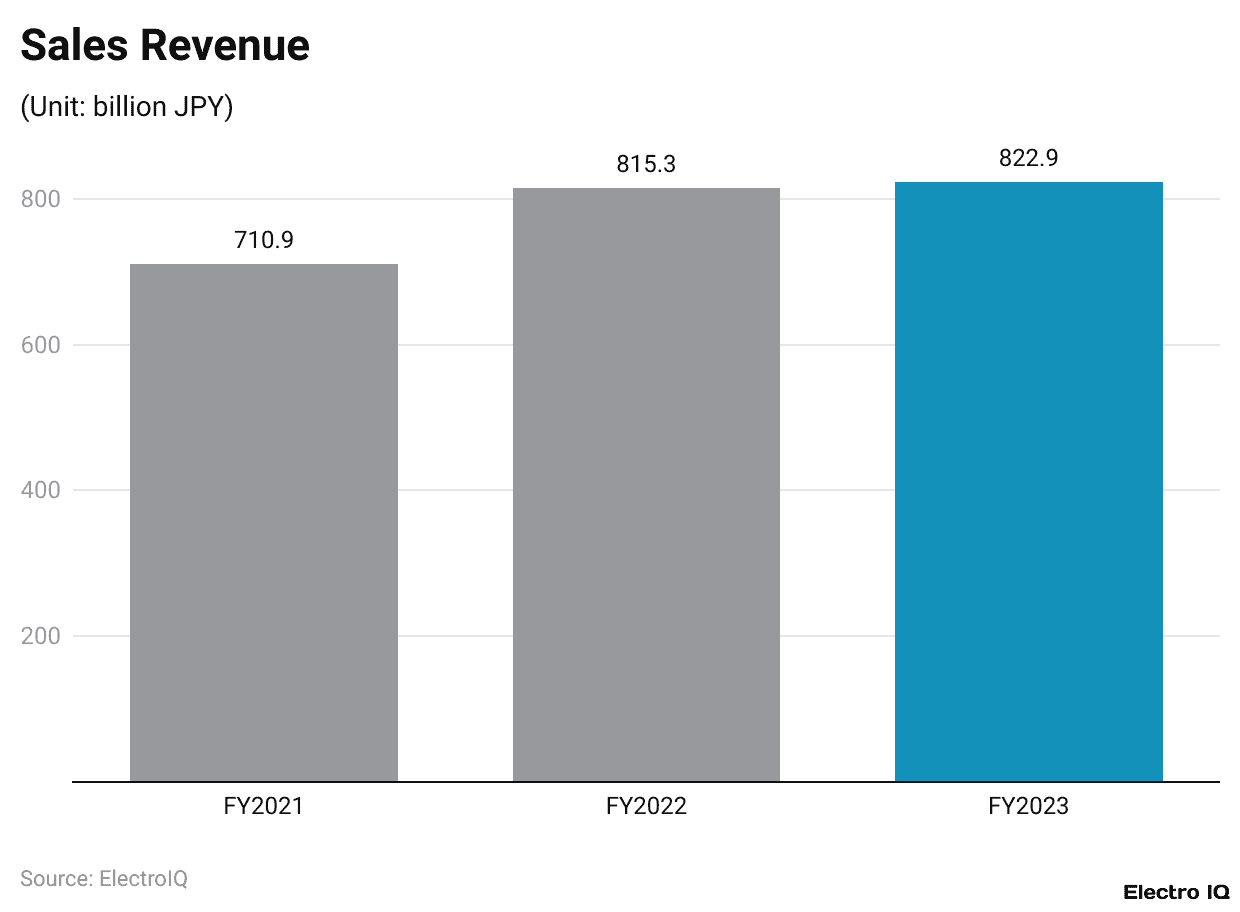
- For Brother, steady growth has been reported in the last three fiscal years in sales revenue. In FY2021, Brother’s revenue amounted to 710.9 billion JPY.
- Brother statistics indicate that due to a very strong business performance in this period and demand for its products, this number increased in FY2022 considerably, reaching 815.3 billion JPY.
- Following this, the upward trend continued but with decreased momentum in FY2023 as revenues attained 822.9 billion JPY.
- This indicates a stable market position with consistent growth, albeit at a slower pace than the previous year’s jump.
Brother Sales Growth
 (Reference: globaldata.com)
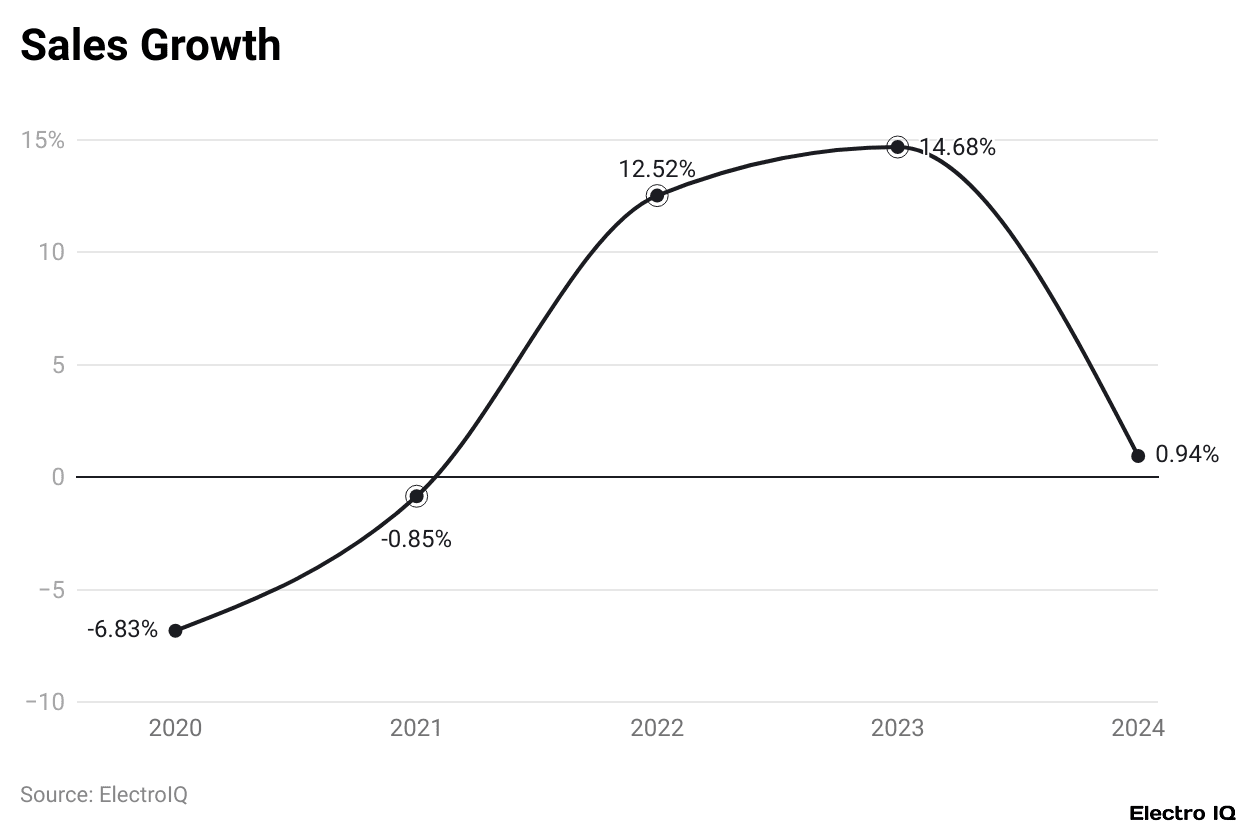
- Brother statistics reveal that Brother’s growth in sales has fluctuated in the past five years. 2020 marked a negative 6.83% in terms of sales, likely due to the impact of the global pandemic.
- The difficulties persisted in 2021 when sales recorded a minimal negative growth of 0.85%.
- Recovery came in the next year, 2022, which marked strong growth of 12.5%, while 2023 witnessed an even stronger upsurge at 14.68%, suggesting a period of recovery and expansion.
- Unfortunately, 2024 came with massive challenges for expansion as growth declined to 0.94%, meaning the company still retained the momentum but faced constraints to expansion, unlike the previous two years.
Brother Sales Revenue By Region
 (Reference: download.brother.com)
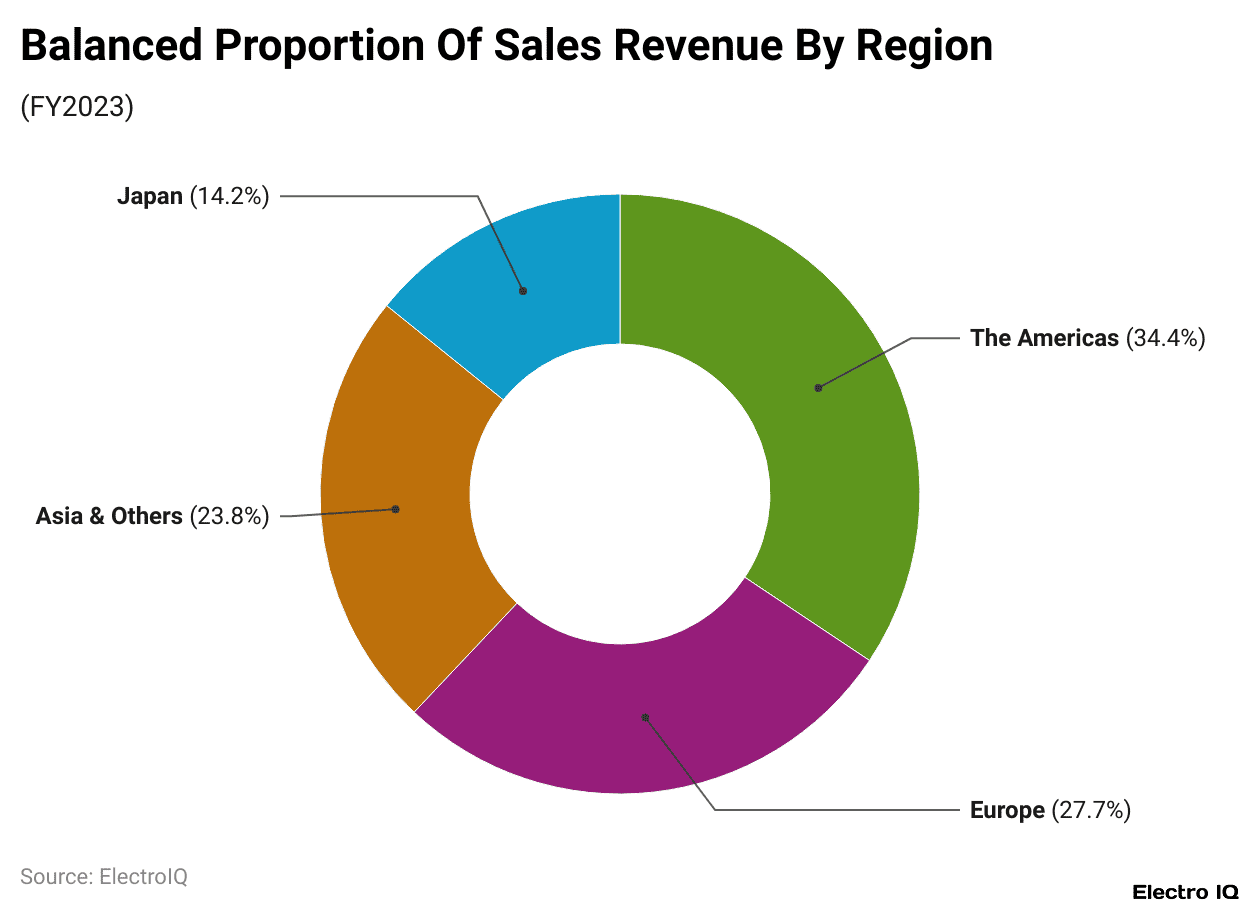
- Brother’s sales for fiscal year 2023 were spread over various world regions, denoting the company’s market penetration and performances across different territories.
- Brother statistics reveal that Japan accounted for 14.2% of total sales, indicating that the company has a strong presence in the domestic sector, although its major revenue comes from abroad.
- The Americas contributed the largest share, with 34.4%, suggesting that North and South America remain significant markets for Brother’s products. This presumed dominance can be attributed to the region’s established demand for printing solutions, office automation, and industrial equipment, which is intensified by the solid distribution network in place.
- Asia and Others accounted for 23.8% of total sales, indicating the growing importance of emerging markets in Asia and beyond. The region has shown persistent growth in sales owing to factors like increasing industrialization, digital transformation, and a surge in demand for office and consumer electronics.
- Europe accounted for 27.7% of the company’s sales, thus emerging as the second-largest contributor next to the Americas.
- Remarkable demand for business and industrial solutions in the European market, along with Brother’s strong reputation for quality and innovation, carries great significance for sustaining this performance.
- Regulatory developments and sustainability values in Europe may affect product offerings and sales strategies in that region.
- Overall, the global sales distribution of Brother in FY2023 represents a well-balanced international presence, with both the Americas and Europe leading revenue generation, while Asia and Japan remain important markets contributing to the company’s overall growth and expansion.
Brother Sales Revenue By Business Segment
 (Reference: download.brother.com)
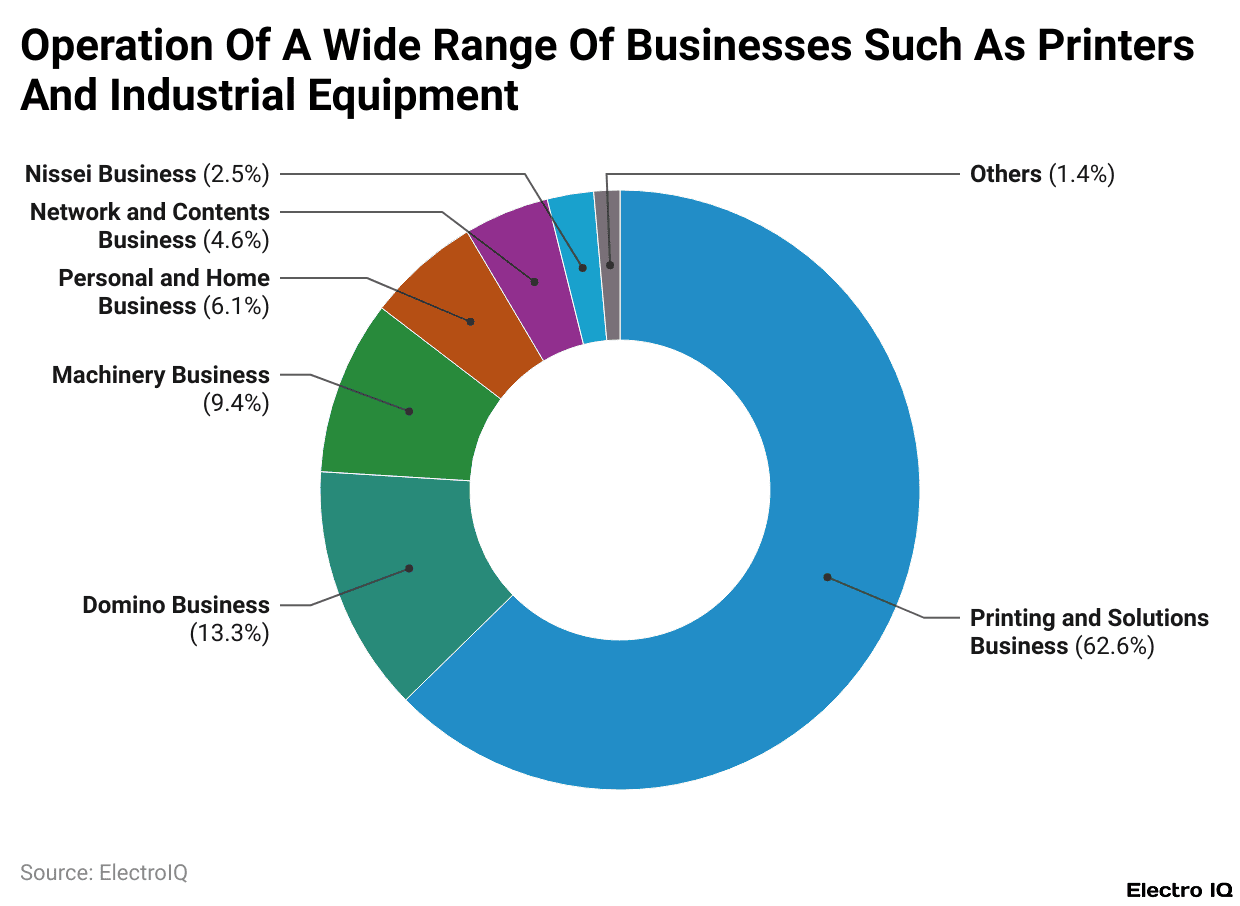
- Brother statistics state that Brother’s revenue in fiscal year 2023 was earned from many business segments, each of which contributes a different percentage to total revenue.
- The Printing and Solutions Business takes the lion’s share with 62.6% of total revenue. Thus, Brother’s core business still relies heavily on printers, multifunction devices, and other solutions, which are still the primary source of income for the company.
- The other big contributor is the Domino Business, which contains industrial printing solutions such as coding, marking, and digital inkjet printing, contributing 13.3% of total revenue.
- This segment is thus primarily involved in industrial applications, assisting businesses in high-quality printing for packaging, labeling, and product identification.
- The Machinery Business, encompassing Brother’s supplies of industrial sewing machines and machine tools, is 9.4% of revenue:
- This segment again supports various manufacturing industries, indicating a strong foothold in precision engineering and production equipment.
- The Personal and Home Business had 6.1% of total revenue. This segment embraces household sewing machines, labeling systems, and home-use printers marketed for individual and small business enterprises.
- Through the steadiness of such contributions, Brother still boasts a continuous presence in a consumer-oriented domain.
- The Network and Contents Business, accounting for 4.6% of revenue, covers solutions related to IT services, digital platforms, and content management. This segment illustrates Brother’s movement away from hardware and entry into software-centric solutions.
- The Nissei Business, accounting for just 2.5% of revenue and one of the smallest segments, also deserves mention. This division is mainly focused on medical and healthcare-related equipment, showcasing Brother’s diversification into specialized fields.
- The remaining 1.4% of revenue fell into the classification of Others, representing small activities that do not fall into the principal segments. This may include emerging markets, experimental technologies, or side businesses.
Brother Workforce By Region
 (Reference: download.brother.com)
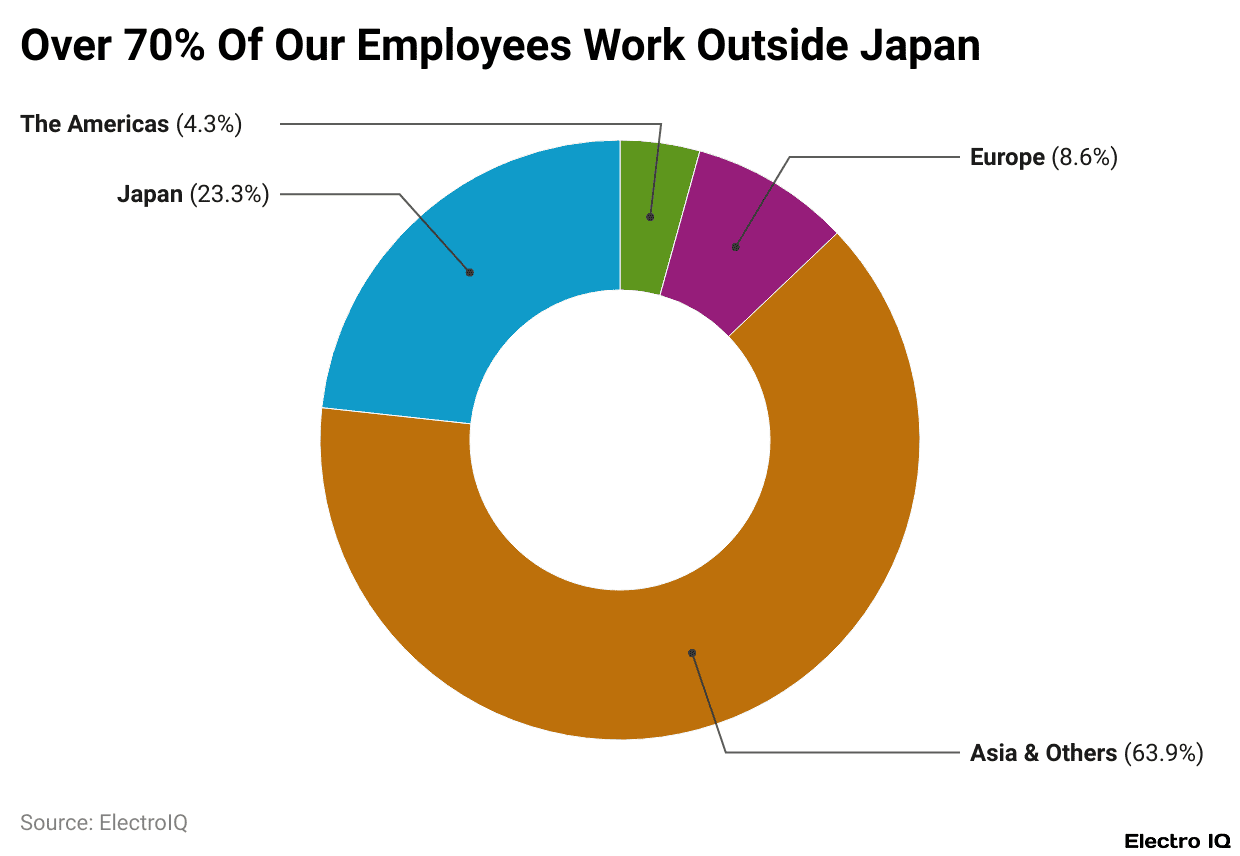
- As of March 31, 2024, Brother’s workforce distribution is spread across the various regions that represent the company’s overall global operational presence.
- Brother statistics reveal that the highest share of employees is in the Asian and other regions, representing 63.9% of its total workforce. This significant proportion reflects Brother’s extremely strong manufacturing, research, and operational bases in Asian countries outside Japan, probably due to lower labor costs, strategic advantages for the supply chain, and access to the growing market.
- Concerning Japan, Brother’s headquarters there are 23.3% of the workforce. This causes one to infer that Japan is an important hub for corporate operations, top management, research, and innovation. In contrast, the same high percentage means production and other functions have been largely outsourced to offer cost optimization and efficiency.
- Europe accounts for 8.6% of the workforce, indicating that the company has an interest in major European markets, perhaps for sales, distribution, and regional management offices.
- A relatively moderate percentage may suggest that European customers necessitate localized operations while keeping manufacturing in less expensive regions.
- Conversely, the Americas share, including North and South America, is less than 4.3%, which indicates Brother’s direct employee representation in these regions is limited, presumably concentrating on sales, customer service, and regional management instead of large-scale manufacturing.
- These lower returns suggest the company imports or collaborates for production but retains a strategic presence in these markets.
Brother Number Of Employees
| 2024 | 40,538 |
| 2023 | 41,653 |
| 2022 | 41,215 |
| 2021 | 38,741 |
| 2020 | 37,697 |
| 2019 | 37,769 |
| 2018 | 38,628 |
| 2017 | 38,628 |
| 2016 | 36,307 |
(Source: macrotrends.net)
- Employee numbers at Brother have changed throughout the years, indicating slow growth and few declines. In 2016, Brother had 36,307 employees.
- That number grew to 38,628 in 2017 and was held constant in 2018. A minor drop came in 2019, bringing the number down to 37,769, and in 2020, it fell to 37,697.
- In 2021, however, employment rose again to 38,741, while in 2022, it maintained that upward trend with 41,215 employees.
- The significant peak in terms of employee count in recent years was recorded in 2023, reaching 41,653, followed by a minor decline in 2024 with 40,538.
- There seem to be minor fluctuations in employee growth, but on average, the employees have maintained a steady growth pattern, with the company firmly standing behind its employees.
Brother Business Segment Profit
 (Reference: download.brother.com)
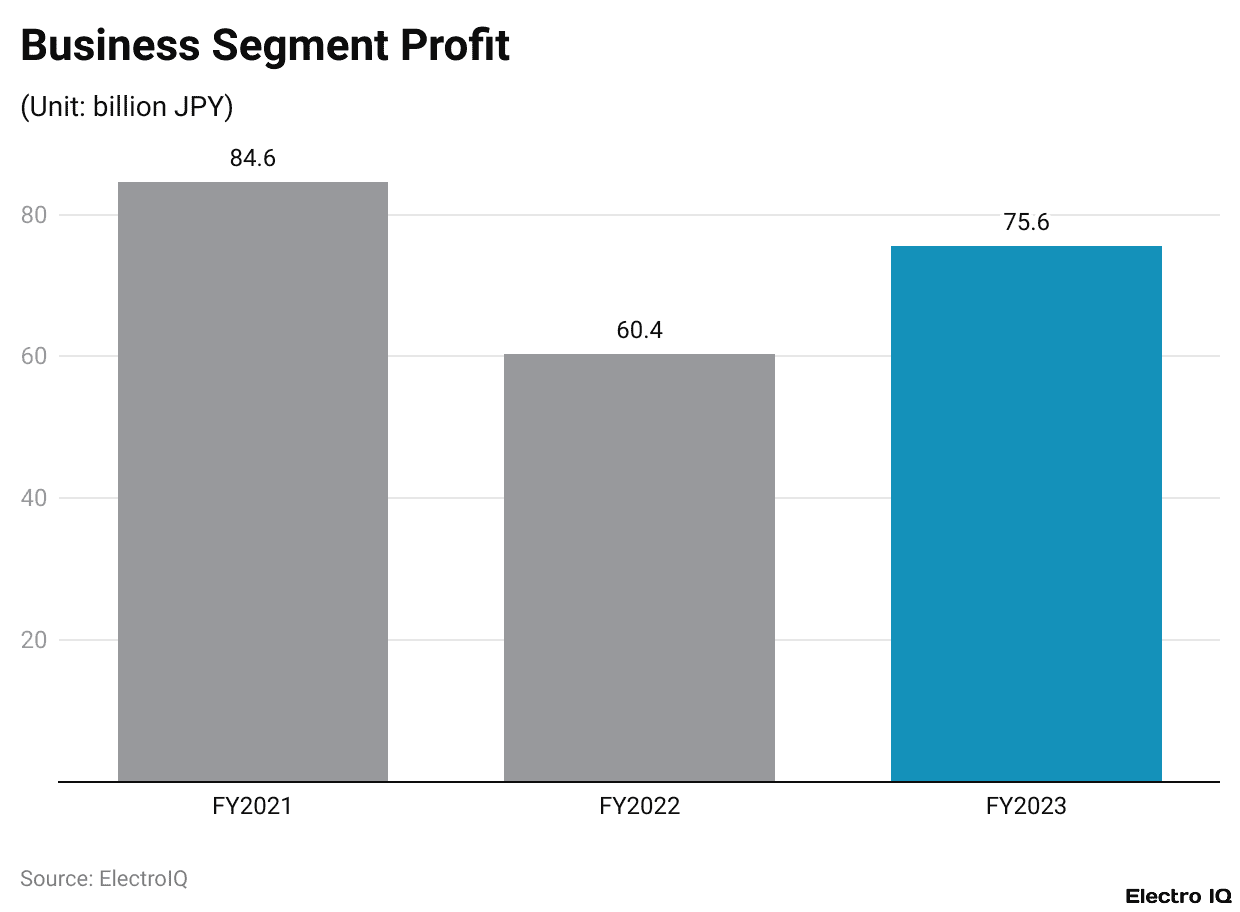
- The business segment profit of Brother has fluctuated over the three years of uninterrupted traversing: from 2021 to 2023.
- In FY2021, the company achieved a very good profit of 84.6 billion JPY. However, during FY2022, there was a considerable reduction in profits to 60.4 billion JPY, which was possibly due to market-related challenges or an increase in costs.
- By FY2023, the company bounced back with profits of 75.6 billion JPY, showing some degree of improvement but below-soared FY2021 profits.
- This trend shows that while the company faced challenges in FY2022, it took steps toward profitability in FY2023.
Brother Business Segment Profit Ratio
 (Reference: download.brother.com)
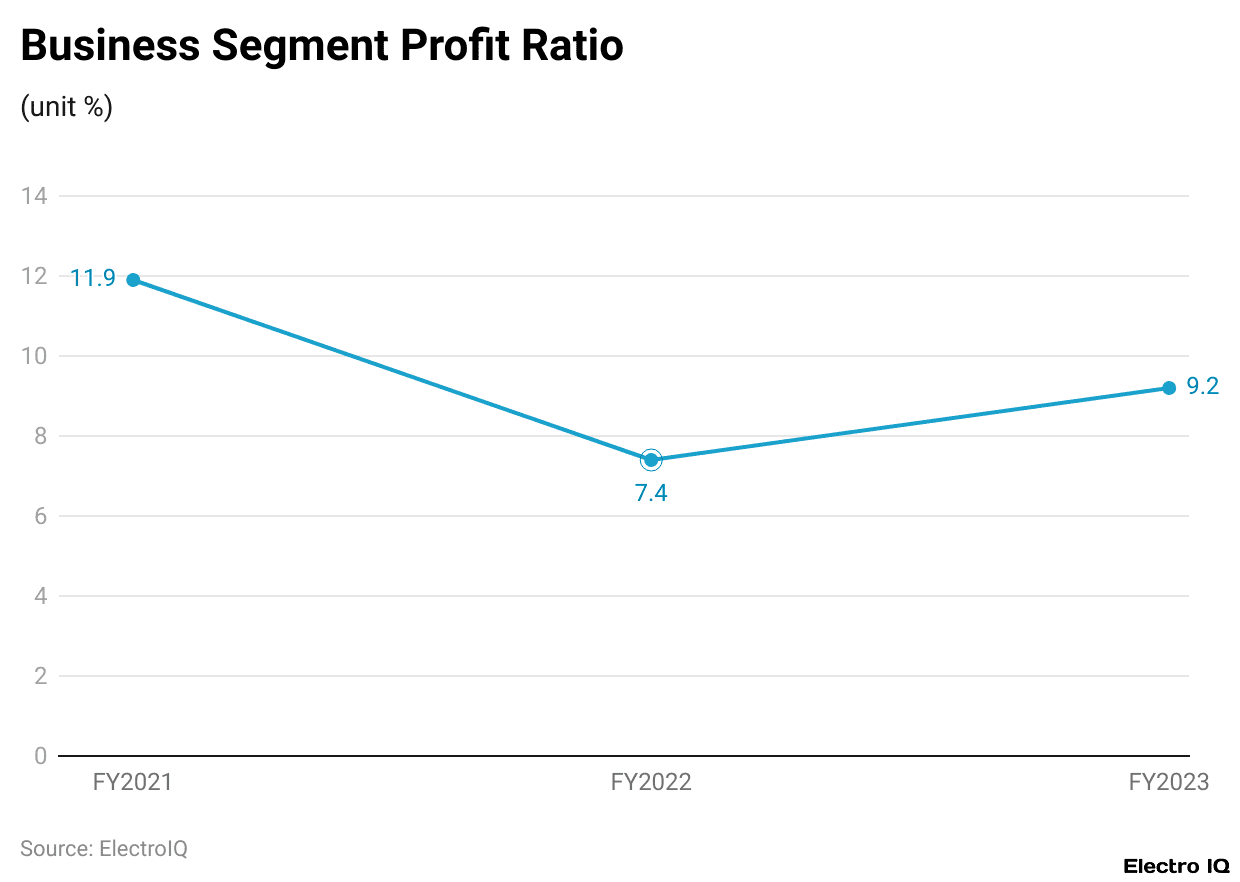
- The profit ratio of Brother’s business segment during the last three fiscal years has shown a variance. The profit ratio in FY2021 was 11.9% and implied an extremely healthy profit.
- In FY2022, however, it was a steep decline to 7.4%, reflecting increased costs, supply chain disruption, or market fluctuations affecting earnings.
- In FY2023, the profit ratio regained some ground to 9.2%, showing some recovery yet still being below FY2021 levels. This trend demonstrates the company’s response to operating under market conditions and external economic pressure.
Brother Number Of Males And Females Employees
| FY2019 | FY2020 | FY2021 | FY2022 | FY2023 | ||
|
Number of employees*2
|
Male | 3,026 | 3,024 | 3,067 | 3,084 | 3,071 |
| Female | 774 | 779 | 800 | 806 | 806 | |
| Percentage of female employees in total workforce | 20.40% | 21% | 20.70% | 20.70% | 20.80% |
(Source: global.brother)
- Brother statistics illustrate the distribution of male and female employees in Brother over the years FY2019-23.
- In FY2019, there were 3,026 male and 774 female employees. The number of male employees remained almost steady in the following years with slight changes, totaling 3,071 in FY2023.
- The number of female employees rose gently from 774 in FY2019 to 806 in FY2023, indicating gradual growth in numbers across the period.
- These numbers suggest that the percentage of female employees in the total workforce had a marginal increase over the years, starting from 20.4% in FY2019 to 20.8% in FY2023.
- This indicates that growth in female employees was recorded, but the females were still measly counted in the total workforce that continued to be predominantly comprised of males.
- The percentage had remained at around 20.7 in the other years while increasing slightly in FY2023.
Brother Net Income Growth
 (Reference: globaldata.com)
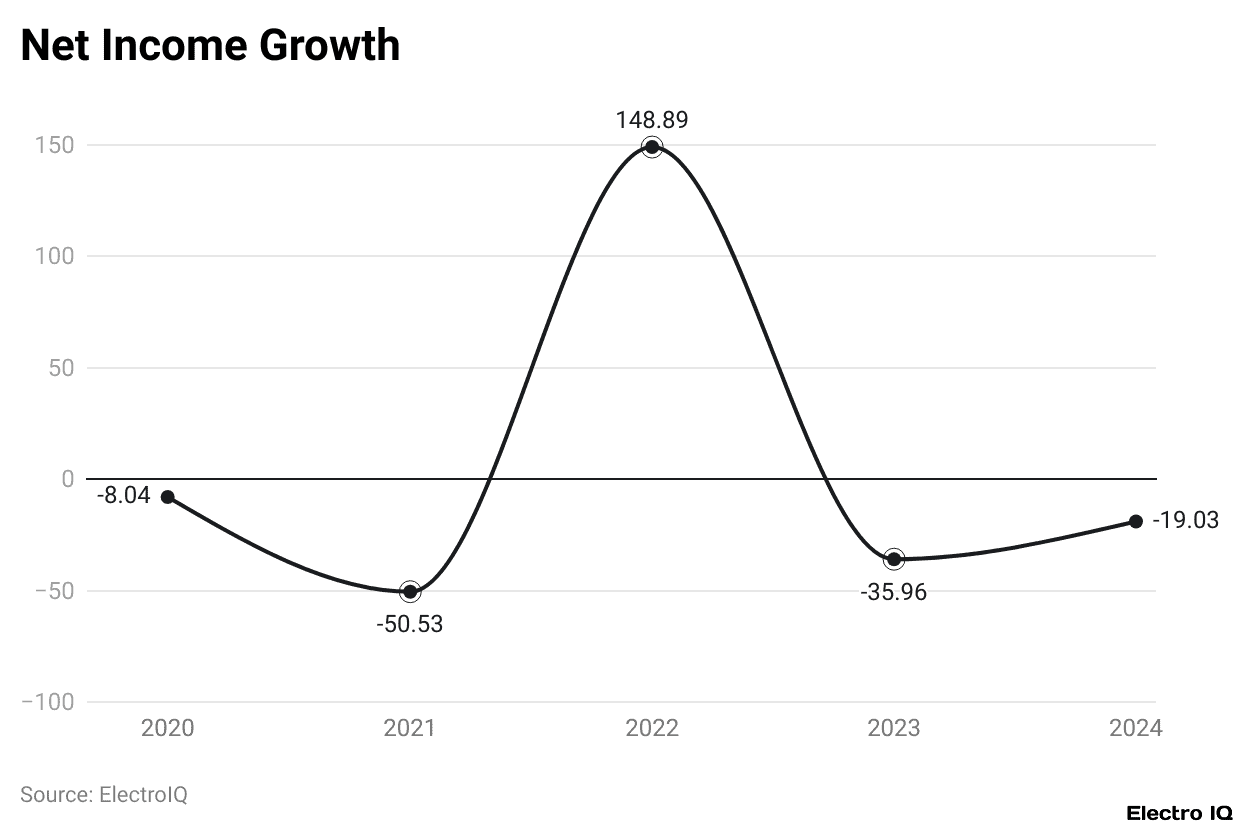
- Brother statistics represent the net income growth of Brother Industries during the past few years. Brother is predicted to show net income growth of 19.03 in 2024, following a sizable recovery from the negative growth of -35.96 obtained in 2023.
- In 2022, Brother showed strong positive growth of 148.89, a great improvement compared to previous years. Nevertheless, net income growth fell in 2021, recording -50.53, and 2020 also had negative growth when -8.04 was recorded.
- This data shows the variability in the company’s performance in the last five years when periods of growth alternated with some decline.
Brother Industry Resource Consumption And Product Raw Materials
 (Reference: download.brother.com)
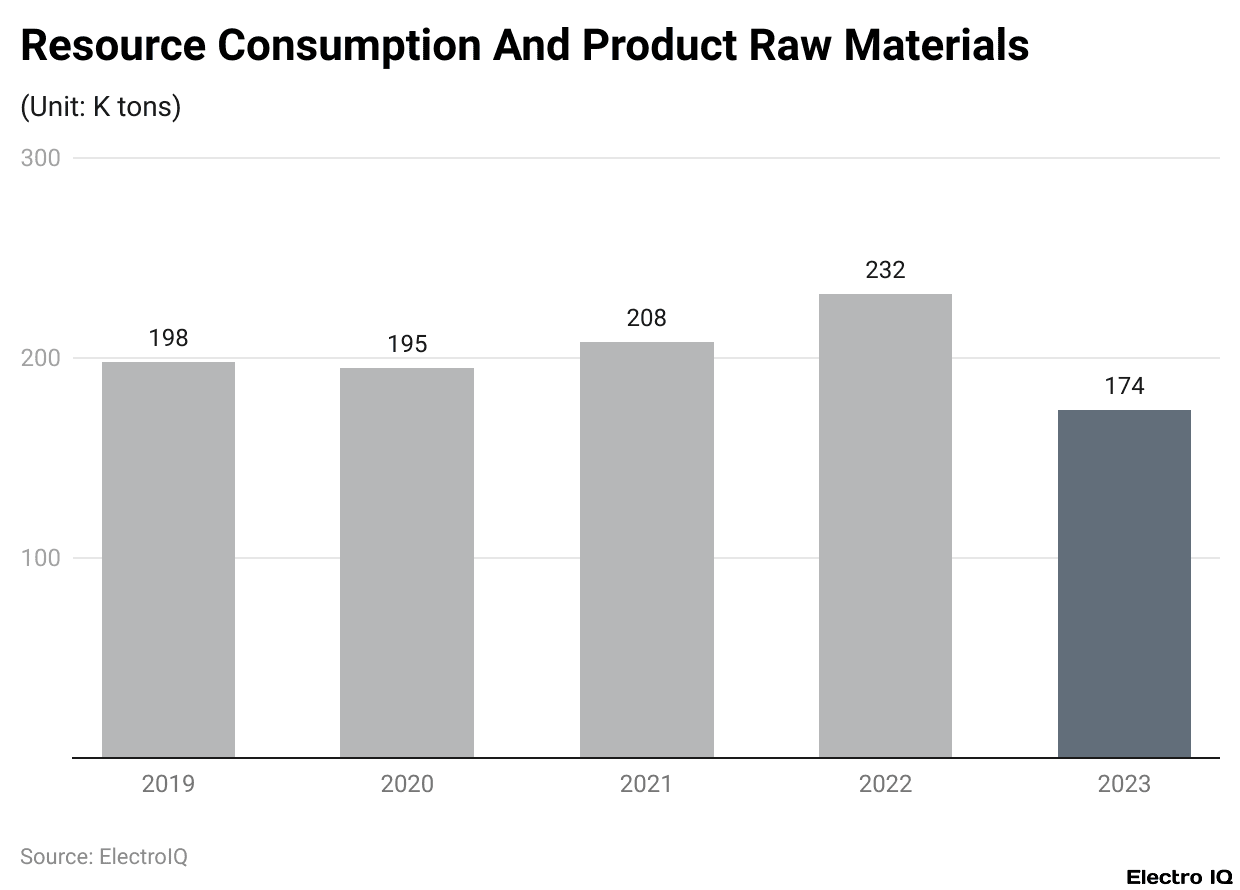
- According to the Brother statistics presented, the resource consumption and product raw materials utilized by Brother Industries over five years are measured in kilotons (K tons).
- In 2023, the company had used 174 K tons of raw materials, signifying a decrease from 232 K tons that were consumed in the year 2022.
- The figures for 2021 and 2020 were 208 K tons and 195 K tons, respectively, showing a decrease from the 2022 figures yet still higher than the 2023 levels.
- In 2019, resource consumption stood at 198 K tons, slightly above the consumption in 2023 but lower than that in 2021 and 2022.
- This trend suggests a variability in resource consumption over the years with a remarkable drop in the year 2023.
Brother Industry R&D Expenses
 (Reference: download.brother.com)
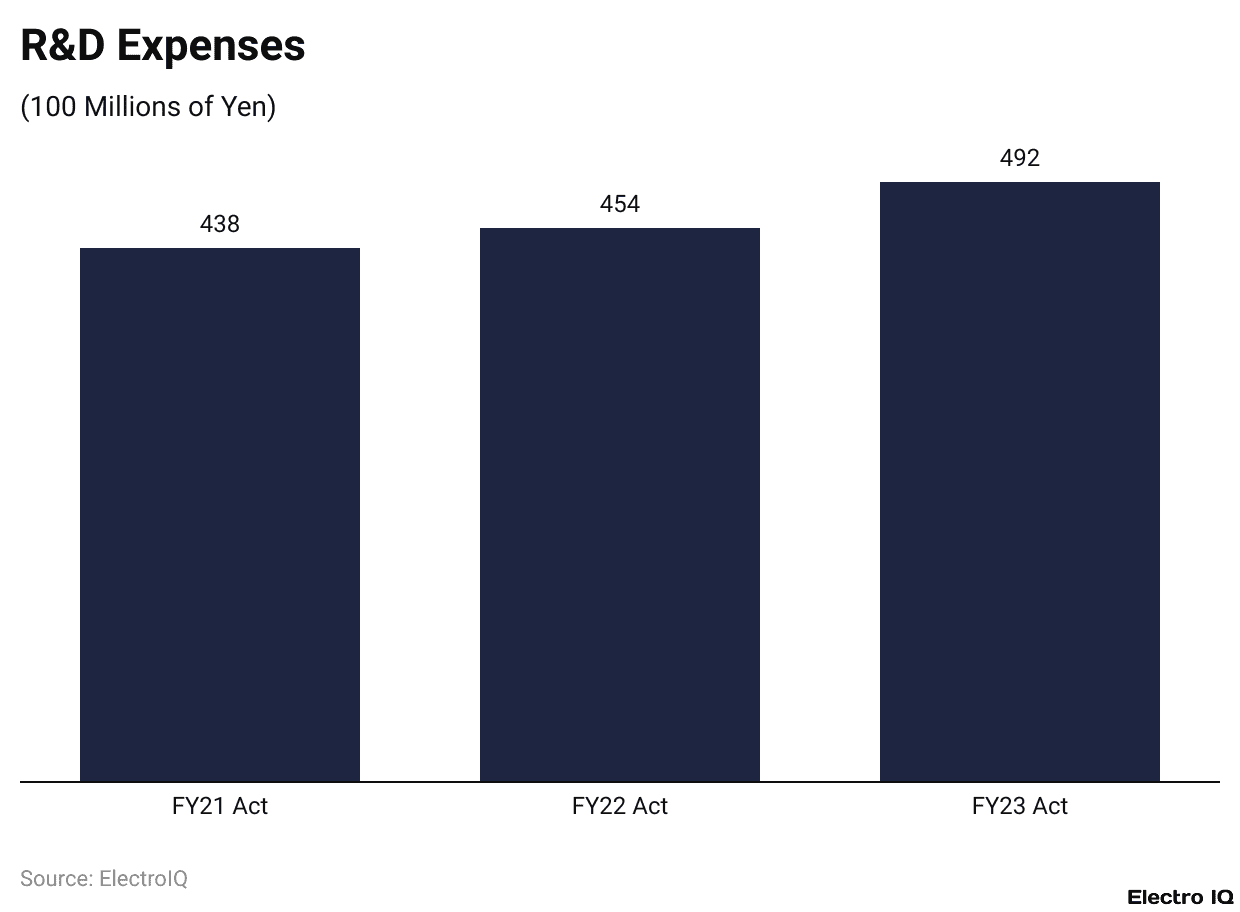
- Brother statistics data on the Research and Development (R&D) outlay of Brother Industries from the fiscal years 2021 through 2023 shows that in FY21, Brother spent ¥438 million on R&D. This amount rose to ¥454 million in FY22, up by ¥16 million, or nearly 3.6%.
- In FY23, the R&D expenditure continued to increase, reaching ¥492 million, representing an additional ¥38 million from the prior year, or an 8.4% rise.
- Thus, Brother seems to have continuously increased its R&D investment over the past three years, illustrating the company’s commitment to supporting innovation and technological development, which is indispensable for sustaining growth in the highly competitive markets in which it operates.
Conclusion
As per Brother statistics, Brother Industries managed to sustain steady revenues given difficult market conditions and took strategic measures to handle the declining net income and profit margins. Innovation has its focus, and strategic investment puts the company in an advantageous situation for potential growth next fiscal year.
FAQ.
Brother Industries recorded moderate revenue growth of 0.94% in FY 2024 on revenue of ¥822.93 billion, marking a significant slowdown from 14.68% growth in 2023 and 12.52% in 2022.
Americas accounted for the largest share of sales at 34.4%; in Europe, this was close behind at 27.7%. Japan contributed 14.2%, while the rest of Asia and others contributed 23.8% to total sales.
Brother’s workforce increased modestly, amounting to a peak of 41,653 employees in the year 2023. This decreased slightly to 40,538 in 2024. The company has also seen an increase in the number of female employees from 774 in 2019 to 806 in 2023, who make up roughly 20% of the total workforce.
Brother forecasts an increase in net income for fiscal year 2024 by 19.03%, advancing from a drop in 2023 of -35.96%. In 2022, the company experienced considerable growth, with a positive increase in net income of 148.89%.
Among various business sectors of Brother, Printing & Solutions is the biggest contributor in revenues, representing 62.6% of total. The Domino Business is the next-largest contributor, with 13.3%, dealing with industrial printing solutions.

Barry Elad is a passionate technology and finance journalist who loves diving deep into various technology and finance topics. He gathers important statistics and facts to help others understand the tech and finance world better. With a keen interest in software, Barry writes about its benefits and how it can improve our daily lives. In his spare time, he enjoys experimenting with healthy recipes, practicing yoga, meditating, or taking nature walks with his child. Barry’s goal is to make complex tech and finance information easy and accessible for everyone.