Credit Card Statistics By Age, Income, Transaction and Fraud (2025)
Updated · Sep 13, 2025


Table of Contents
- Introduction
- Editor’s Choice
- Share Of Respondents Who Own Credit Cards
- Cash Vs. Credit: U.S. Transaction Trends
- Credit Card Debt Statistics
- Share of Credit Card Payments
- Credit Card Market Share By Purchase Value
- Credit Card Debt of Americans
- Credit Card Debt By Age
- Credit Card Debt By Income
- Credit Card Statistics During The COVID-19 Era
- Credit Card Fraud Statistics
- Conclusion
Introduction
Credit Card Statistics: Credit cards have become a global synonym for a timely source of financial assistance, propagation of convenience, and flexibility in managing personal finances. With 2024 still on, credit card usage has registered a palpable increase, caused by a dynamic change in consumer behaviour, economic conditions, and technological advancement.
This treatise takes into account credit card statistics for 2025, central trends, numbers, and observations from around the world.
Editor’s Choice
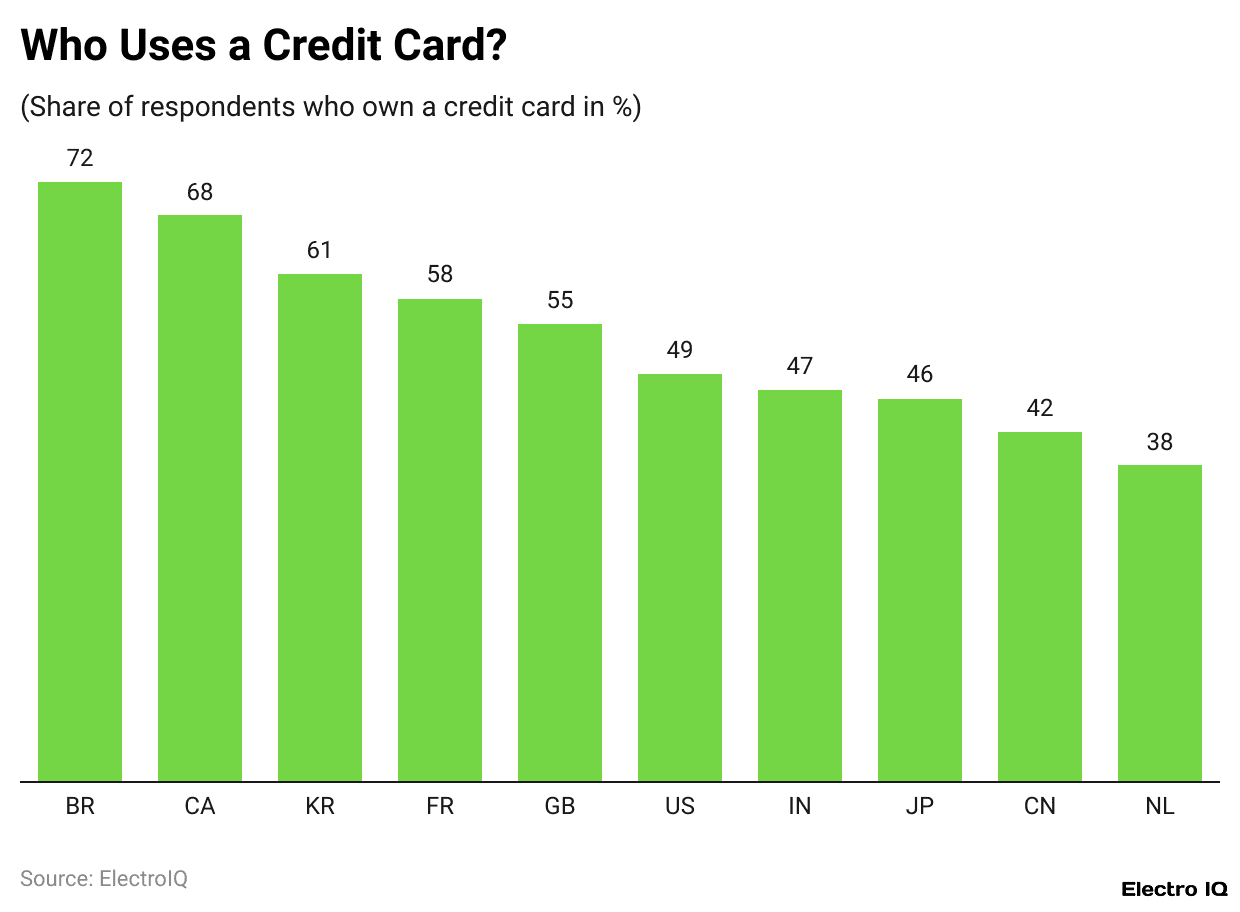
- In Brazil, 72% of adults aged 18 to 64 reported owning a credit card, many using cards that act as debit and credit cards with instalment payments.
- Canada has a ratio of 68% for credit card ownership, with more credit cards being in circulation than debit cards, thanks to reward programs.
- In the U.S., 49% had a credit card, and in China, the numbers came down to 42% with 38% in the Netherlands, depicting a stark difference from region to region.
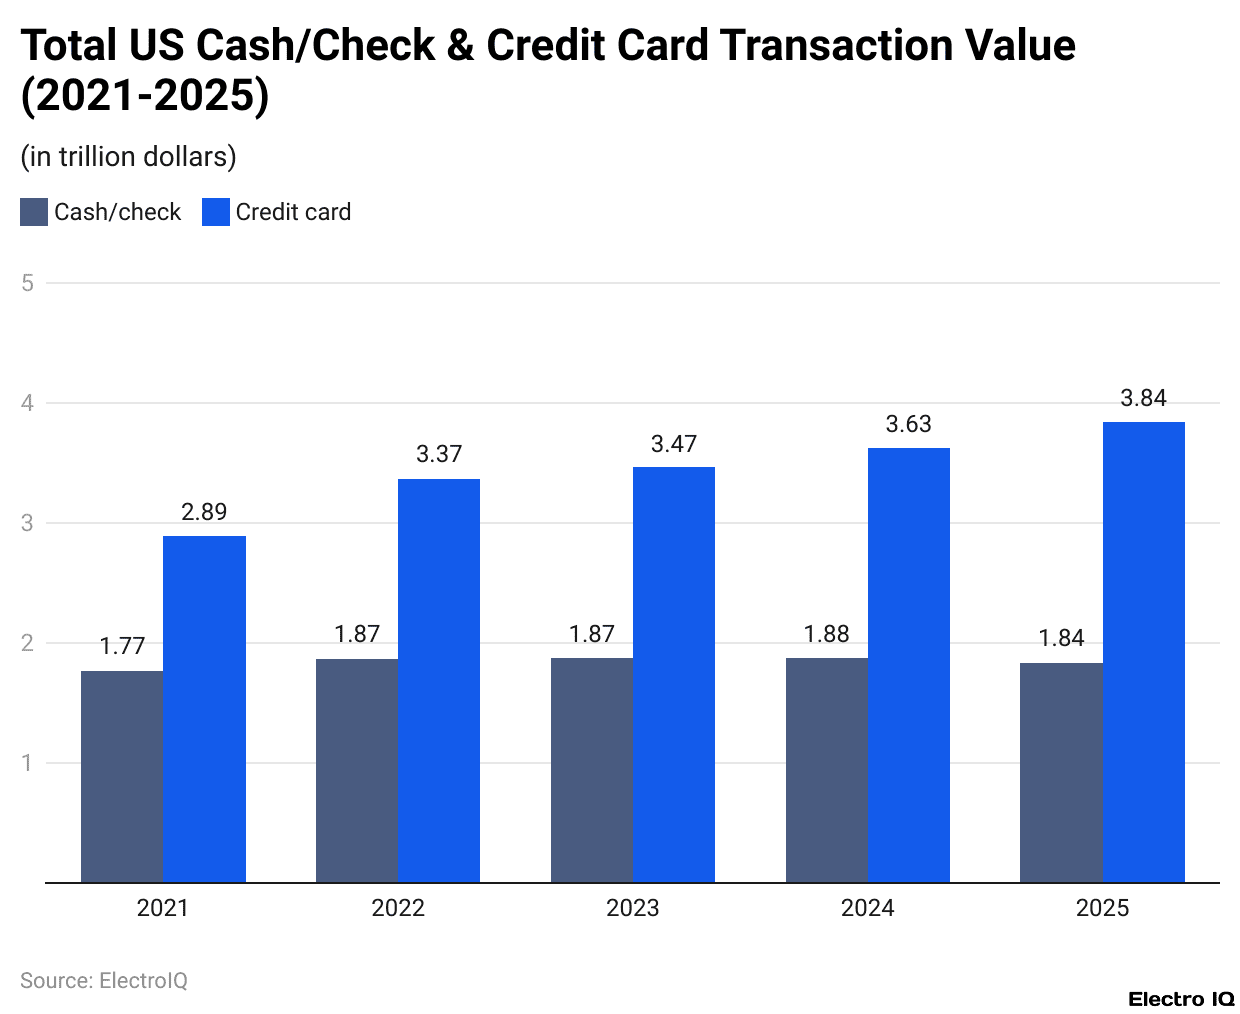
- Credit card payments in the U.S. always beat out cash-and-check transactions; US$3.843 trillion by 2025, it would stand against US$1.836 trillion of cash-and-checks.
- Revolving credit card debt in America would top US$1.14 trillion by 2025, with 41% of credit card holders carrying a balance through the month.
- Credit card use has increased from 18% in 2016 to 35% in 2024, almost doubling in eight years.
- UnionPay is the leader in the global credit card market, posting US$6.9T in purchase volume, followed by Visa (with US$6.3T) and Mastercard (with US$4T).
- Average U.S. credit card balances by age groups are: Gen Z with US$2,990, Millennials with US$7,490, Gen X with US$8,360, Baby Boomers with US$5,420, and the Silent Generation with US$3,280.
- During 2020, with lockdowns, subprime originations fell sharply, but improved credit health was discernible, as FICO scores reached 710 in 2020.
- An increase in credit card fraud was witnessed, with the U.S. accounting for 35.8% of the global loss (USUS$10.24B) in 2021; major categories are card-not-present fraud and new account fraud.
- In terms of global losses faced by payment card fraud, US$28.5B was recorded in 2021, with projections to surpass US$49B by 2030.
- The remote fraud (card-not-present) is one of the fastest-growing threats, costing retailers almost US$130 million between 2018 and 2023.
(Reference: statista.com)
- In Brazil, most shoppers tend to have a single card that serves both debit and credit functions.
- Nevertheless, the majority of credit cards in the country also give the flexibility of paying in instalments.
- According to the 2024 Statista Consumer Insights Survey, credit card statistics show that 72% of online respondents between 18 and 64 reported credit card ownership, confirming widespread ownership among adults.
- In Canada, credit card ownership is also high, with 68% of Canadians carrying a card.
- Canadians tend to keep credit cards to capitalise on rewards programs.
- Canada has one of the highest credit card penetration rates in the world, with quite a few of them owning one or two credit cards.
- Interestingly, in Canada, credit cards outnumber debit cards, which is quite unusual compared to many other countries.
- In 2020, 49% of Americans reported credit card ownership, while China reported a 42% ownership rate, and the Netherlands trailed at 38%.
- It is, therefore, evident that credit card usage is largely country-specific, with some bearing on local financial habits and payment preferences.
Cash Vs. Credit: U.S. Transaction Trends
(Reference: coinlaw.io)
- As per Coinlaw, credit card statistics state that Credit card payments have topped cash and check payments every year from 2021 to 2025. In 2021, US$2.893 trillion worth of payments were processed via credit card, whereas the cash and check payments amounted to an inferior sum of US$1.769 trillion.
- By the end of 2022, the credit card transactions reached a value of US$3.370 trillion, whereas payments by cash and checks increased marginally to US$1.869 trillion.
- In 2023, this increase continued; credit cards, being the mode of payment of US$3.466 trillion, were way ahead of something that cash and checks could do, i.e., US$1.873 trillion.
- Further on, in 2024, the credit card transactions climbed to US$3.625 trillion, far ahead of the US$1.879 trillion to be paid by cash and checks.
- Forecasts show that by 2025, the usage of credit cards should leap to US$3.843 trillion, whereas payments by cash and checks are expected to see some decline to US$1.836 trillion.
- This set of data puts on clear display the continuing decline of cash transactions, on which consumers have chosen to go digital and card.
Credit Card Debt Statistics
- In 2025, revolving debt soared in the United States to US$1.14 trillion, with credit card debt accounting for most of this.
- This sudden surge in the level of debt stands as evidence of inflationary pressures and a general tendency by households to load up on credit.
- About 41% of credit card holders maintained balances for several months during the year, which suggests worsening financial pressures and increasing interest rates.
- 53% of American adults had incurred credit card debt at one point or another in 2025, stating excessive APRs and mounting daily expenses as their reasons for not clearing these balances every year.
- Unexpected bills- medical, home repairs, or car emergencies- charged to credit cards remain a reality; 37% said they used theirs for this purpose. Emergency savings have thus declined over the years.
- According to the latest report, credit card delinquencies rose to 3.26% by Q3 of 2025, signifying an increase in the share of borrowers having trouble making minimum payments amid rising interest rates and tightening credit criteria.
- As against the total of credit card debt, US$1.07 trillion was considered revolving debt, with an increasing number of Americans carrying balances for longer rather than clearing them each month.
- Credit card balances feature high revenue in California, Texas, and Florida, each surpassing the US$110 billion mark in 2025. This is mainly due to their large population, high cost of living, and consumer spending.
(Reference: sellerscommerce.com)
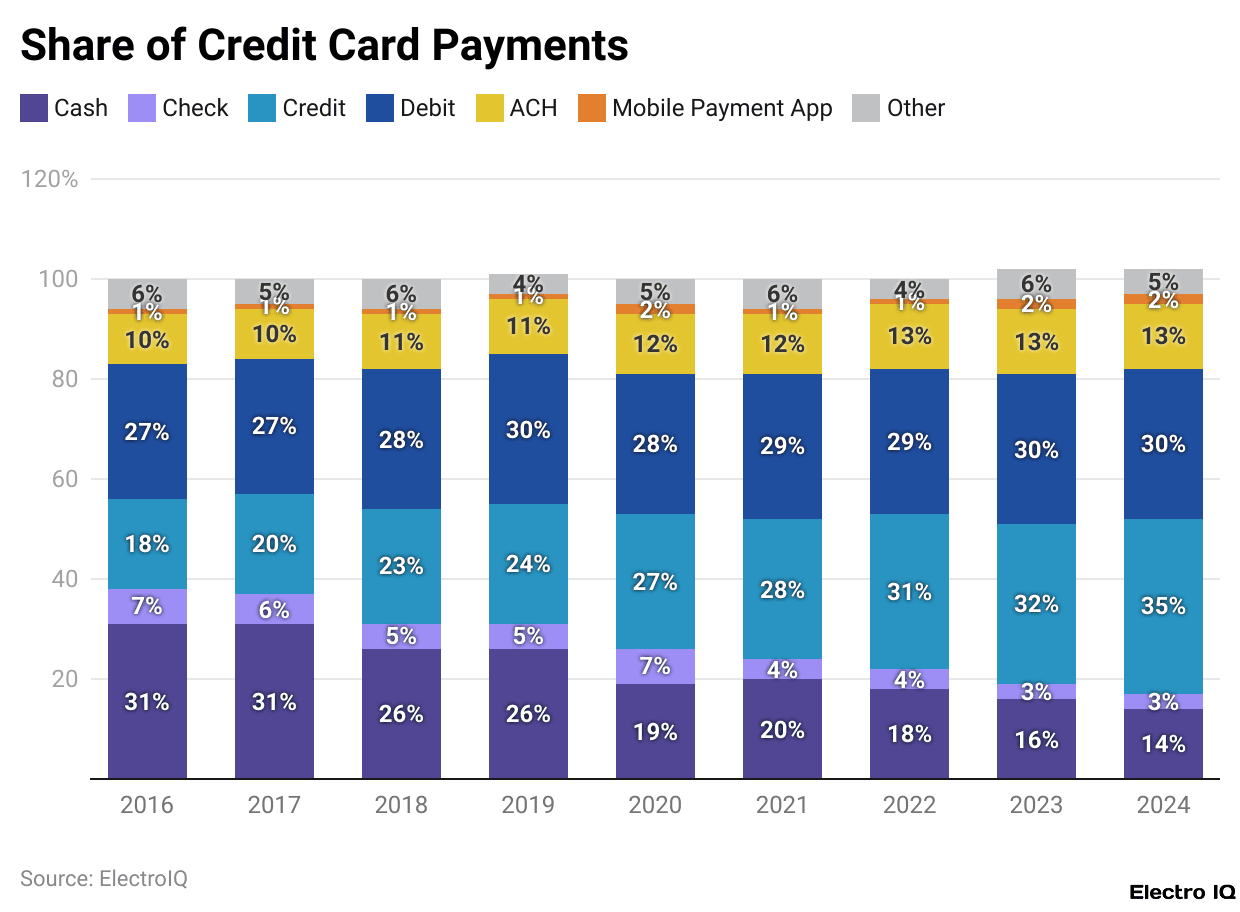
- Credit card usage in the United States saw lulls and growth over the past nine years. Until 2016, credit card payments constituted barely 18% of various payment methods.
- This number rose to 27% in 2020. The sharp rise was mainly fueled due to the pandemic, where customers gravitated toward contactless and digital payment options.
- Further into 2022, we see the rise continue with credit card acceptance at 31%, exhibiting a growing preference for lending, that is, credit-based options.
- By 2023, credit cards were up to 32% of payments, and their market share grew to 35% in 2024; hence, they were flying the largest banner among all payment instruments.
- Thus, credit card acceptance almost doubled from 2016 to 2024, rising by an enormous 17% points.
| Card Brand | Purchase Volume |
Market Share
|
| UnionPay | 6.9 Trillion | 35% |
| Visa | 6.3 Trillion | 32% |
| Mastercard | 4 Trillion | 21% |
| American Express | 1.7 Trillion | 9% |
| JCB | 0.32 Trillion | 2% |
| Discover | 0.256 Trillion | 1% |
(Source: sellerscommerce.com)
- According to the Nilson Report for 2023, credit card statistics show that UnionPay is the largest credit card network, handling US$6.9 trillion of purchase volume, about 35% of global purchases through credit cards.
- Visa is a close second, with US$6.3 trillion accounting for 32% of the market, followed by Mastercard with US$4 trillion, or 21%.
- These numbers are consumer, small business, and commercial credit card transactions across the globe.
Credit Card Debt of Americans
(Source: sellerscommerce.com)
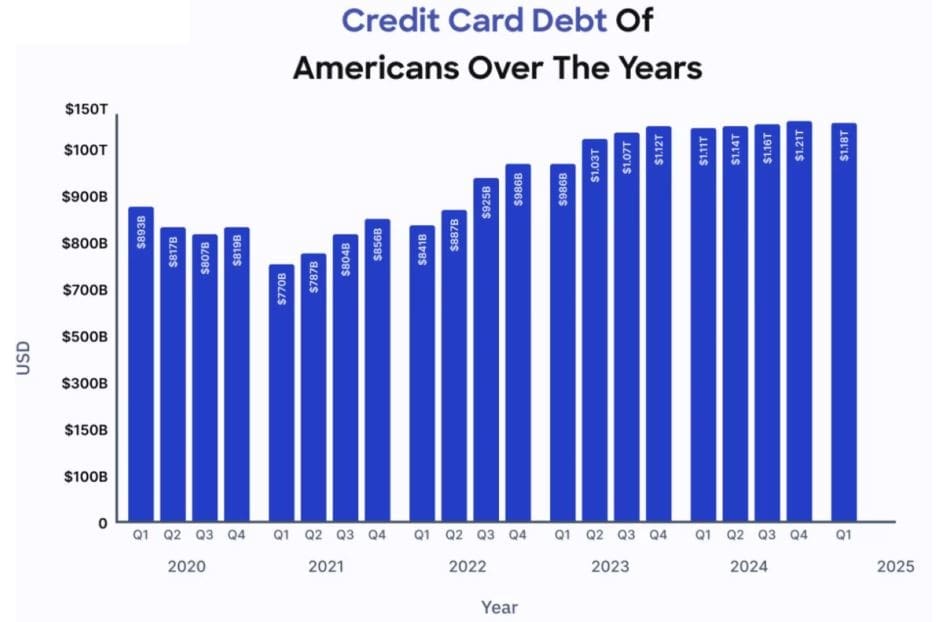
- Over the last five years, credit card debt in the United States has risen and fallen from one month the another.
- The period between Q1 and Q3 2020 saw credit card balances falling from US$893 billion to US$817 billion and then to US$807 billion, largely owing to less spending capacity amongst Americans during the pandemic.
- Towards the end of 2020, the debt was slowly and slightly increasing to US$819 billion.
- Throughout 2021, the debt remained relatively low, starting at US$770 billion in the first quarter and gradually growing to US$856 billion by the year’s end.
- The trend was upward in 2022, with balances rising steadily from US$841 billion in the first quarter to US$986 billion in the fourth.
- Debt started crossing over US$1 trillion in 2023, beginning the year at US$986 billion, then moving to US$1.03 trillion by the second quarter, US$1.07 trillion in the third quarter, and US$1.12 trillion in the fourth.
- In 2024, balances continued upward from US$1.11 trillion in the first quarter and closed out at US$1.21 trillion for the year, the highest point registered for the series.
- Into the first quarter of 2025 came a small retreat, with balances pulling back slightly to US$1.18 trillion after many quarters of climbing.
- In general, these data reflect a strong upward climb in credit card debt since the pandemic years, driven by inflation, an increasing tendency toward credit, and rising consumer spending.
Credit Card Debt By Age
- In 2025, credit card debt and its relative measures went all over the generational map, with varied economic and financial challenges in place, differing life stages, and peculiarities germane to each group.
- Generation Z, aged 18 to 24, recorded the fastest growth at 7.4%, which pushed their average balances up to US$2,990 per person.
- The rise came as more young adults entered the credit system while facing higher living expenses and education costs.
- Millennials, ages 25 to 40, carried an average of US$7,490 worth of debt, mostly accrued from expenses related to families, higher rents, and travel.
- Gen X, between 41 and 56, carried the highest balances on average at US$8,360 in 2025, a 3% climb from a year ago, with debts marked by the struggles of paying mortgages, supporting children through college, and a shortage in retirement savings.
- Baby Boomers, ages 57 to 75, saw their balances decline to an average of US$5,420 as many focused their attention on paying down debt and retirement preparations.
- The Silent Generation, age 76 and older, maintained the lowest average debt amount at US$3,280; however, they became the most at risk of missing payments given their limited or fixed incomes.
- Millennials emerged as the group still most reliant on credit cards for emergency expenses, with 61% citing healthcare, home repairs, and other unexpected costs as reasons for their increased balances.
- Meanwhile, Gen Z led in opening new credit card accounts, as 34% started new accounts in 2025, often looking at digital-first options, rewards, and credit-building tools.
Credit Card Debt By Income
- In 2025, credit card debt levels were quite different depending on the household income. This tells us that financial pressures and spending habits are different among various groups.
- Households under US$40,000 a year averaged a balance of US$4,120, relying too much on credit to meet the essentials of rising housing and food costs.
- Middle-income households, consisting of those making between US$40,000 and US$80,000, carried average balances of US$5,980, up 5.8% from a year earlier, as inflation outran wage growth in many industries.
- High-income households, making over US$100,000, showed much higher averages, measuring US$12,760, exhibiting that they possessed far greater spending power, travelling more for other reasons to carry higher balances so that they can use credit cards for reward maximisation.
- Among this group, the top 20% of earners with incomes of US$150,000 plus accounted for 35% of the total U.S. credit card debt in 2025, although they are a smaller part of the population.
- Lower-income households experienced the biggest growth in debt, now at 10.1% in 2025, continuing under financial strain, with higher interest rates and limited alternatives to credit.
- On the other hand, the credit utilisation rate was the highest at 33.5% for households whose income was between 50 and 75 thousand dollars, a level that can adversely affect credit scores.
- High earners were far more likely to put expensive purchases on their credit cards, with 47% charging over US$1,000, whereas for lower-income households this was only 24%, speaking volumes for spending flexibility and confidence in repayment.
Credit Card Statistics During The COVID-19 Era
- They say subprime card originations dropped thus sharply during the COVID-19 pandemic, falling from 2.53 million in the first quarter of 2020, to 1.84 million in the second quarter.
- TransUnion reported an indication that lenders started tightening lending standards in the face of economic uncertainty.
- By the third quarter, however, originations had bounced back to 2.80 million.
- The total number of consumers with credit cards also declined in 2020. According to TransUnion, there was a listing of 452,843,000-odd card accounts in the fourth quarter of the year, though in the first quarter of 2021, the figure saw a minor rise to 454,614,000.
- The data from Experian indicated that Americans managed their credit well during that period.
- For example, the average VantageScore went up from 682 in 2019 to 688 in 2020, and the average balances steadily went down from US$6,629 in 2019 to US$5,897 in 2021.
- According to CreditCards.com, credit card statistics show that nearly half of U.S. adults, about 47%, entered the pandemic already confronting credit card debt.
- It is quite possible that the percentage of indebted cardholders crossed the 50% mark during the crisis, given that many households were seeing a worsening in their circumstances.
- Experian reported that by March 2021, credit card balances were down by more than 13% compared to the year earlier, down US$968 to US$5,525.
- Even though card issuers partly helped, delinquency rates also dropped; 2% of open credit card accounts reported availing such assistance in April 2020, but many had exited by May at 0.8% and again by June at 1.1%.
- Experian further stated that the proportion of accounts 30 days past due had fallen to 1.67% in 2021 from 1.82% in 2020.
- Despite the peak of distress being reached by the U.S. economy, there was no surge in defaults among the common man.
- Rather, many actually improved their credit health, their FICO scores upping by seven points in 2020 to 710 from 703 a year earlier.
- That is the highest increase experienced by FICO scores in a single year ever, beating the previous high of 3.8 points achieved between 2015 and 2016.
- At the same time, nearly one in five cardholders reported that they had had limits cut during the pandemic, according to NerdWallet.
- Among those who had their credit limits reduced, 51% reported relying more on another card they already had.
- More than one-third said they’d try to reduce their credit use, along with saving more cash, should their limits be cut again.
Credit Card Fraud Statistics
(Source: founderjar.com)
- Account fraud had been starkly on the rise in 2021, by almost 48%, per the Federal Trade Commission, with a total of 365,597 fraud reports having been lodged.
- Impersonation was the chief sort of identity theft at 29.39% of cases, followed by card fraud and then thefts of government credentials or benefits.
- Wire transfers suffered their share of the attacks, with 56,811 reports out of 250,678 cases in payment methods, resulting in losses worth US$311 million.
- Venues guilty of card fraud in the spectrum of age groups had seen the 30 to 39-year-olds as being the most commonly targeted, with 110,952 reports, followed by 40- to 49-year-olds, with 78,612 cases in 2020.
- Other age groups stood below these figures: 20- to 29-year-olds averaged 65,779 cases; the 50 to 59 group reported 45,175, and 60 to 69-year-olds had 21,634 cases.
- Those under 19 years, being the only age group, had the fewest victim reports, with just 2,186.
- The Card Fraud in the United States accounts for more than one-third of global card fraud losses, which amounts to US$10.24 billion or 35.8%, according to the Nilson Report.
- This marked an increase from US$9.62 billion recorded in 2020, when the share was 33.58%. Experts opine that increasing card-not-present (CNP) transactions, especially post-COVID, have fueled such fraud and losses.
- For every dollar paid through CNP fraud, U.S. merchants suffer an approximate loss of US$3.36.
- Card fraud costs every American around US$311 on average, though the actual costs vary remarkably, with some going up to huge sums.
- With over 190 million credit cards being there and credit card debt crossing US$1 trillion internationally, the scope for theft remains abnormally high.
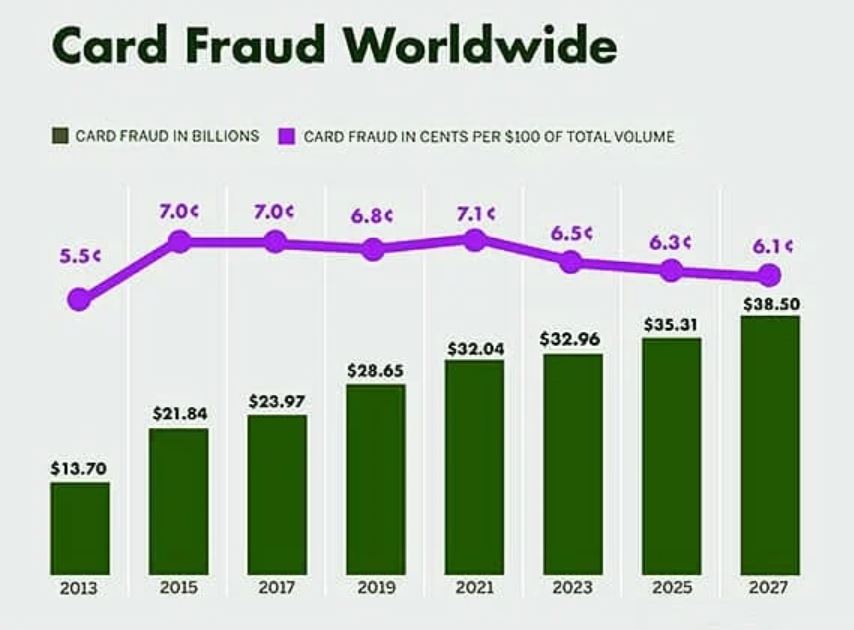
- Payment card fraud globally cost over US$28.5 billion in 2021, dipping some from US$28.65 billion from last year.
- While this is alarming, experts warn that the issue will only worsen as more people adopt the use of credit cards.
- New account fraud is on a rapid rise, shooting up by 48% in the course of one year, while ATM fraud with stolen cards is on a growth scale by 9%.
- Going forward, it is predicted that card fraud losses will cross US$49 billion in 2030, with the total volume of payment cards touching US$79.14 trillion. Global fraud losses shall hit 38.5 billion by 2027.
- According to Arkose Labs, in 2021, fraud attempts accounted for almost one-fourth of all possible digital world interactions, constituting around 22.9% of all online activities.
- The United States was the number one intended victim that received over 1.3 billion out of the 4.4 billion total number of fraud attacks worldwide.
- In 2021, the amount of bank card transactions stolen stood at US$6.81 for every US$100 worldwide, which was a slight increase from the previous year.
- In the United States, losses were even higher at 10.89 cents per one hundred dollars, compared to 10.25 cents in 2020.
- Most card fraud losses during 2021 were between US$1-US$1000. However, out of the 526,007 cases reported last year, nearly half came from US$1-US$100 losses.
- The fewest number of cases fall in the range of US$8k-US$9k with just 3,451 reports, while 39,734 cases involved losses of more than US$10,000-k-gray-amount-towards-a-meaningful-share-of-fraud.
- Stolen credit card data has become cheap: some are selling for as low as US$5, with more detailed sets fetching US$150, according to Forbes.
- Remote fraud or card-not-present fraud has now become one of the most common stealing methods, and it is considered to have cost retailers nearly US$130 million from 2018 to 2023, states Juniper Research.
Conclusion
Credit Card Statistics: The year 2024 showed significant happenings in credit card usage all over the world, with sizable increments seen in both developed and emerging markets. U.S. credit card balances stayed more or less the same, while in India, credit cards were trending up really fast in terms of adoption and spend.
Credit cards remain an instrument of binding a person in the management of his/her personal finances owing to the dynamics of the accounts inflected by technology, economic changes, and changes in consumer behaviour.
FAQ.
Credit card ownership varies from country to country. 72% of Brazilians between the ages of 18 and 64 owned a credit card in 2024, commonly used as dual-purpose cards acting as debit and credit. Canada comes next with a 68% ownership rate, with credit cards outnumbering debit cards mainly on account of rewards programs.
Credit card usage for payments has been steadily growing in the U.S., both in terms of transaction volume and proportion. Transactions continue to dominate cash and checks, with a projection toward hitting US$3.843 trillion by 2025 versus US$1.836 trillion for cash/checks.
In the U.S., credit card debt has been on a sharp ascent following the pandemic. By 2025, total revolving debts are forecasted to reach US$1.14 trillion, with 41% of holders opting to carry balances month to month. Depending on the level of maturity and income, debt fluctuates: Gen X carries the highest average balances (US$8,360), while balances for Gen Z grew the fastest (US$2,990).
During the pandemic, subprime credit card originations fell almost overnight due to tighter lending standards, yet consumer credit health improved. Average FICO scores rose to 710 in 2020, while average balances declined, consistent with lowered spending and the support programs.
Credit card fraud is on the rise, chiefly in the U.S., which accounted for 35.8% of global losses (US$10.24 Billion) in the year 2021. Card-not-present and new-account frauds are significant contributors. Worldwide, the figure for payment card fraud stood at US$28.5 billion in 2021 and is forecast to reach levels exceeding US$49 billion by 2030. Most losses lie between the US$1-US$1,000 mark, but the cases of high-value fraud continue to occur in staggering numbers.

I hold an MBA in Finance and Marketing, bringing a unique blend of business acumen and creative communication skills. With experience as a content in crafting statistical and research-backed content across multiple domains, including education, technology, product reviews, and company website analytics, I specialize in producing engaging, informative, and SEO-optimized content tailored to diverse audiences. My work bridges technical accuracy with compelling storytelling, helping brands educate, inform, and connect with their target markets.