Device As A Service Statistics By Market Size, Region, Purchases and Preferences (2025)
Updated · Sep 19, 2025

Table of Contents
- Introduction
- Editor’s Choice
- Evolution of Device-as-a-Service (DaaS)
- Device-as-a-Service Market Statistics
- US Device as a Service Market
- Device-as-a-Service Market Share by Region
- By Enterprise
- By Top Players
- By Employee Size
- By Industry
- Leading Cloud Infrastructure Service Providers
- Region-Wise IoT Devices Offered as a Service Statistics by Number of Devices
- Device-as-a-Service Statistics by Purchases and Preferences
- Software and Services in DaaS Contracts
- Software and Services Bundled with New PCs
- Device as a Service (DaaS) Usage Across Different Devices
- Conclusion
Introduction
Device As A Service Statistics: Device-as-a-Service (DaaS) is a way for companies to get their IT devices through leasing or long-term rental instead of buying them. In this model, businesses pay a subscription fee to use equipment such as laptops, desktops, and mobile phones, along with software, maintenance, and full lifecycle support.
By outsourcing device management, companies can enjoy reliable service, reduce downtime with tools like predictive analytics, and turn big one-time hardware costs into manageable operating expenses. With hybrid work and efficiency becoming top priorities, DaaS is increasingly seen as a smart solution to keep devices updated, managed, and ready for employees to stay productive.
Editor’s Choice
- The global market size of the Device-as-a-Service (DaaS) is going to reach around USD 214.5 billion by 2025, as mentioned by scoop.market.us.
- The global Device-as-a-Service (DaaS) market is mainly driven by large enterprises, which account for 65.40% of the market share.
- Accenture leads the industry with a strong 23% share.
- Regionally, North America stands at the top with 35% of the market.
- Usage trends also show differences across device types, with desktop PCs being the most commonly used by 99% of current DaaS users, 91% of planners, and 96% of those without plans.
- Budget and payment flexibility are the main reasons for adoption, noted by 29% of users.
- Additionally, 51% of users bundle productivity suites, compared to 59% of planners intending to do so.
- com further shows that DaaS helps companies cut PC costs by 17%, with small businesses seeing the biggest savings.
- It also lowers IT workloads by up to 16%, again with the strongest impact on small firms.
- By 2025, more than 1 in 3 commercial desktops and nearly 1 in 5 laptops shipped will come through DaaS.
- In addition, 95% of current users say they are satisfied with their DaaS enrollment.
Evolution of Device-as-a-Service (DaaS)
| Year | DaaS Developments |
| 2024 to 2025 |
It expanded beyond IT into electronics, appliances, education, and healthcare. |
|
Late 2020s |
Also gained traction for cost savings, flexibility, and sustainability. |
| Late 2010s to Early 2020s |
Dell, Lenovo expand DaaS; Amazon, Google, Apple blend hardware with subscriptions. |
|
Mid 2010s |
HP launched DaaS, combining hardware, support, and management into one service. |
| Between 2000s and early 2010s |
Companies like Salesforce, Adobe, and Microsoft pushed the growth of SaaS. |
|
Early 2000s |
AWS introduced EC2 and began the trend of “as-a-Service” models. |
Device-as-a-Service Market Statistics
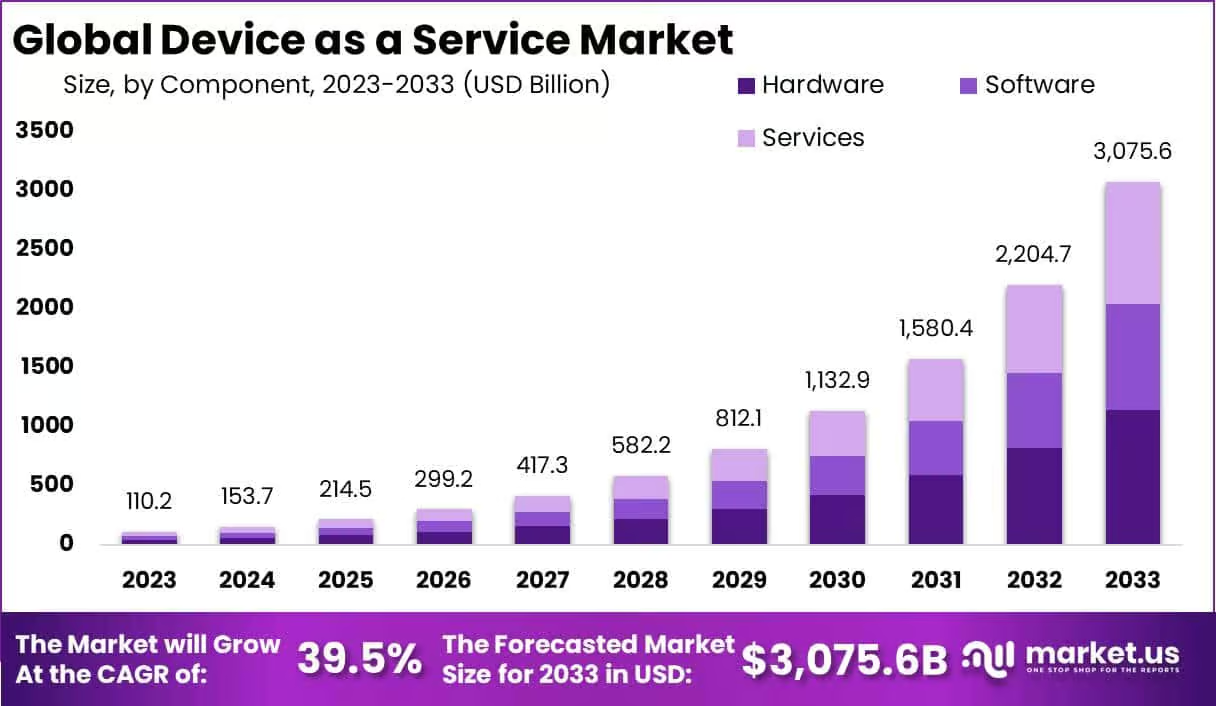
- The Global Device as a Service (DaaS) Market is projected to grow from USD 110.2 Billion in 2023 to USD 3,075.6 Billion by 2033, with a strong CAGR of 39.5% during the forecast period.
- In 2023, North America held the leading position with a 33.2% share and generated USD 36.5 Billion in revenue.
- The Hardware component led the market in 2023 with more than 37.3% share, driven by high demand for advanced devices across industries.
- Desktop devices were the dominant type, capturing over 41.1% share, valued for their strong processing power and enterprise-grade security.
- Large Enterprises accounted for the majority share of 65.4%, as they benefit most from scalable DaaS solutions.
- The IT & Telecommunications sector was the largest end-use industry, holding 21.5% share, due to its constant need for technology upgrades.
- The European market contributed a 28.6% share, followed by the Asia-Pacific region with 23.8% share, showing strong adoption across regions.
- South America held 9.9%, while the Middle East and Africa contributed 8.6% to the market share.
Adoption by Business Size
- Only 0.30% of businesses with fewer than nine employees currently use DaaS, but 19% plan to adopt it.
- Among businesses with 10–19 employees, 6% use DaaS today, while 17% plan to implement it.
- Companies with 20–49 employees show 7% current usage, with 17% planning adoption.
- In organizations with 50–99 employees, 8% already use DaaS, and 19% are considering future adoption.
Market Players and Shares
- Accenture leads the market with a 23% share.
- Acer Inc. and Apple Inc. each hold 9% share.
- Cisco and Cognizant both command 8% share.
- Computacenter has a 7% share.
- Dell Technologies and Intel each account for 6% share.
- Lenovo holds 5%, while Hewlett-Packard has 3% share.
US Device as a Service Market
 (Reference: Precedence Research)
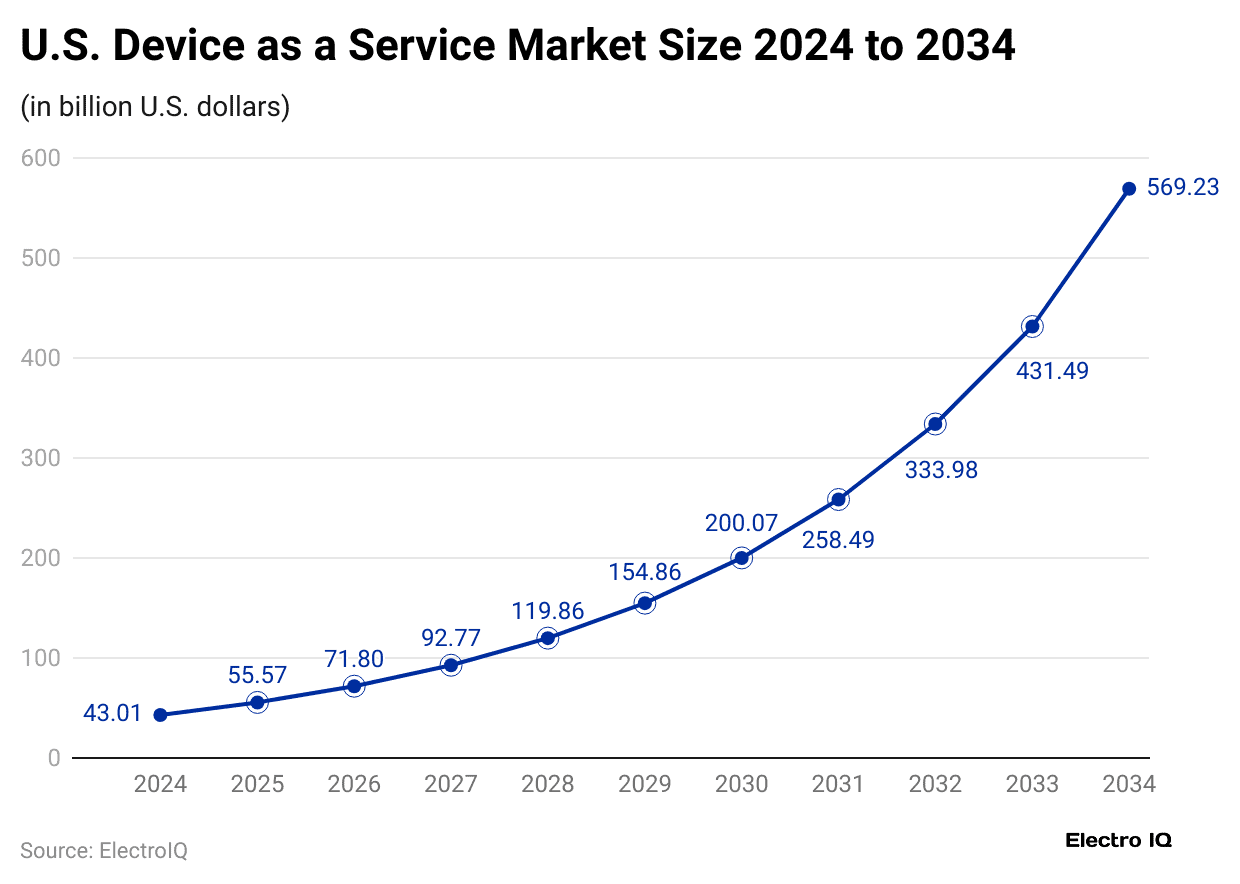
- By 2025, the U.S. device-as-a-service market will be worth around USD 55.57 billion, an increase from USD 43.01 billion in 2024.
- It is forecast to rise to approximately USD 569.23 billion by 2034, with an annual growth rate of 29.47% from 2025 to 2034.
- Furthermore, the market size in the coming years is expected to be USD 71.80 billion in 2026, USD 92.77 billion in 2027, USD 119.68 billion in 2028, USD 154.86 billion in 2029, USD 200.07 billion in 2030, USD 258.49 billion in 2031, USD 333.98 billion in 2032, and USD 431.49 billion in 2033.
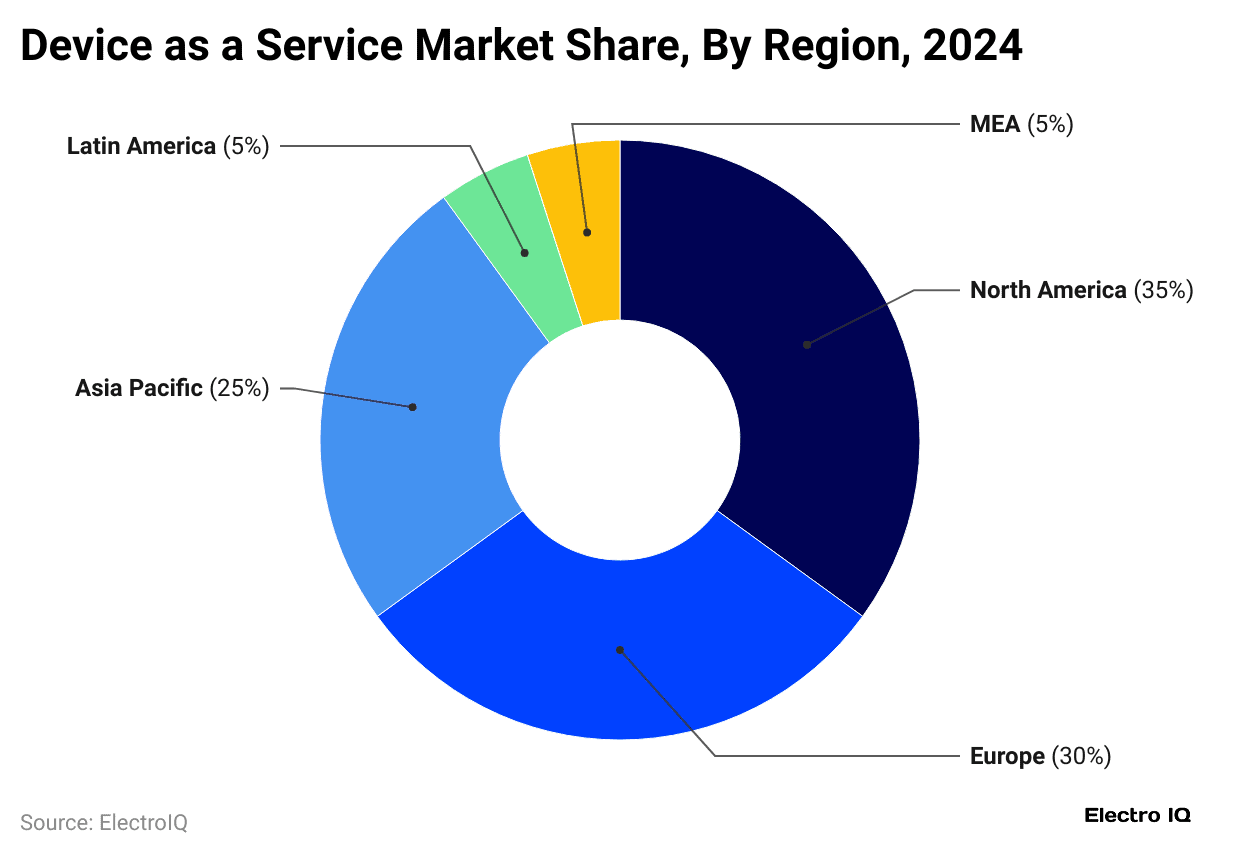
- In 2024, the highest market share in the Device-as-a-Service (DaaS) was secured by North America with a share of 35%, followed by Europe at 30%.
- Furthermore, market shares of Device-as-a-Service in other regions are followed by the Asia-Pacific region, which holds 25%, South America contributed 5% of the market, and the Middle East and Africa together accounted for 5%.
By Enterprise
 (Reference: market.us)
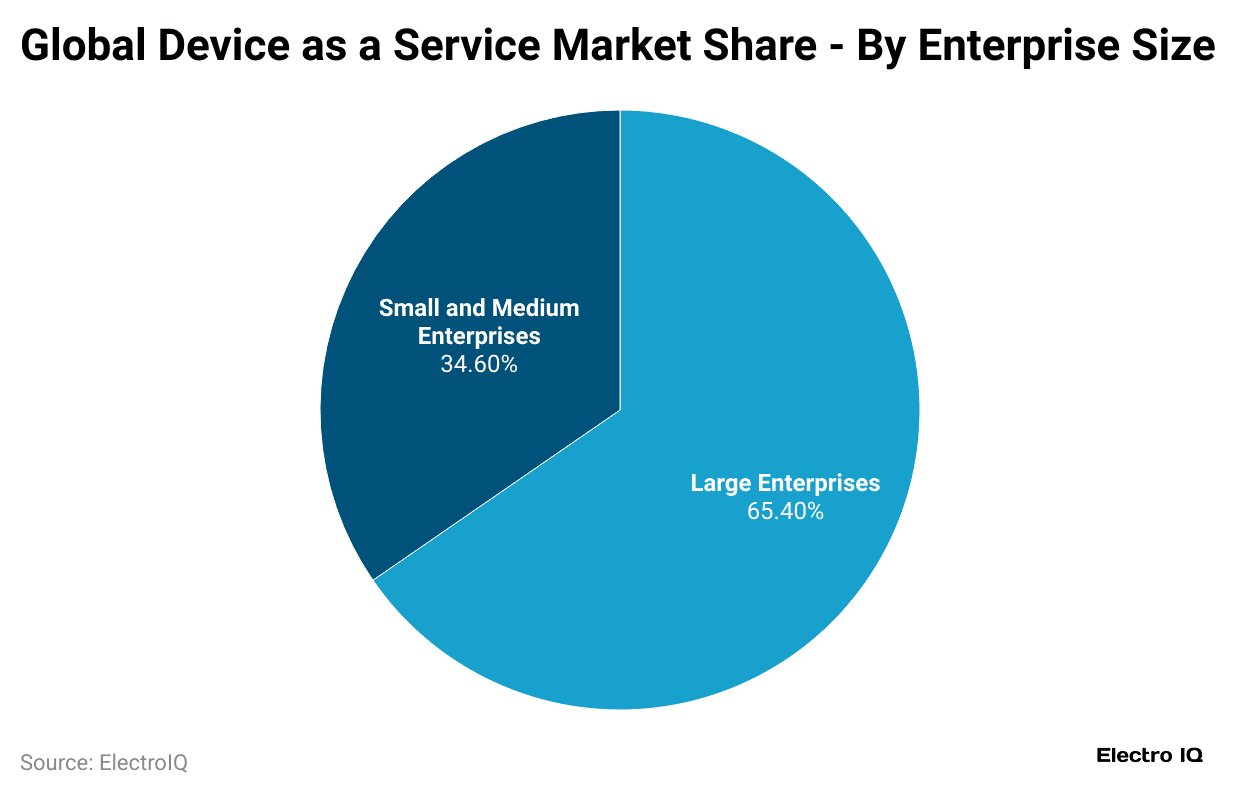
- As of 2024, the large enterprises accounted for the highest share in the global Device-as-a-Service (DaaS) market with 65.40%.
- Meanwhile, small and medium enterprises (SMEs) made up the remaining 34.60%.
By Top Players
- market.us reports that in 2024, Accenture held the biggest share of the Device-as-a-Service (DaaS) market, accounting for 23%.
Furthermore, the market share of the competitive landscape of the global Device-as-a-Service market is stated in the table below:
| Players | Market Share |
| Acer Inc. | 9% |
| Apple Inc. | |
| Cisco | 8% |
| Cognizant | |
| Computacenter | 7% |
| Dell Technologies | 6% |
| Intel Corporation | |
| Lenovo | 5% |
| Hewlett-Packard | 3% |
| Rest Others | 16% |
By Employee Size
- DaaS adoption varies by company size, with under nine employees rarely using 0.3% currently, and 19% planning.
- For companies with 10 to 19 employees, 6% already use DaaS, and 17% plan to start.
- Businesses with 20 to 49 employees see 7% using DaaS now, with another 17% intending to adopt it.
- In larger organisations of 50 to 99 employees, 8% are currently using DaaS, while 19% are planning to implement it in the future.
By Industry
| Industry | Device as a Service Share |
| Manufacturing | 2.10% |
| Professional Services | 1.70% |
| FIRE (Finance, Insurance, and Real Estate) | 1.60% |
| Retail | 1.60% |
| Wholesale | 1.40% |
| AMTUC (Agriculture, Mining, Transportation, Utilities, and Construction) | 1.30% |
| Other Services | 1.60% |
Leading Cloud Infrastructure Service Providers
 (Reference: statista.com)
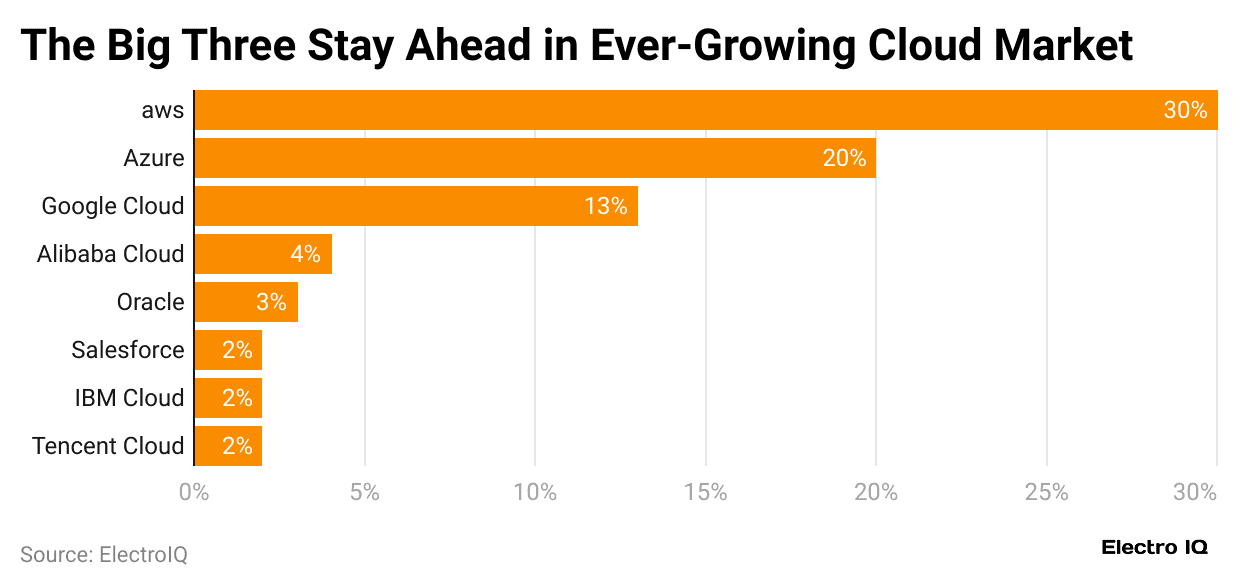
- In Q2 2025, Amazon led cloud infrastructure with 30%, followed by Microsoft Azure at 20% and Google Cloud at 13%.
- Furthermore, the market shares of other leading cloud infrastructure service providers are Alibaba Cloud (4%), Oracle (3%), Salesforce (2%), IBM Cloud (2%), and Talent Cloud (2%).
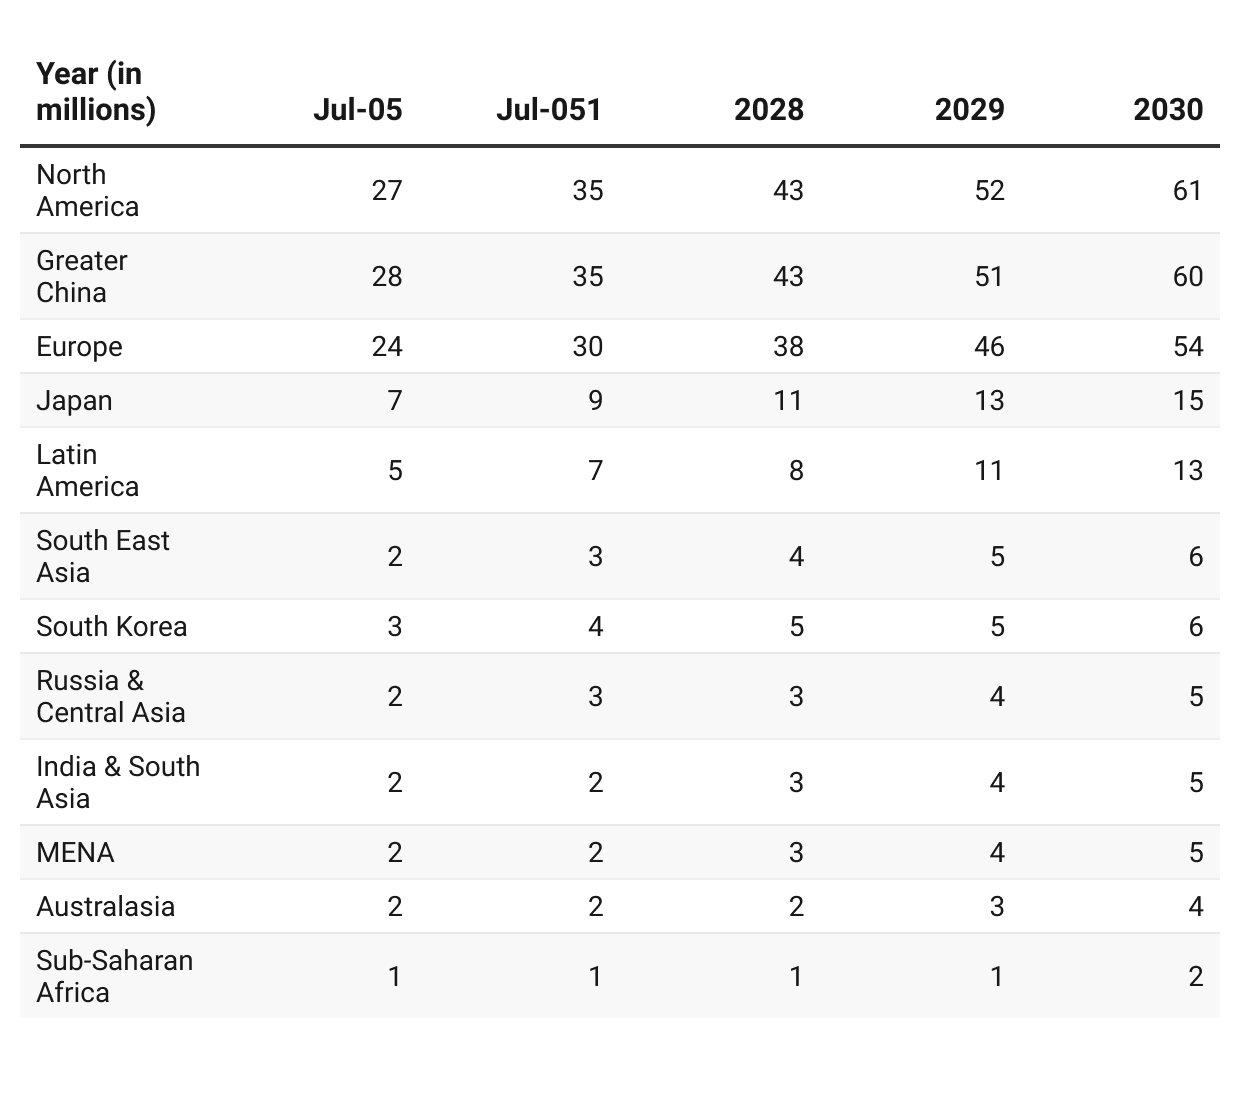
Region-Wise IoT Devices Offered as a Service Statistics by Number of Devices
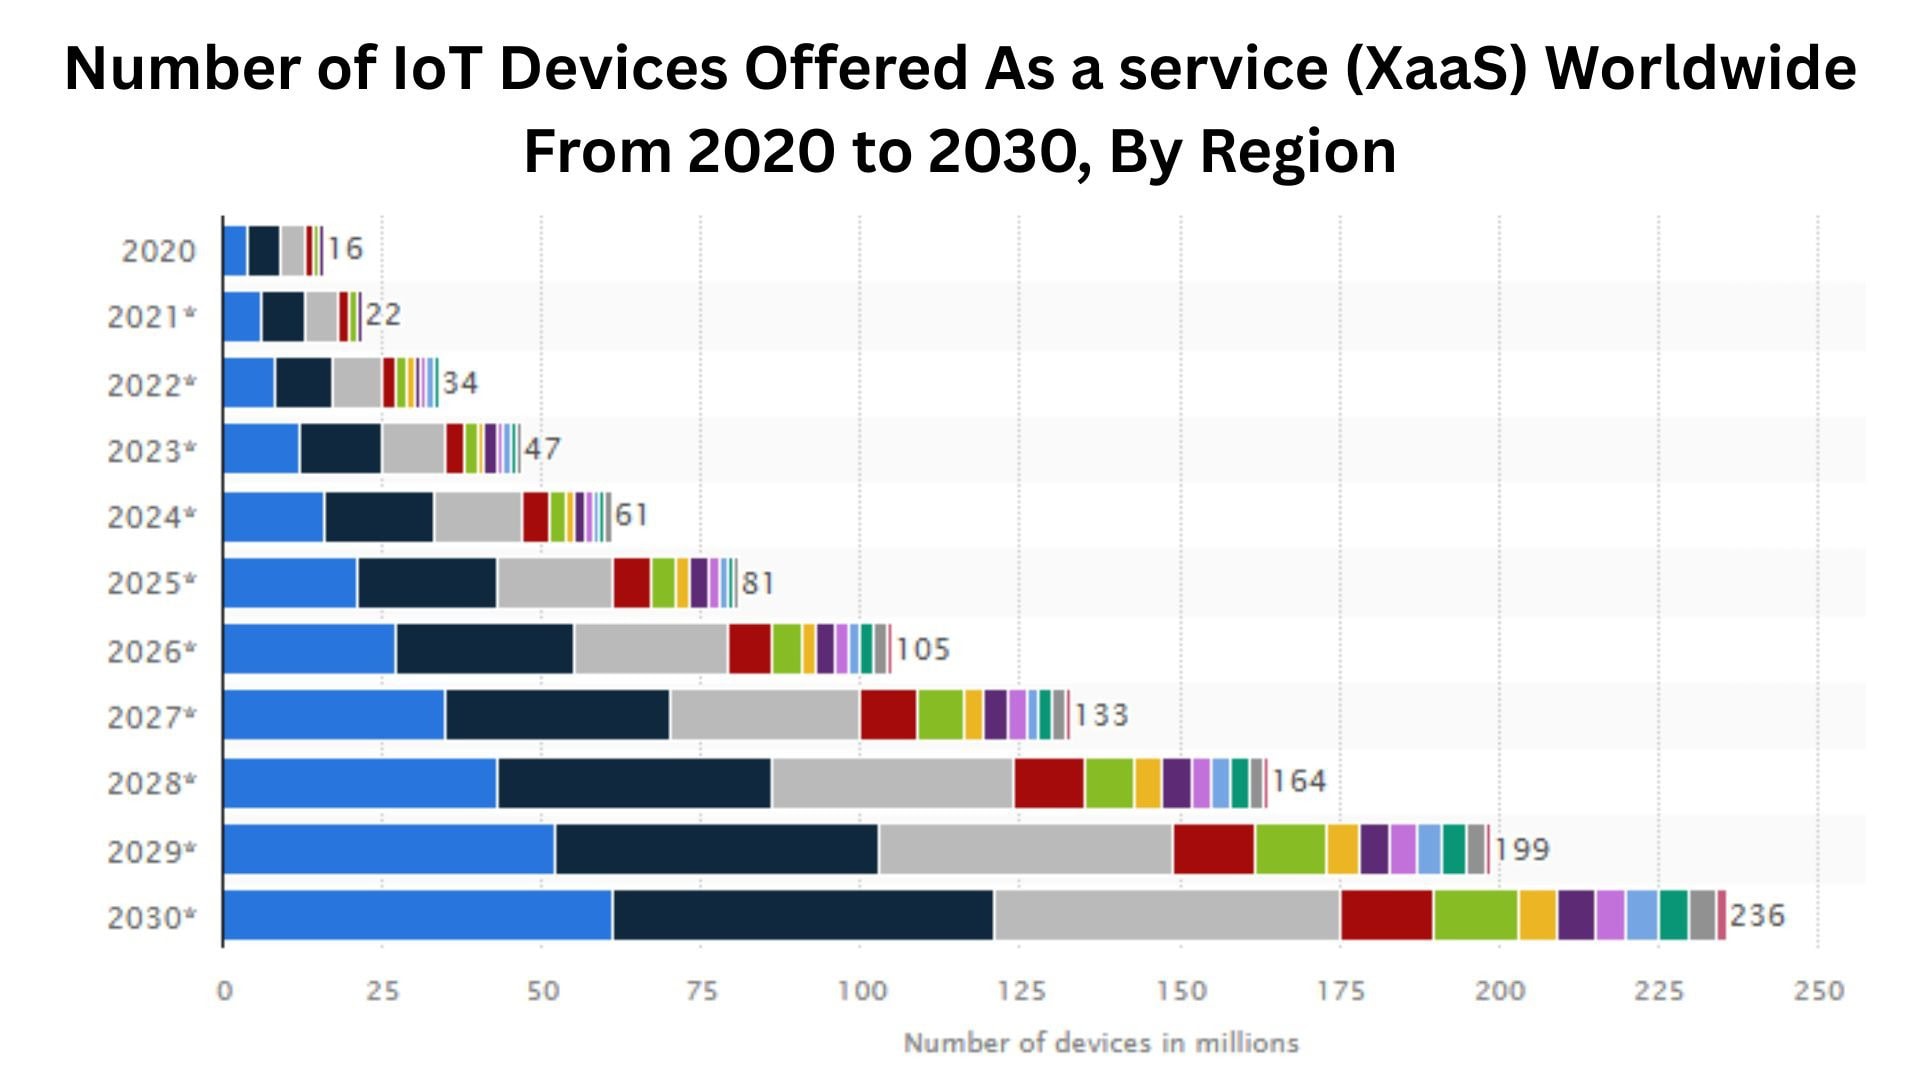
- In 2025, IoT devices offered as a service are expected to reach 22 million in Greater China, 21 million in North America, and 18 million in Europe.
- Japan accounts for 6 million, while Latin America has 4 million. South East Asia records 2 million devices, the same as Russia and Central Asia.
- South Korea contributes 3 million, whereas India and South Asia, along with the MENA region and Australasia, each account for 1 million.
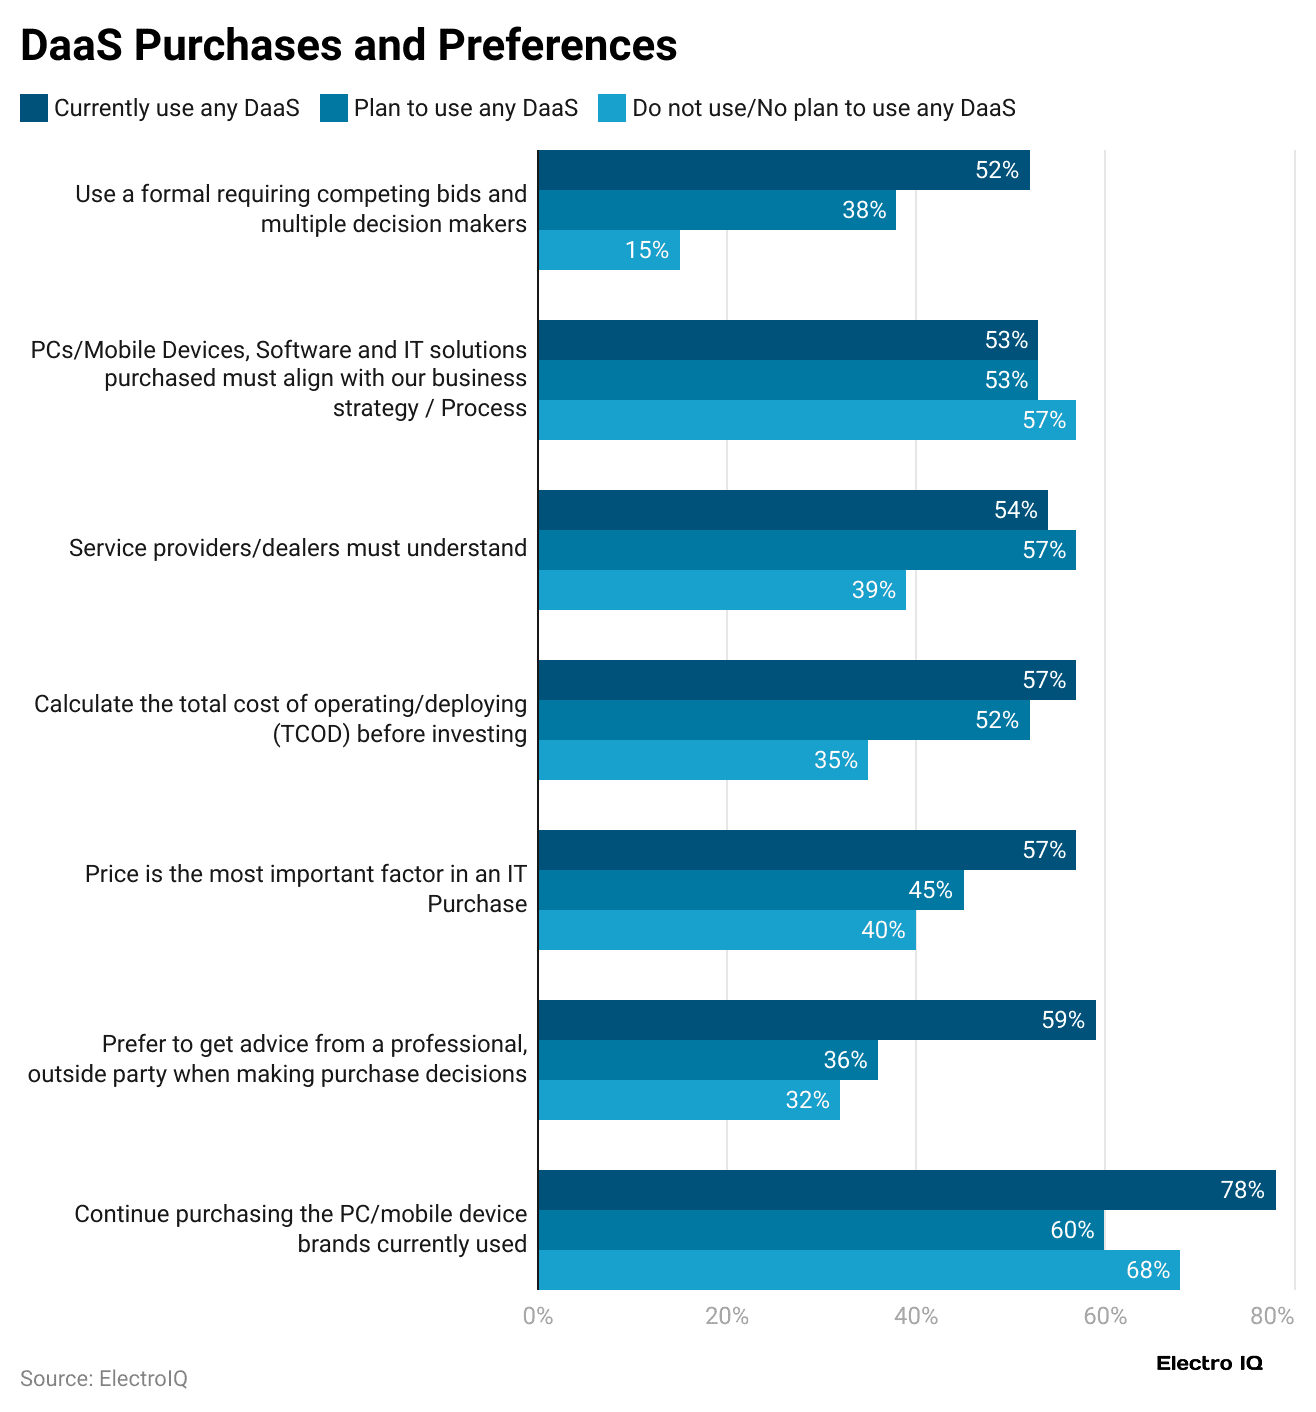
Device-as-a-Service Statistics by Purchases and Preferences
 (Reference: market.us)
- 78% of DaaS users prefer to stick with the same PC and mobile brands they already use.
- A similar trend is seen among 60% of planners and 68% of non-users.
- Professional advice also plays a role: 59% of users rely on outside experts, compared with 36% of planners and 32% of non-users.
- Price strongly influences decisions, with 57% of users, 45% of planners, and 40% of non-users considering it critical.
- Checking the total cost of deployment (TCOD) is important for 57% of users, 52% of planners, and 35% of non-users.
- Business alignment matters too, valued by 54% of users, 57% of planners, and 39% of non-users.
- Formal purchasing processes are followed by 52% of users, 38% of planners, and 15% of non-users.
Software and Services in DaaS Contracts
- In DaaS contracts, 43% of current users include services like installation, configuration, on-site support, and remote monitoring, while 66% of planners plan to add these.
- Productivity software and antivirus software are used by 39% of current users and 27% of planners.
- Meanwhile, 27% of users and 14% of planners include no extra software or services.
Software and Services Bundled with New PCs
| Metrics | DaaS Users | DaaS Planners |
| Productivity suites (hosted or on-premise) | 51% | 59% |
| Online Data Storage | 35% | 27% |
| Business Applications | 32% | 20% |
| Hosted Security | 21% | 26% |
| Hosted Date back-up/Recovery | 16% | 13% |
Device as a Service (DaaS) Usage Across Different Devices
- Desktop PCs show significant engagement with Device as a Service (DaaS), with 99% of organisations currently using them.
- Among these, 91% already utilise DaaS solutions, while 96% of organisations indicate they have no plans to use DaaS for desktop PCs.
| Devices Used | Currently use any DaaS | Plan to use any DaaS | No use of any DaaS |
| All-in-Ones (AIOs) | 24% | 20% | 13% |
| Notebooks | 66% | 68% | 72% |
| Two in Ones | 38% | 29% | 24% |
| Workstations | 24% | 215 | 10% |
Conclusion
After reviewing the Device-as-a-Service (DaaS) statistics, it is clear that the market is shifting the way companies manage their IT devices. DaaS offers affordable, flexible, and simple solutions, giving businesses access to the latest technology without heavy upfront spending. At the same time, it makes device management, security, and maintenance much easier for organisations of all sizes.
Although there are challenges like limited control, reliance on the internet, and long-term contracts, the advantages usually outweigh the drawbacks. As more organisations see these benefits, DaaS is likely to become increasingly popular and an important part of modern digital workplaces.
FAQ.
This works by providing businesses with subscription-based devices with management, support, and security.
Pros: Scalability, cost-effectiveness, customisation, device management, security, long-term cost
Cons: Limited control, internet dependence, contracts, and device selection.
Yes, most providers include built-in security features, regular updates, and compliance measures to keep devices and data protected.

Maitrayee Dey has a background in Electrical Engineering and has worked in various technical roles before transitioning to writing. Specializing in technology and Artificial Intelligence, she has served as an Academic Research Analyst and Freelance Writer, particularly focusing on education and healthcare in Australia. Maitrayee's lifelong passions for writing and painting led her to pursue a full-time writing career. She is also the creator of a cooking YouTube channel, where she shares her culinary adventures. At Smartphone Thoughts, Maitrayee brings her expertise in technology to provide in-depth smartphone reviews and app-related statistics, making complex topics easy to understand for all readers.