Salesforce Statistics By Revenue and Facts (2025)
Updated · Mar 26, 2026

Table of Contents
Introduction
Salesforce Statistics: Salesforce, a well-respected name within the field of cloud-based software services provision, has been thriving throughout its existence. The business, for instance, had extended its services to over 150,000 businesses by 2024, therefore being regarded as a major player in the CRM software sector.
This article covers Salesforce statistics follow-up, which includes its financial performance and market share, product segmentation, regional contribution, as well as strategic plans adopted by the company in 2024, for a more in-depth understanding of where the company is going.
Editor’s Choice
- According to Salesforce statistics, Salesforce is in use by over 150,000 businesses globally, specializing in enhancing marketing as CRM.
- Globally, the enterprise IT software market is on the rise even faster, with its expenditure heading towards USD 856 billion in 2023.
- Salesforce did the SaaS revolution in very early stages by converting its ERM CRM into SaaS, adding several other vertical solutions to its basket for B2B, B2C, and B2B2C users and eliminating the cost of running software on hardware and keeping it updated by integrating cloud, or real-time over Internet applications.
- The company rolled out the Einstein 1 Platform, which combined artificial intelligence, data, CRM, development, and security.
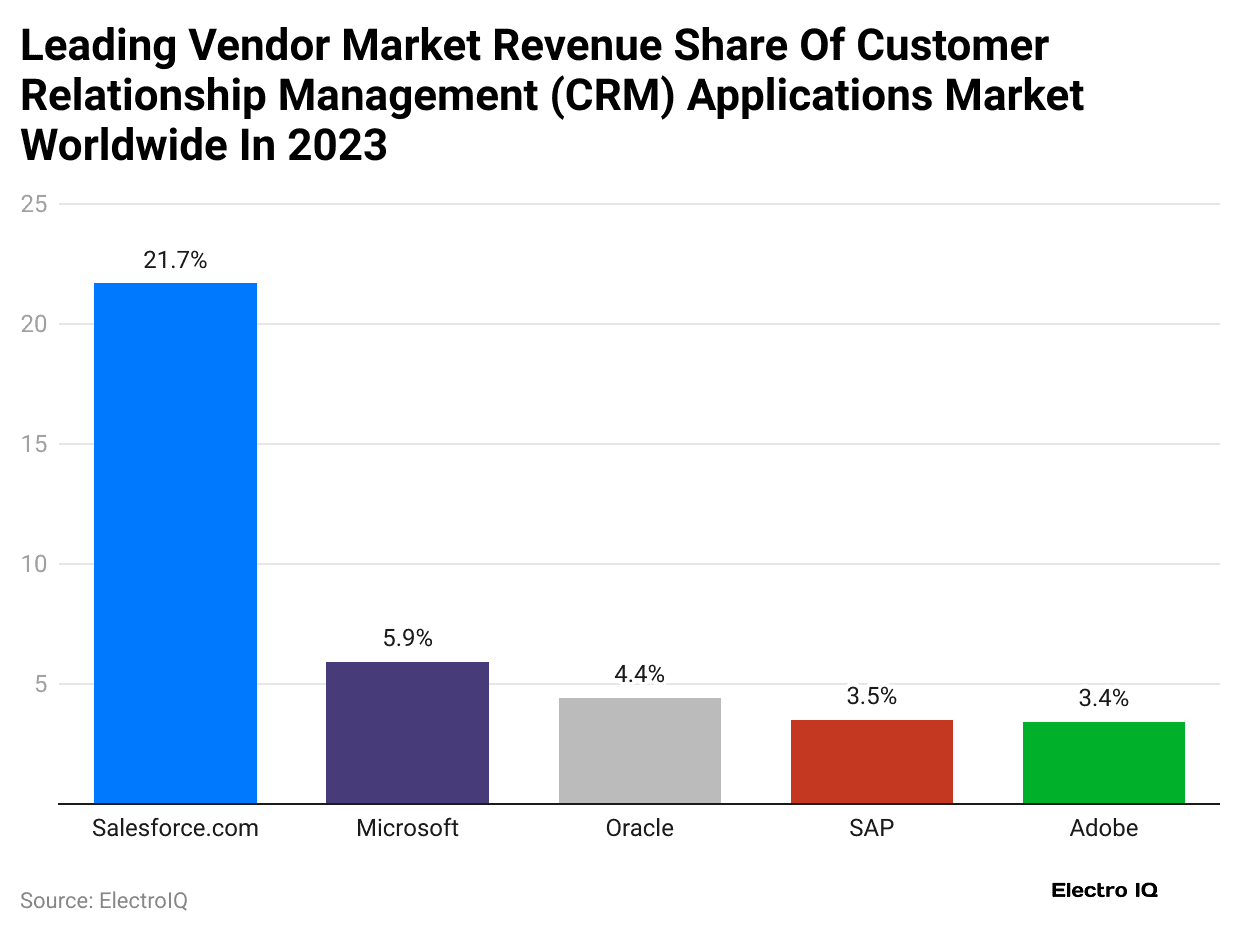
- Salesforce’s global CRM leader market share reaches 21.7%, which is much higher than its competitors like Microsoft (5.9%), Oracle (4.4%), SAP (3.5%), and Adobe (3.4%).
- In 2024, Salesforce achieved a record revenue figure of USD 34.86 billion, which is the latest figure to USD 31.35 billion in 2023, as compared to the record for the year 2022, which stood at USD 26.49 billion.
- There appeared to be some irregularity with the total return index recorded by Salesforce; for instance, it went up from USD 100 in 2019 to USD 185 in 2024 and showed fluctuations, but in the long term, there was always growth.
- The company registered a profit of over USD 4 billion in the 2024 financial year, which was an impressive improvement from USD 126 million in 2020.
- Salesforce CRM finds most of its applications in the professional services, manufacturing, banking, and financial services industries.
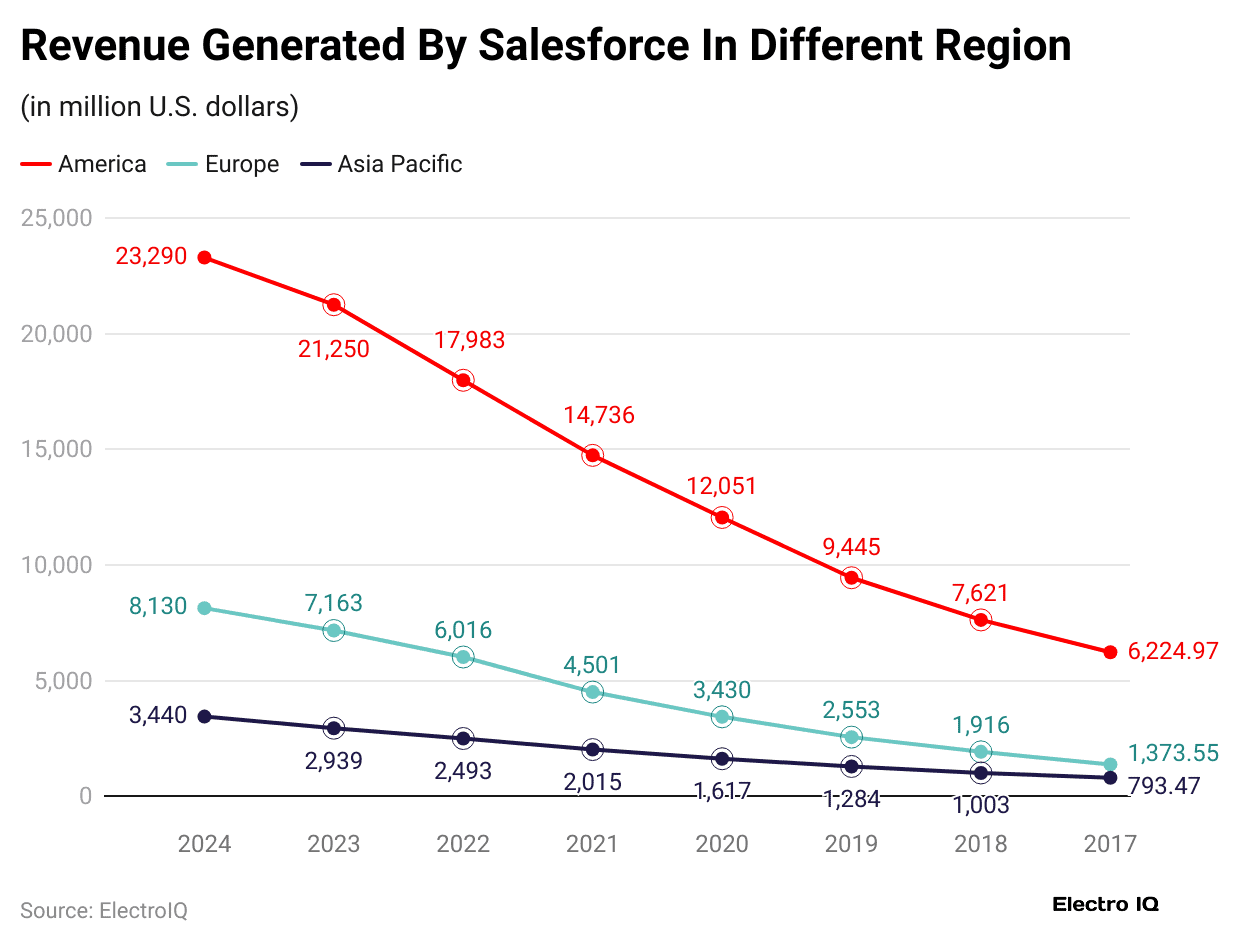
- Geographical revenue distribution forecast for 2024: Americas (USD 23.29 billion), Europe (USD 8.13 billion), and Asia-Pacific (USD 3.44 billion), which all denote a rise across all geographical parameters.
- Product-wise revenue forecast for 2025: The two highest numbers will be for the segments Sales and Services (more than USD 6 billion each), and aside is Platform Services (USD 5.3 billion), Marketing & Commerce (USD 3.9 billion), and further Integration and Analytics (USD 4 billion).
- Subscriptions and maintenance outperformed to obtain USD 32.54 billion in 2024, being worth more than USD 29.02 billion in 2023 and even less than USD 24.66 billion in 2022.
- The capitalization of Salesforce in 2024 grew to USD 252.58 billion, a decrease of 0.84% from 2023’s USD 254.71 billion but still well above the previous record of 92.11% set in 2022.
General Salesforce Statistics
- Salesforce is most famous for making CRM software. It was started in 1999 as a cloud computing and enterprise software company.
- Software is among the fastest-growing areas in the whole enterprise market, with global purchasing predicted to reach USD 856 billion by 2023.
- Salesforce played a significant role in making Software-as-a-Service (SaaS) available to the industry. It offers solutions for B2B, B2C, and B2B2C businesses.
- By focusing on the cloud, customers can direct Salesforce to reduce expensive hardware, servers, and maintenance fees.
- Salesforce, meanwhile, has invested in becoming an AI company and launched the Einstein 1 Platform to merge data, AI, CRM, development, and security all within one system.
- Salesforce CRM services are offered through cloud-based products like Sales Cloud, Service Cloud, Marketing Cloud, Community Cloud, Analytics Cloud, App Cloud, and IoT Cloud.
- These products help businesses achieve smooth operations through the integration of customer interactions and data into one platform.
- Most of Salesforce’s customers fall under different industries like professional services, manufacturing, and banking and financial services.
- In 2013, Salesforce had around 22% of the global CRM market.
- Some of the main competitors for this company include SAP, Oracle, and Microsoft, as well as small companies offering CRM solutions.
- Instead, most smaller businesses prefer different CRM software, which comes with fewer features and a more direct manner compared to Salesforce.
- As CRM technologies evolve and become smarter in assisting businesses in understanding their clients, the demand for CRM software is expected to increase.
- Salesforce trades services alongside Accenture and IBM for the more sophisticated industry-specific solution-engineering process.
Salesforce Revenue
 (Reference: backlinko.com)
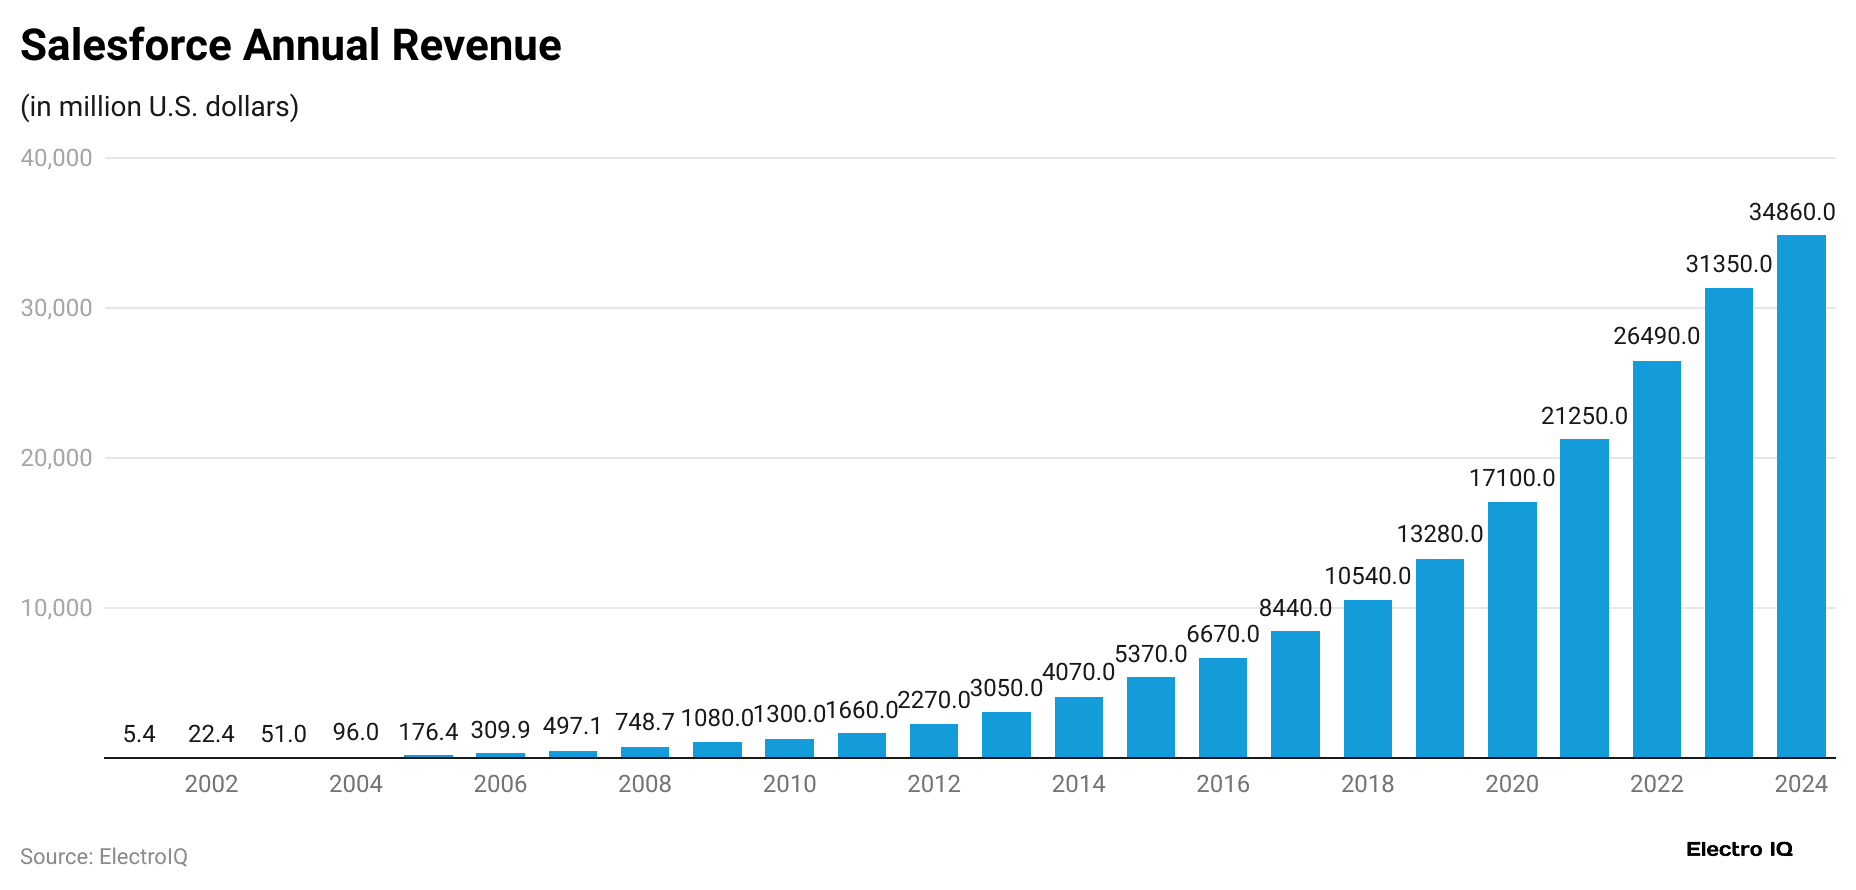
- Salesforce statistics show that in 2024, Salesforce realized a revenue of USD 34.86 billion, up steadily from the previous year’s USD 31.35 billion. It shows the ability of the company to open up new market areas as well as to offer new solutions.
- Such growth has been regular throughout the years for Salesforce, whose revenues had increased to USD 26.49 billion by 2022, crossing USD 21.25 billion in 2021.
- There was an outstanding jump in revenue in 2020, generating over USD 17.1 billion from sales, which improved from USD 13.28 billion in 2019 and over USD 10.54 billion in 2018. This particular time period would be marked as the actual growth period for Salesforce, largely by the efforts of acquisitions and increasing demand for cloud-based CRM solutions.
- From 2015 to 2017, Salesforce’s revenue had increased from USD 5.37 billion to USD 8.44 billion, thus suggesting the continuous heavy presence in the market of the CRM service provider. There was significant growth witnessed from 2010 to 2014 as its sales turnover amounted to USD 1.3 billion in 2010 and (eventually) to USD 4.07 billion by the end of 2014.
- In 2009, the USD 748.7 million in revenue in 2008 jumped to USD 1 billion due to notable year-on-year growth. Growth in prior years included USD 497.1 million in 2007 and only USD 309.86 million in 2006.
- The early 2000s indicated rapid growth by moving from USD 5.43 million in 2001 to USD 96.02 million in 2004, and over USD 176.37 million in 2005.
- Thus, the Salesforce revenue story introduces a very long-term growth trend: from a modest USD 5.43 million in 2001, it grew to nearly USD 35 billion in 2024. This story is an example of its ability to control the CRM market and adjust, innovate, and invent business solutions for every world business need.
Salesforce Total Return
 (Source: q4cdn.com)
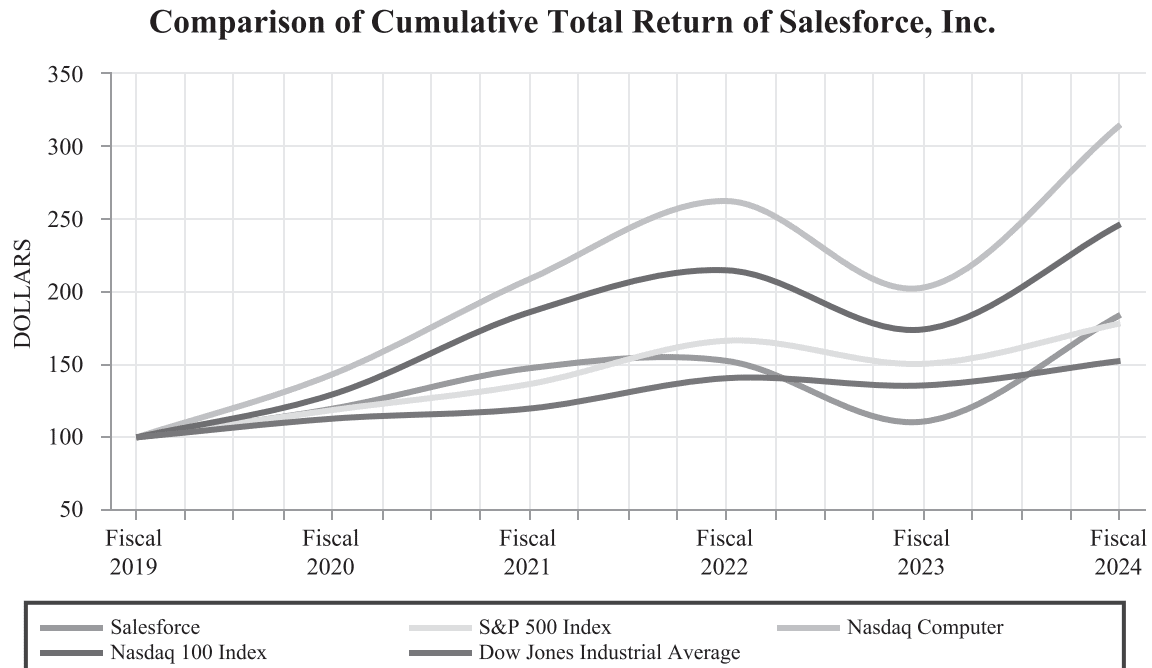
- The information regarding Salesforce statistics is supplied for the case study in which the assets return of Salesforce, Inc., versus the major market indices for the six years covering the period from January 31, 2019, to January 31, 2024, with the base value being USD 100, refers to a benchmark timeframe when return on investment fluctuates, indicating the change in investment.
- The general picture was that Google’s total return increased from USD 100 in 2019 to USD 185 in 2024. In 20 years, 2022, it was clear that the company’s performance was quite progressive as it reached USD 153 until the onset of USD 2023, where it then tumbled to USD 111. However, there was an upward trend in 2024, which was as high as it had ever been.
- The S&P 500 Index began at USD 100 in the year 2019, and it progressed to USD 119 in the year 2020, USD 137 in the year 2021, and registered its highest value at the point of USD 167 in 2022. It then dipped slightly to USD 151 in 2023 but rose to USD 179 in 2024.
- The Nasdaq Computer Index seemed to outpace the other indices in terms of growth, starting at USD 100 in 2019 and taking off to USD 144 in 2020, USD 210 in 2021, and USD 264 in 2022.
- After a sharp fall in 2023, it was USD 204; the value increased back up to a very impressive USD 317 in 2024.
- The Nasdaq 100 Index experienced significant growth as well. It appreciated from USD 100 during 2019 to USD 130 during 2020, then USD 187 during 2021, and peaked at USD 216 in 2022, finally it declined to USD 175 during 2023 but rose to USD 248 during 2024.
- The performance of the Dow Jones Industrial Average was the most stable in growth, experiencing an increase from USD 100 in 2019 to USD 113 in 2020 to USD 120 in 2021 and USD 141 in 2022. It even dipped back to USD 136 in 2023 before climbing to USD 153 during 2024.
- The performance of Salesforce has been, on the contrary, more dynamic as over the passage of time, there were several huge jumps followed by a downturn in 2023, and in 2024 again there was a strong jump.
- It is important to note that it has surpassed the performance of the S&P 500 and Dow Jones Industrial Average but trails behind the Nasdaq Composite and the Nasdaq 100, which have exhibited more robust growth in recent years.
Salesforce Net Income
 (Reference: statista.com)
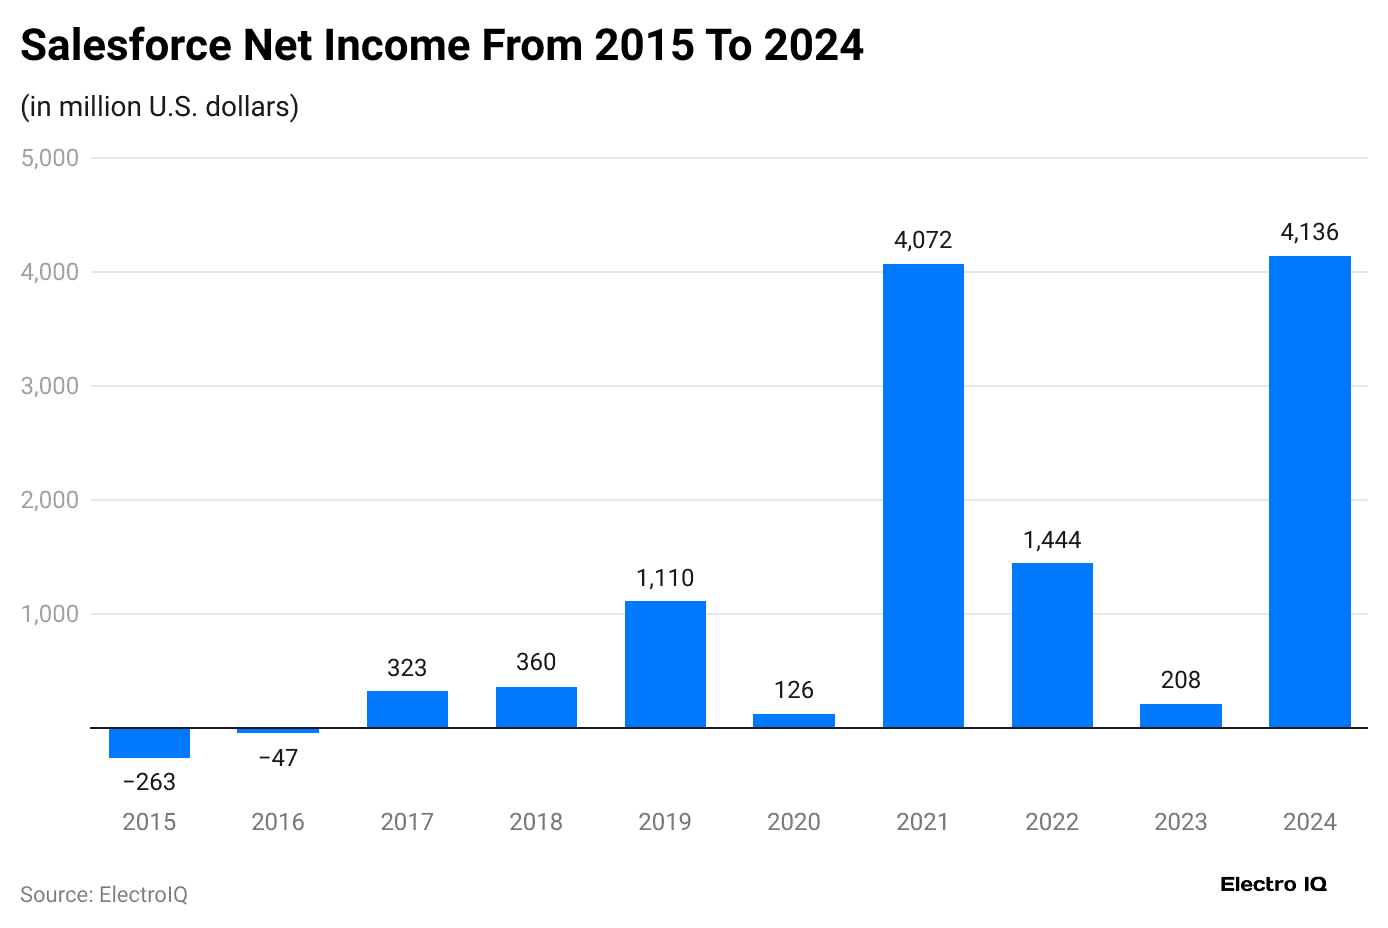
- According to Salesforce statistics, in the year 2024, Salesforce declared a profit amounting to over USD 4 billion.
- Definitely a huge amount of profit, but it was not the same figure as the year before, thankfully, due to changes in premium cost.
- However, there was still a significant increase in its profits in comparison to the company’s financial year of 2020, which recorded USD 126 million in net profit.
- This is evidenced by the fact that despite the decrease in Salesforce’s net earnings relative to the previous year, the company’s overall profitability stood strong in the long run.
Salesforce Customer CRM Worldwide
 (Reference: statista.com)
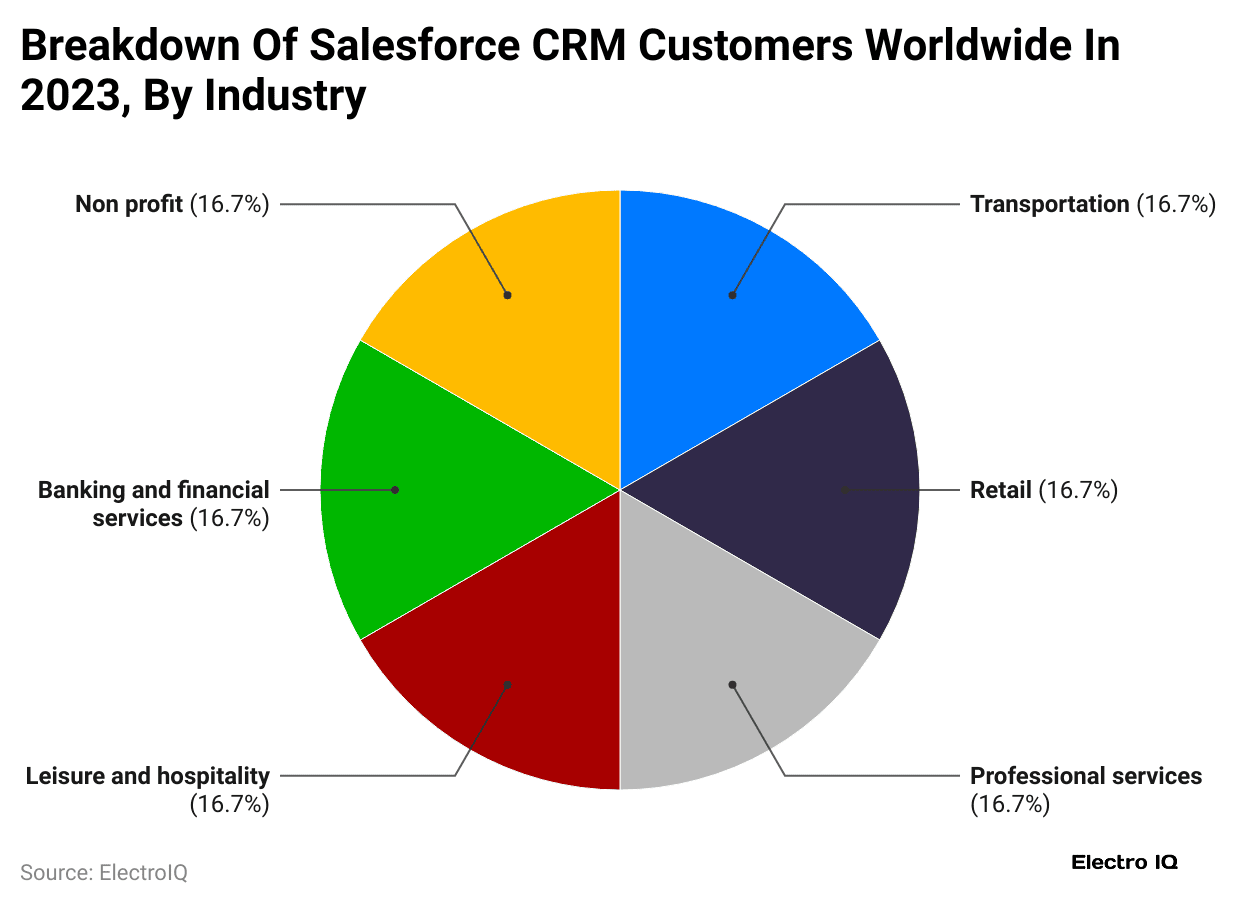
- This CRM of Customer Salesforce is used across different industries across the globe. Take, for instance, 16.7%. This is the share of non-profit organizations that state Salesforce as being instrumental in supporting mission-driven initiatives.
- That percentage is a little similar to the banking and financial services industry as well, with 16.7% using the solution because of the tighter regulations governing customer relationship management and compliance.
- Transportation is next, with 162.67%. This is the best single-well role of the CRM in logistics and fleet management for customer engagements.
- Retail ties some 16.7% of Salesforce users to CRM data management, personalized marketing, and omnichannel selling.
- The field of recreation and leisure activities comes in at 162 or 7%, and that signifies customer management touch points, distributed and managed through CRM-loyalty programs, and operational efficiencies.
- Yet overall, it is professional services that accounted for 16.7%.
 (Reference: weblineindia.com)
- Salesforce statistics reveal that in the global CRM (customer relationship management) market, Salesforce is far ahead with its nearly 21.7% of the market, while all other CRM in this sector hardly contain 10% market share.
- When it comes to ratios, Microsoft, which stands second, holds only 5.9%, which makes the difference between Salesforce and other key players very conspicuous.
- More companies like Oracle also follow with a figure of 4.4%, tied with nearly 3.5% from SAP. Still in the CRM space, Adobe takes only 3.4% of the market share.
- All these firms capture much of the CRM activity, but Salesforce’s share is more than the rest of the top 4 competitors combined.
- This strong position underscores the continual expansion of Salesforce, the satisfaction of users as well as technological improvements, all of which together reinforce the stronghold Salesforce has in the CRM sector.
Salesforce Revenue by Product
- In the same year, Salesforce’s principles revolved around sales and service.
- As per Salesforce statistics from Q3 FY25, the sales services in this category – Sales Cloud internal revenue service, otherwise called other sales solutions, amounted to USD 6.19 billion.
- Slightly more fell within the customer support services income category – Service Cloud and related products in their offerings, reporting between USD 6.2 billion give or take.
- There was also an undisclosed figure realised from gizmos like the platform and any others, USD 5.3 billion.
- More so, marketing and similar services, such as Commerce Cloud, Consumer Goods Cloud, and Marketing Cloud, equally contributed more than half of these revenues, valued at USD 3.9 billion.
- Whereas the remaining money, USD 4 billion, was earned from Integration and analytics platforms like MuleSoft and Tableau.
- Such findings draw attention to the increased variability in the product range, with every division contributing towards the overall financial performance.
Salesforce Revenue By Segment
 (Reference: demandsage.com)
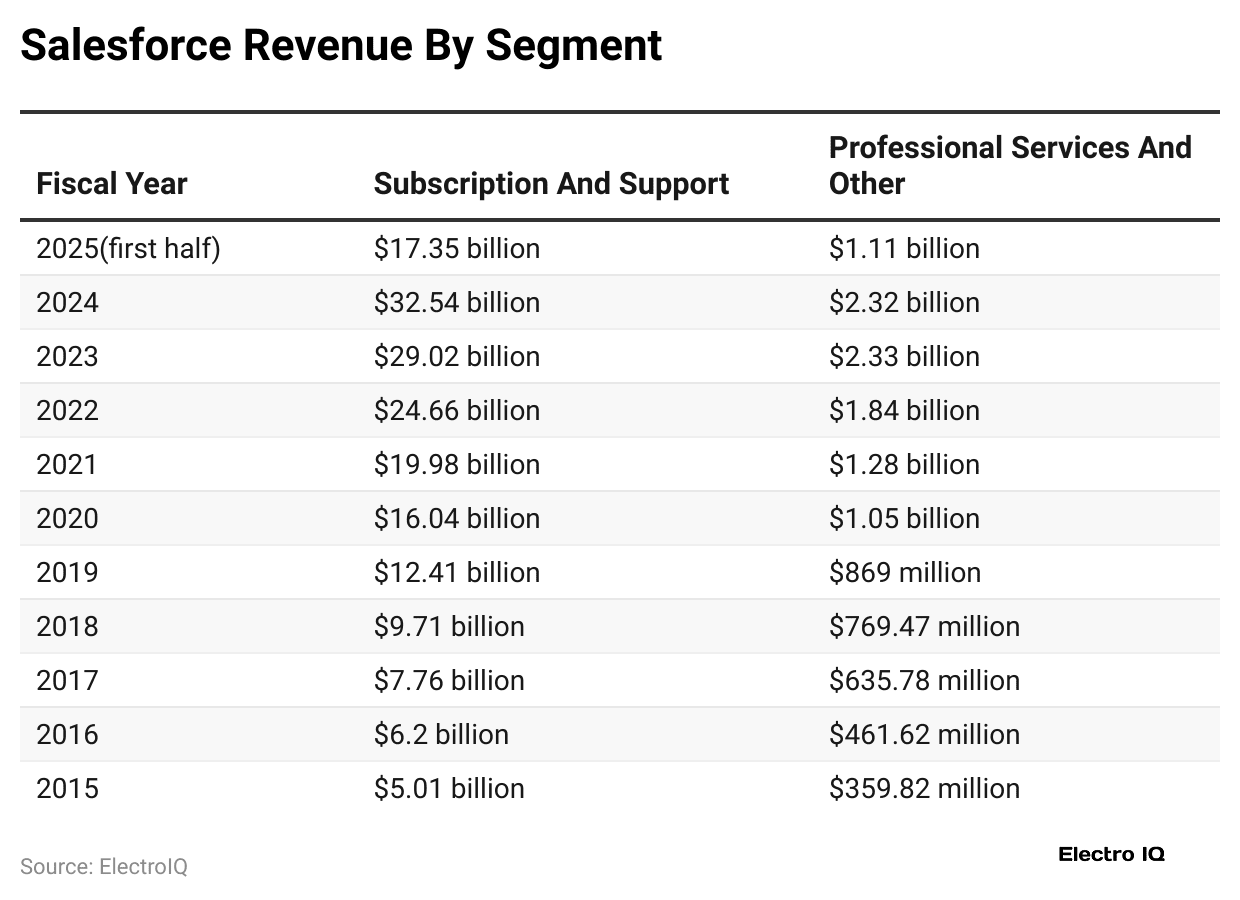
- According to Salesforce statistics, Revenue for Salesforce has grown, both with subscription and support services, but also professional services and other segments.
- A growth rate in revenue was recorded for the first 6 months of fiscal year 2025, which was registered at USD 17.35 billion and USD 1.11 billion from subscription and support services, and professional services, respectively.
- A review of the 2024 year in perspective of the full year found that the revenue of the company had increased with subscription and support services, making USD 32.54 billion and USD 2.32 billion from professional services. This underlines one of the key previous trends, that the subscription and support revenues have been increasing each year.
- In the year preceding fiscal year 2022, these revenues were recorded as USD 19.98 billion, which had gone up from USD 24.66 billion in 2022 to stand at USD 29.02 billion in 2023.
- In this respect, as an illustration, in 2024, the net sales were flat at USD 1.32 billion, even though in 2023 it was close to USD 2.33 billion.
- Salesforce statistics state that the growth was higher as the revenues were 1.84 billion in 2022, 1.28 billion in 2021, and 1.05 billion in 2020. But ten years ago, in 2015, the revenue collection from professional services and other sources was just at USD 359.82 million, which was extremely high compared to the times back four decades to the last years.
- Conclusively, the overlay of Salesforce’s revenue trajectory in the form of a timeline shows the domination of the company in the market and its future hopeful trajectory.
- The company’s success in recent years is largely attributed to the use of subscription-based business models, which allow for stable financial performance.
- By contrast, there has also been a similar performance by way of professional services and other segments towards boosting the overall revenue of the company.
Salesforce Statistics By Region
 (Reference: demandsage.com)
- Recent Salesforce statistics relating to the company’s income pertain to revenue generation in different geographical regions, which have registered consistent growth in the past fiscal years.
- In the year 2024, the Americas region registered the highest revenue generated, standing at USD 23.29 billion aggregate, followed by the Europe region with USD 8.13 billion, and the Asia-Pacific region with the least at USD 3.44 billion.
- The reason why this rise in the Americas could be significant to Salesforce is the huge volumes of its clients from this region.
- Comparing annual figures to what had been before, the Americas have registered an impressive recovery, having increased from USD 6.22 billion in 2017 to over USD 23 billion in 2024.
- Thus, the steep rise in revenue signifies that Salesforce has attracted new clients and expanded its products in that region. The same is also evident in the European region, where the revenue has grown from USD 1.37 billion in 2017 to USD 8.13 billion in 2024.
- The same increase can be observed in the Asia Pacific region, which, being the least revenue earner, grew by USD 793 million in 2017 to USD 3.44 billion in 2024.
- Taking further data regarding the annual changes into account, it can be said that all regions, especially the Asia-Pacific, have the highest rates of revenue.
- Among all years of analysis, in 2020, America’s Salesforce revenue was USD 12.05b, and it increased to USD 14.73b in 2021, USD 17.98b in 2022, and USD 21b in 2023.
- In 2020, the European market was worth USD 3.43 billion, and by 2024, the figure was in excess of USD 8 billion. The APAC market is booming, and it will grow from USD 1.61 billion to USD 3.44 billion from 2020 to 2024.
Salesforce Valuation
- According to Salesforce statistics, in 2024, Salesforce was likely to reach a market capitalisation of around USD 450.95 billion, a marginal increase from the preceding year.
- The company had even reached a record in 2023 with a staggering rise in share price up to USD 4.66 billion or 109.81 percent more than 2022.
- It was flattish growth against the -2.91% of 2022, which took the company’s market cap down to USD 111.74 billion, but for the economic environment getting a little unfavourable, markets gyrating, and all. In 2021, Salesforce’s market value increased by 11.55%, closing the 2020 brackets at USD 422.58 billion.
- The same year, 2020, showed excellent performance, where the market capitalisation reached 328.91 billion dollars, an increase of 28.89%, in contrast to the total sum of 255.0 billion from 2019.
- An increase of 20.40 was observed in 2019, where the market cap came to USD 206.2 billion.
- The rise is also reported in the previous years, with 41.0% posted in 2018 (USD 152.5 billion) and the largest increase found in the highest version of 2017, which is a 65.9% leap (USD 91.3 billion) from the preceding year to USD 197.2 billion.
- The more recent of these dates would demonstrate an increasing and decreasing period while analysing the poorer rates against previous data, as it shows a growing cycle before disturbances promoted by fiscal constraints or exogenous event forces and increases.
Conclusion
Salesforce statistics revealed that Salesforce’s end-of-year performance is key to its existence as a competitive and rival company at stake. Its revenue diversification, high correlation to the market, and redevelopment in AI and in foreign markets are strengths for the emerging company to spur fast growth in its operations.
There will be distant and worrisome challenges, such as poor implementation of new technologies and external economic situations that will still be present, but that are much better than before, which obviously allows the company to commendably counter its performance in the future.
FAQ.
The cloud computing company shows a massive 21.7% bite off the global CRM cake, leaving the most significant competitors like Microsoft (5.9%), Oracle (4.4%), SAP (3.5%), and Adobe (3.4%) way behind. In turn, the high position is a reflection of its pioneering presence in the industry.
Salesforce supposedly netted a good US$34.86 billion for October 2024, starting from US$31.35 billion as of 2023 and from US$26.49 billion as of 2022, effectively surpassing the phenomenal growth experienced in the market and the demand generated for the product.
Indeed, significant penetration has been achieved by Salesforce’s CRM applications within the professional services, manufacturing, banking, and financial sector industries. These industries rely on Salesforce’s cloud services in order to manage customer interaction, streamline operations, and strengthen relations with customers.
In 2024, Salesforce has a market capitalisation of US$252.58 Billion with just a slight drop of 0.84% from a value of US$254.71 Billion for 2023. However, on a trend forecast to grow nearly double from 2022, it does maintain solid growth.
That Salesforce’s revenue is widely generated from Sales Cloud (US$6.19 billion), Service Cloud (US$6.2 billion), Platform services (US$5.3 billion), Marketing & Commerce (US$3.9 billion), and Integration & Analytics (US$4 billion). Subscription and support services have been the brightest star for the company generating revenues worth US$32.54 billion in 2024.

Joseph D'Souza founded ElectroIQ in 2010 as a personal project to share his insights and experiences with tech gadgets. Over time, it has grown into a well-regarded tech blog, known for its in-depth technology trends, smartphone reviews and app-related statistics.