Digital Payment Adoption Statistics By Usage and Trends (2025)
Updated · Sep 13, 2025

Table of Contents
- Introduction
- Editor’s Choice
- General Digital Payment Adoption Statistics
- Digital Payment Market Statistics
- Digital Payment Market Share Statistics by Region
- United States Digital Payment Market Statistics
- Digital Payment Usage Statistics by Population
- Digital Payment Adoption Statistics in Different Industries
- Popular Methods of Digital Payment Adoption Statistics
- Digital Payment Transaction Statistics by Platforms
- Digital Payment Transaction Valuation Statistics by Top 5 Countries
- By Region
- Payment Methods for In-Person and Online Shopping
- Reasons for Adopting Digital Payment Statistics
- Comparison of Digital Payment Adoption Statistics by Region and Category (2023 to 2024)
- Key Barriers to Digital Payment Adoption
- Conclusion
Introduction
Digital Payment Adoption Statistics: Digital payments have become a normal part of everyday life, changing the way people and businesses pay and receive money. Mobile wallets, UPI, contactless cards, and buy-now-pay-later services are now widely used because they are quick, secure, and easy.
The growth of smartphones, support from governments promoting cashless economies, and new fintech solutions have all played a big role in this shift. By 2025, digital payments will no longer be limited to big cities but will be spreading quickly in smaller towns and rural areas as well. This article shares important statistics on adoption, growth, usage trends, and key drivers.
Editor’s Choice
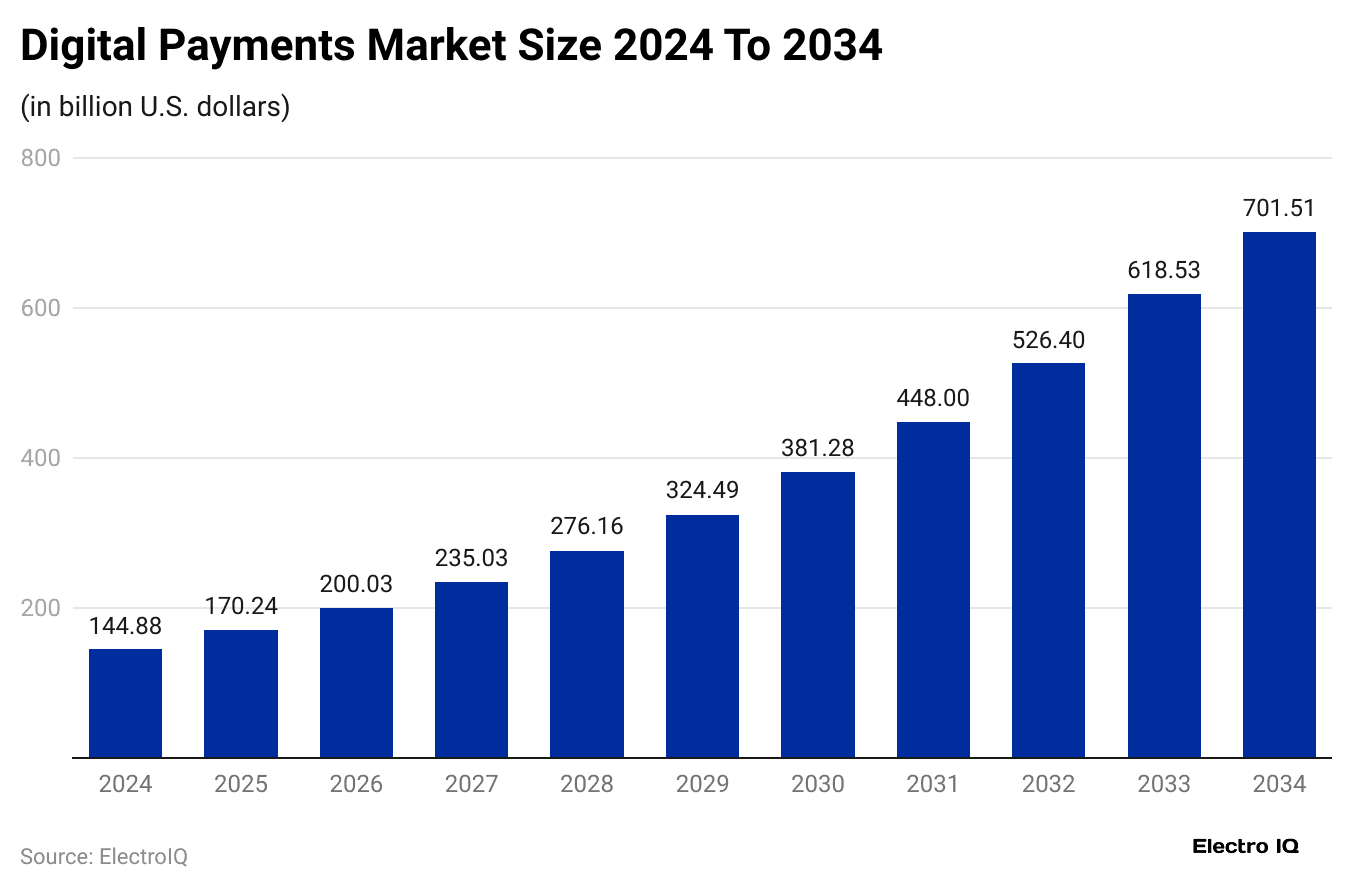
- According to Precedence Research, by the end of 2025, the global digital payment market size will reach USD 170.24 billion and is estimated to reach about USD 701.51 billion by the end of 2034.
- As of 2024, North America led the digital payments market, contributing close to 36% of the overall revenue.
- Among different offerings, payment processing was the most significant, holding a 25.8% share.
- By transaction method, point-of-sale payments took the top spot, making up 53% of the market.
- On the deployment front, most revenues came from on-premise systems, which accounted for 65.4%.
- Large organisations had a strong influence as well, representing 59.6% of the total.
- In contrast, the BFSI sector generated around 24% of the market’s value in 2024
- magecomp.com also shows that in February 2025, Kenya had the highest use of digital payments, with 80% of its population relying on them.
- The adoption of digital payments in digital remittances leads with 75%, followed by peer-to-peer transfers at 71% and subscription service payments at 70%.
- The adoption of digital payments in digital remittances leads with 75%, followed by peer-to-peer transfers at 71% and subscription service payments at 70%.
- As of 2024, there are different payment options available globally, in which India’s UPI dominates the market with a share of 83% all digital transactions.
- A Statista report analysis further shows that the total valuation of the digital payment transaction market is forecast to reach around USD 9.28 trillion by 2025.
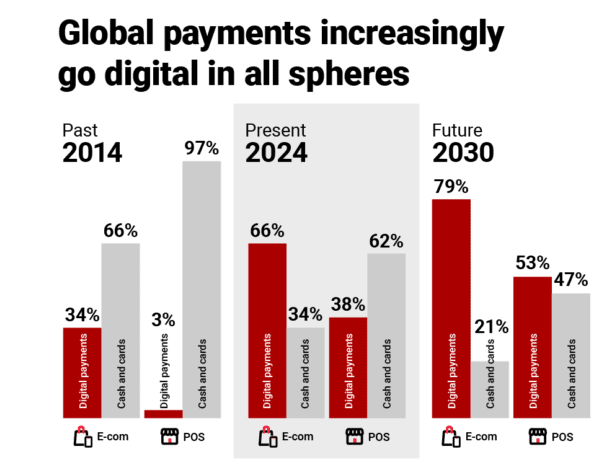
- In e-commerce, digital payments are projected to rise from 66% in 2024 to 79% in 2030, while cash and cards decline from 34% to 21%, as mentioned in thefinancialbrand.com.
General Digital Payment Adoption Statistics
- As mentioned in the Mage Comp report analysis in 2024, digital payment methods continued to expand across industries and everyday transactions.
- Mobile payments made up 35% of all digital transactions worldwide.
- Digital wallets became the top choice for online shopping, accounting for half of all purchases.
- Peer-to-peer services also gained traction, with usage rising by 30% and attracting more than 500 million users globally.
- QR code payments grew by 40%, crossing the 1 billion user mark.
- In physical stores, nearly 45% of purchases were completed through contactless payments.
- E-commerce saw digital methods cover 60% of transactions, up 10% from the year before.
- Around 70% of subscription bills were paid using digital methods.
- Moreover, 50% of the payments were completed through digital channels, while the travel and hospitality industry saw 40% of transactions made digitally.
- The use of digital payment has increased in the healthcare sector by 30% in 2024, an increase of 15% from last year.
 (Source: thefinancialbrand.com)
- In e-commerce, digital payments are projected to rise from 66% in 2024 to 79% in 2030, while cash and cards decline from 34% to 21%.
- For point-of-sale (POS) transactions, digital payments are anticipated to increase from 38% in 2024 to 53% in 2030 and with cash and cards falling from 62% to 47%.
Digital Payment Market Statistics
 (Reference: precedenceresearch.com)
- By the end of 2025, the global digital payment market will reach USD 170.24 billion and is estimated to reach about USD 701.51 billion by the end of 2034.
- Meanwhile, it will grow at a compound annual growth rate (CAGR) of 17.09% between 2025 and 2034.
- The estimated market size of the platform will be USD 200.03 billion in 2026, followed by USD 235.03 billion in 2027, USD 276.16 billion in 2028, USD 324.49 billion in 2029, USD 381.28 billion in 2030, USD 448 billion in 2031, USD 526.40 billion in 2032, and USD 618.53 billion in 2033.
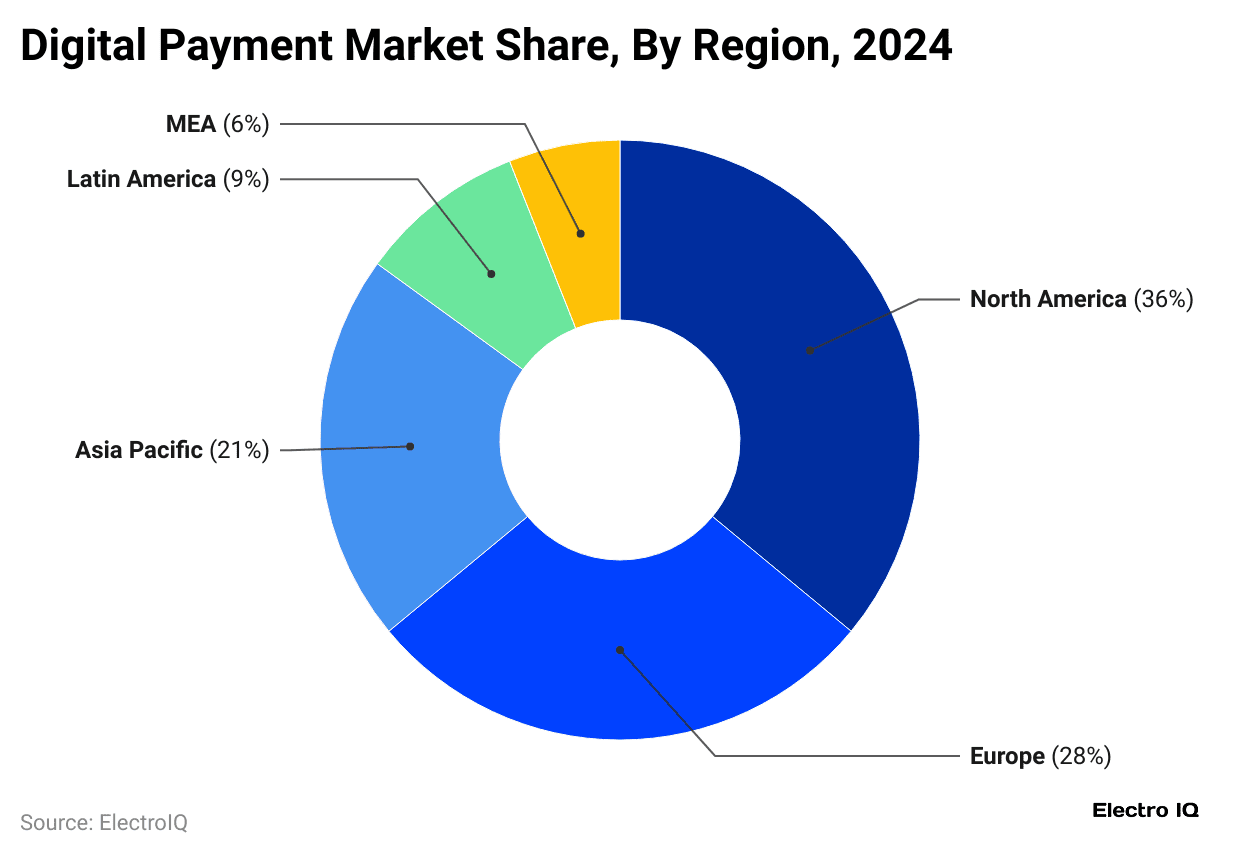
- The above pie chart also reported that in 2024, the North American region led the digital payment market with the highest share of 36%.
- Meanwhile, Europe followed with 28%, and the Asia Pacific region accounted for 21%.
- Others are followed as Latin America 9% share, and the Middle East and Africa (MEA) made up the smallest share of 6%.
United States Digital Payment Market Statistics
 (Reference: precedenceresearch.com)
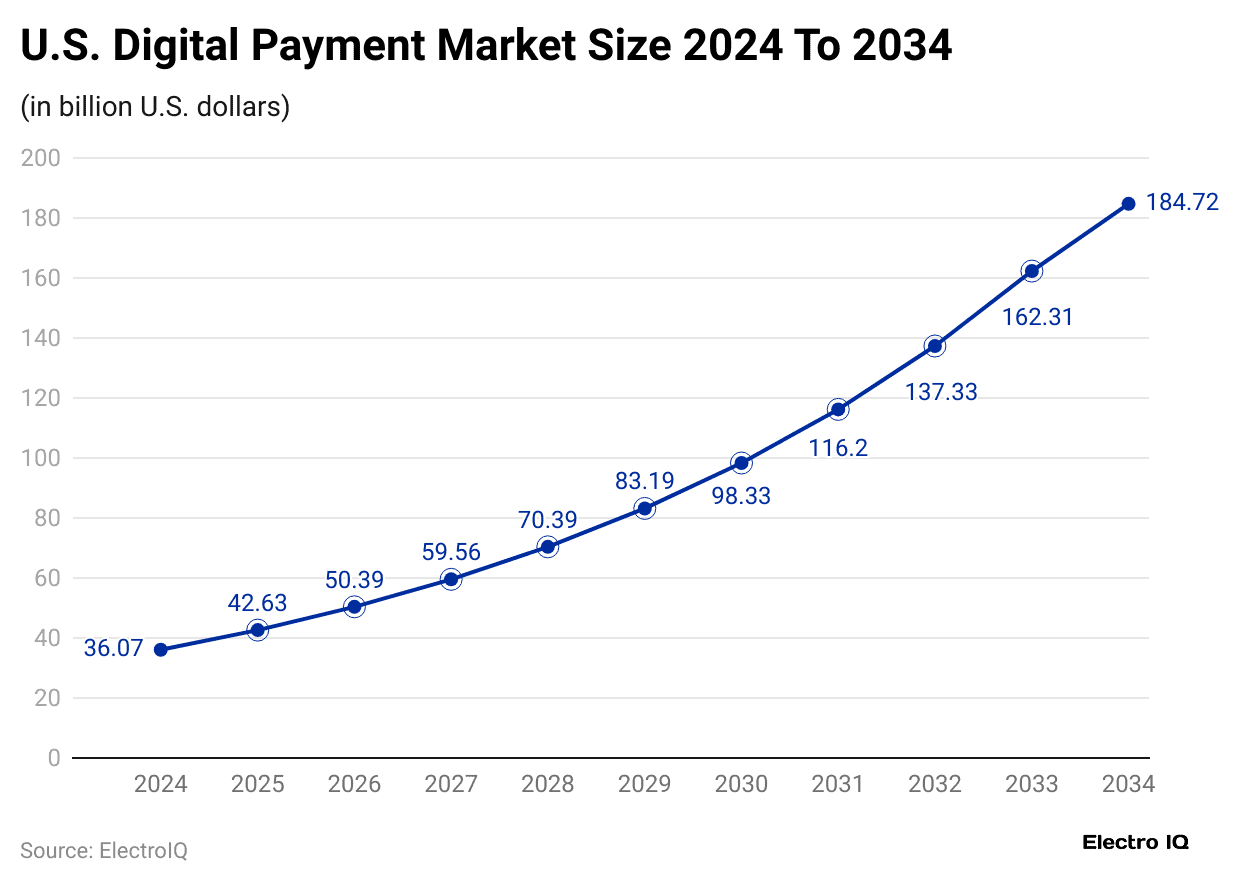
- By 2025, the U.S. digital payment market will reach around USD 42.63 billion, an increase from USD 36.07 billion in 2024.
- In coming years, the merket size are predicted as USD 50.39 billion (2026), followed by USD 59.56 billion (2027), USD 70.39 billion (2028), USD 83.19 billion (2029), USD 98.33 billion (2030), USD 116.20 billion (2031), USD 137.33 billion (2032), USD 162.31 billion (2033), and USD 184.72 billion (2034).
- This market’s compound annual growth rate (CAGR) of 17.74% from 2025 to 2034.
Digital Payment Usage Statistics by Population
 (Reference: magecomp.com)
- In February 2025, Kenya had the highest use of digital payments, with 80% of its population relying on them.
- Next, China, with a 72% share, followed by Thailand, also reported a usage share of 66% and Germany recorded 51%.
- In India and the United States, nearly half of the population uses digital payments, at 46% and 45% respectively. Brazil stands at 44%.
- Interestingly, the United Kingdom shows the lowest adoption among the listed countries, with only 12% of its population using digital payment methods.
Digital Payment Adoption Statistics in Different Industries

- The chart illustrates that the adoption of digital payments in digital remittances leads with 75%, followed by peer-to-peer transfers at 71% and subscription service payments at 70%.
- Both e-commerce transactions and in-app purchases stand at 60%, showing their importance in the digital economy.
- Utility bill payments account for 50%, while B2B payments are close to 49%.
- In-store payments record 45%, and travel and hospitality follow at 40%.
- Healthcare services show slower adoption at 30%, while point-of-sale (POS) purchases remain the lowest at 28%.
Popular Methods of Digital Payment Adoption Statistics
- According to magecomp.com in 2024, there are different payment options available globally, in which India’s UPI dominated the market with a share of 83% all digital transactions.
- Moreover, cards held the largest share, covering 40% of digital payments, while digital wallets such as PayPal, Apple Pay, and Google Pay were chosen for 50% of e-commerce purchases.
- In China, QR code systems gained strong ground, representing 40% of digital payments in 2024.
- Besides, contactless methods were preferred for 45% of in-store shopping.
- Mobile-based services, including Alipay and WeChat Pay, contributed to 30% of digital volumes worldwide.
- Globally, cryptocurrency adoption also grew, although still small, at 2%.
- In addition, Peer-to-peer platforms like Venmo and Zelle accounted for 5% of usage, whereas bank transfers remained common in Europe, capturing 20%.
- Only 6% of digital payments were captured by Buy-now-pay-later solutions in the United States and the United Kingdom.
Digital Payment Transaction Statistics by Platforms
 (Reference: magecomp.com)
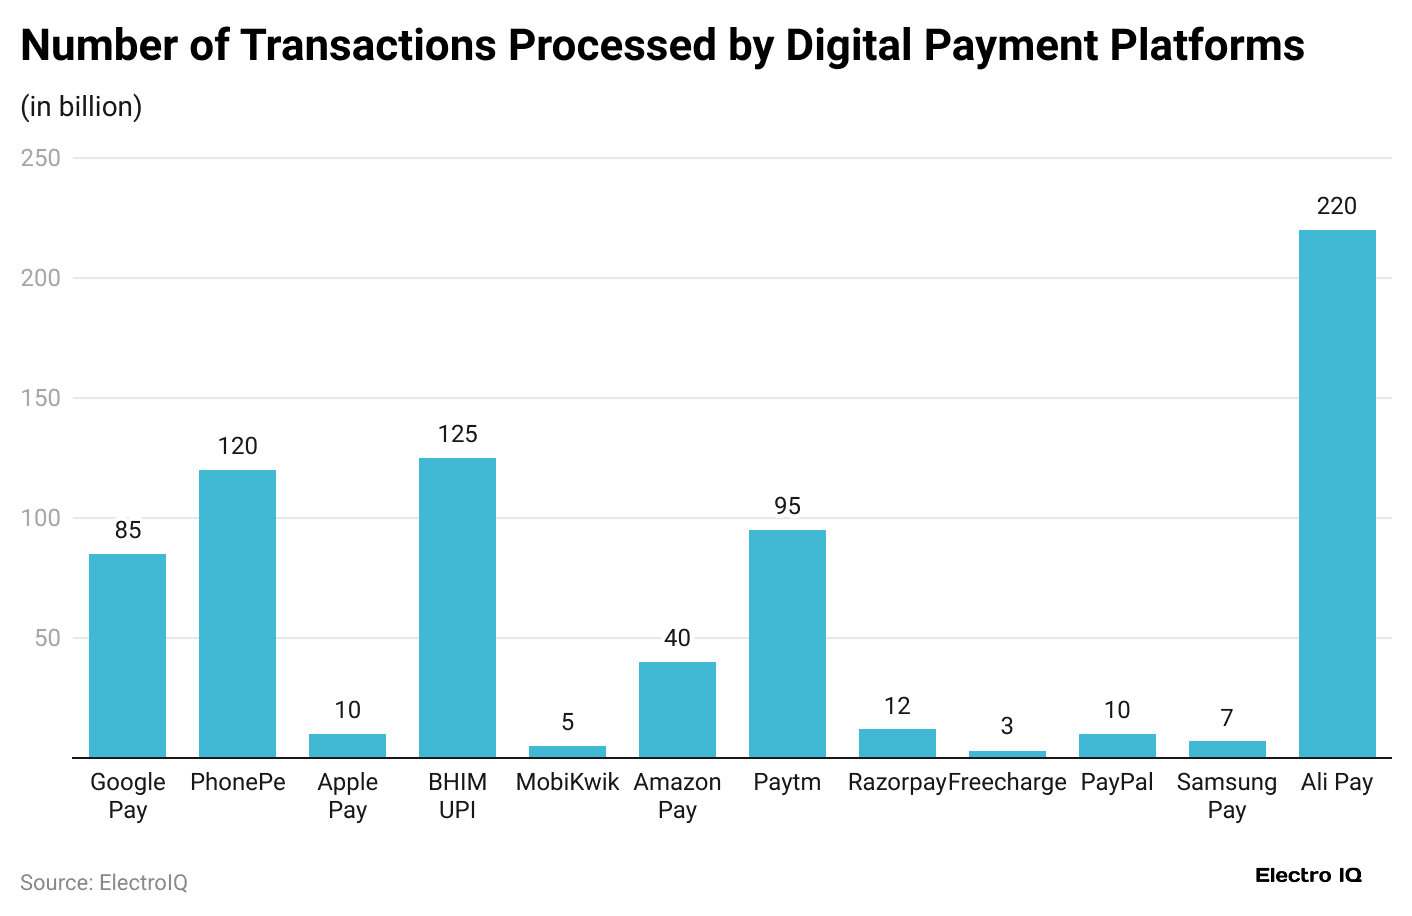
- As of February 2025, Alipay leads global digital payment platforms with 220 billion transactions, driven by China’s huge active user base.
- India’s digital payment ecosystem is led by BHIM UPI, which processed 125 billion transactions.
- PhonePe comes next with 120 billion transactions, while Paytm follows with 95 billion, both serving as major players in the market.
- Google Pay also recorded impressive numbers at 85 billion transactions, and Amazon Pay reached 40 billion.
- Smaller platforms such as MobiKwik with 15 billion, Razorpay with 12 billion, and Freecharge with 3 billion make smaller contributions.
- Among international services, Apple Pay handled 10 billion, PayPal managed 7 billion, and Samsung Pay reported 5 billion transactions.
Digital Payment Transaction Valuation Statistics by Top 5 Countries
- A Statista report analysis further shows that the total valuation of the digital payment transaction market is forecast to reach around USD 9.28 trillion by 2025.
- In contrast, the market will grow at a CAGR of 7.48%, from 2025 to 2030, resulting in USD 13.32 trillion by 2030.
- Mobile POS payments are predicted to be the largest, with a projected transaction value of USD 5.80 trillion in 2025.
Furthermore, the transaction valuations of the other four countries are stated in the table below:
| Country | Valuation (USD) | CAGR (from 2025 to 2030) | Largest Market (Mobile POS Payments) 2025 | |
| 2025 | 2030 | |||
|
United States |
3.10 trillion | 7.16 trillion | 18.19% | USD 1.94 trillion |
| India | 1.88 trillion | 3.61 trillion | 13.88% |
USD 1.18 trillion |
|
Japan |
669.97 billion | 1.63 trillion | 19.41% | USD 418.73 billion |
| United Kingdom | 441.83 billion | 977.82 billion | 17.22% |
USD 276.14 billion |
By Region
| Country | Valuation (USD) | CAGR (from 2025 to 2030) | Largest Market (Mobile POS Payments) 2025 | |
| 2025 | 2030 | |||
| Africa | 232.60 billion | 633.03 billion | 22.17% | USD 145.38 billion |
| Americas | 4.01 trillion | 9.47 trillion | 18.76% | USD 2.51 trillion |
| Asia | 3.99 trillion | 8.63 trillion | 16.66% | USD 2.49 trillion |
| Australia & Oceania | 153.75 billion | 353.85 billion | 18.14% | USD 96.09 billion |
| Caribbean | 27.57 billion | 65.85 billion | 19.02% | USD 17.23 billion |
| Central & Western Europe | 1.40 trillion | 3.17 trillion | 17.75% | USD 874.95 billion |
| Central Africa | 9.55 billion | 23.55 billion | 19.78% | USD 5.97 billion |
| Central America | 34.15 billion | 87.02 billion | 20.57% | USD 21.35 billion |
| Central Asia | 48.34 billion | 129.11 billion | 21.71% | USD 30.21 billion |
| Eastern Africa | 53.69 billion | 157.38 billion | 24% | USD 33.56 billion |
| Eastern Asia | 927.21 billion | 2.39 trillion | 20.81% | USD 579.51 billion |
| Eastern Europe | 318.59 billion | 694.11 billion | 16.85% | USD 199.12 billion |
| Europe | 2.42 trillion | 5.67 trillion | 18.55% | USD 1.51 trillion |
| North America | 3.45 trillion | 7.97 trillion | 18.27% | USD 2.15 trillion |
| Northern Africa | 51.94 billion | 153.17 billion | 24.15% | USD 32.46 billion |
| Northern Europe | 188.34 billion | 459.02 billion | 19.50% | USD 117.71 billion |
| South America | 524.20 billion | 1.40 trillion | 21.68% | USD 327.63 billion |
| Southeast Asia | 789.22 billion | 1.71 trillion | 16.78% | USD 493.26 billion |
| Southern Africa | 23.50 billion | 69.27 billion | 24.14% | USD 14.69 billion |
| Southern Asia | 1.98 trillion | 3.88 trillion | 14.42% | USD 1.24 trillion |
| Southern Europe | 513.74 billion | 1.35 trillion | 21.25% | USD 321.08 billion |
| Western Africa | 93.93 billion | 229.66 billion | 19.58% | USD 58.71 billion |
| Western Asia | 330.07 billion | 729.77 billion | 17.20% | USD 06.30 billion |
Payment Methods for In-Person and Online Shopping
 (Source: publications.iadb.org)
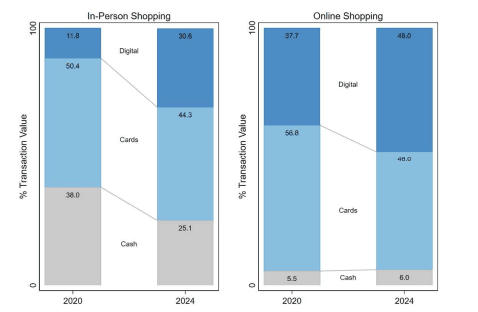
- Based on In-person shopping, digital payments increased from 11.8% in 2020 to 30.6% in 2024, while card payments dropped slightly from 50.4% to 44.3%.
- Cash usage declined sharply, rom 38% to 25.1% over the same period.
- In online shopping, digital payments also saw strong growth, rising from 37.7% in 2020 to 48% in 2024.
- Card payments decreased from 56.8% to 46%, whereas cash payments remained nearly unchanged, moving from 5.5% to 6%.
Reasons for Adopting Digital Payment Statistics
- According to publications.iadb.org, saving is the main benefit; thus, 75% of consumers see digital payments as an effective option.
- Consumers benefit from digital payment, includingth 74% using them to reduce cash dependency, 58% finding it useful for financial planning, 51% gaining easier access to loans and investments, and 48% managing emergencies more effectively.
- For companies, 66% say it improves speed and convenience, 49% find it more secure than cash, 46% see higher sales, 38% avoid problems with change, and 28% rely on automatic transaction records.
Comparison of Digital Payment Adoption Statistics by Region and Category (2023 to 2024)
 (Reference: mckinsey.com)
- In 2024, online payments in the U.S. slipped to 69% from 73% a year earlier, while Europe recorded 64%.
- In-app transactions in the U.S. grew from 58% to 60%, compared with 48% in Europe.
- For store purchases, both regions reported equal adoption at 28%.
Key Barriers to Digital Payment Adoption
- In the U.S., around 40% of internet users worry about security, mainly fraud and unauthorised access.
- In India, 46% of rural merchants are still unaware of digital payment options, while 94% of non-users face poor internet and service issues.
- Many African countries struggle with weak mobile networks, often causing failed transactions and a cash return.
- Many consumers are hesitant, as 41% are reluctant to adopt new payment options.
- Additionally, high setup costs make small businesses reluctant to use digital payment systems.
Conclusion
After completing the article on Digital Payment Adoption Statistics, it can be concluded that Digital payments are not just a payment option but have become the main way of completing easy transactions globally. This growth is largely driven by ease, speed, and wider access, along with support from fintech, government policies, and shifting consumer habits.
Digital payment adoption levels are different across regions and industries, but the overall trend points toward a cashless future. At the same time, challenges such as security concerns, poor infrastructure, and high setup costs still create obstacles. Even so, digital payments are set to expand further, reshaping global finance and everyday trade.
FAQ.
Mostly required internet access, secure devices, bank accounts, payment gateways, authentication, and regulatory compliance.
The three modes of digital payment are mobile wallets, online banking, and card-based transactions.
China leads globally in digital payments, driven by mobile apps like Alipay and WeChat Pay usage.

Maitrayee Dey has a background in Electrical Engineering and has worked in various technical roles before transitioning to writing. Specializing in technology and Artificial Intelligence, she has served as an Academic Research Analyst and Freelance Writer, particularly focusing on education and healthcare in Australia. Maitrayee's lifelong passions for writing and painting led her to pursue a full-time writing career. She is also the creator of a cooking YouTube channel, where she shares her culinary adventures. At Smartphone Thoughts, Maitrayee brings her expertise in technology to provide in-depth smartphone reviews and app-related statistics, making complex topics easy to understand for all readers.