UPI Statistics By Transactions, Popular Bank, Merchant and Facts
Updated · Nov 04, 2025

Table of Contents
- Introduction
- Editor’s Choice
- How Many People Use UPI?
- How Many UPI Transactions Are Recorded Per Day in India?
- How Many UPI Transactions Take Place Per Month?
- What Is the Maximum UPI Transaction Limit Per Month?
- How Many Countries Have Adopted UPI for Payments?
- Which Bank Has The Most Shares In UPI?
- Growth of Digital Payment in India
- Digital Payment Transactions Worldwide
- The Volume of UPI Payments in India
- Most Popular Real-Time Payment Brands
- UPI Lite Statistics
- General UPI Statistics
- Popular Banks Using UPI
- List of UPI Apps
- UPI Application-Specific Statistics
- Conclusion
Introduction
UPI Statistics: A Unified Payment Interface is a payment interface focusing on the interface facilities between bank peer-to-peer interfaces and payment-merchant roles. It has become one of the most popular forms of digital payment in India. Furthermore, it has developed as a robust platform for transactions.
As we go forward, we will glance at this platform, learn more about the advantages this technology offers, and have a brief overview of UPI Statistics on a holistic level, thus learning about the technology and its future.
Editor’s Choice
- UPI was launched on April 11, 2016, by the National Payments Corporation of India (NPCI).
- NPCI introduced UPI 2.0 in August 2018, adding features such as signed intent and QR, one-time mandates, invoice verification, and overdraft facilities.
- Merchant adoption reached 30 million in 2023 and is expected to hit 35 million in 2024.
- Digital payment growth in India surged from 0.08% in 2017 to 0.97% by the end of 2023.
- Global digital transactions reached 1,348 billion in 2023 with a 17.8% year-on-year growth.
- UPI transaction volume increased from 17.9 million in 2017 to 83,714.4 million in 2023 and is projected to reach 131,129.5 million in 2024.
- India led global real-time payments with 74 billion UPI transactions in 2022.
- The average UPI transaction size rose from USD 20 in 2023 to USD 25 in 2024.
- UPI users aged 18-35 accounted for 55% in 2023.
- Users over 50 years increased from 10% in 2022 to 15% in 2023.
- Cross-border UPI transactions amounted to USD 10 billion in 2023.
- UPI expanded to seven countries: Sri Lanka, Mauritius, the UAE, Singapore, Bhutan, and Nepal.
- Merchants pay a 1.1% transaction fee for amounts above INR 2,000.
How Many People Use UPI?
- The adoption of the Unified Payments Interface (UPI) has grown remarkably since its launch in 2016. Within just a few years, the platform reached over 100 million users.
- UPI has achieved a significant milestone, with over 350 million users actively using the platform in the Indian market. This growth reflects the rapid transition toward digital and cashless payment systems in the country.
- According to estimates, the number of UPI users is expected to surpass 365 million by the end of 2024, highlighting the increasing popularity of UPI as a preferred mode of payment.
- UPI’s success is part of a broader trend in the Asia-Pacific region, where citizens are highly inclined to adopt cashless payment methods.
- 93% of individuals in the region reportedly made cashless payments within the last year, further emphasizing the cultural and technological shift toward digital financial transactions.
How Many UPI Transactions Are Recorded Per Day in India?
- India now records over 443 million UPI transactions per day, showcasing an incredible rise in digital payment adoption post-COVID.
- Daily UPI transactions are predicted to reach 465 million transactions per day by December 2024.
- In February 2022, the number of daily UPI transactions stood at 240 million, marking a dramatic growth trajectory in less than three years.
- As of 2023, the value of daily UPI transactions reached ₹6.27 lakh crore, which represents a 17% increase in value compared to the previous year.
- In comparison, the value of daily UPI transactions in February 2022 was ₹5.36 lakh crore.
How Many UPI Transactions Take Place Per Month?
- UPI transactions surpassed 10 billion per month in August 2023.
- By August 2024, UPI users in India had conducted more than 14.96 billion transactions in a single month. This marks a steady increase in transaction volume, reflecting UPI’s growing adoption.
- From November 2022 to November 2023, an average of 10.07 billion (10,066.22 million) UPI transactions were recorded monthly. The study highlights a consistent rise in transaction volumes over time.
- UPI transactions increased by 4.103 billion compared to the previous year.
The growth is even more significant when compared to 2021, with an increase of 7.19 billion transactions. - The National Payments Corporation of India (NPCI) estimates that UPI transactions could reach 20 billion per month within the next 18 to 24 months.
The following table displays the number of UPI transactions over time:
| Month | Number of UPI Transactions |
|---|---|
| Aug-24 | 14.963 billion |
| Jul-24 | 14.435 billion |
| Jun-24 | 13.885 billion |
| May-24 | 14.035 billion |
| Apr-24 | 13.303 billion |
| Mar-24 | 13.440 billion |
| Feb-24 | 12.102 billion |
| Jan-24 | 12.203 billion |
| Dec-23 | 12.020 billion |
| Nov-23 | 11.235 billion |
| Oct-23 | 11.408 billion |
| Sep-23 | 10.555 billion |
| Aug-23 | 10.586 billion |
| Jul-23 | 9.964 billion |
| Jun-23 | 9.335 billion |
What Is the Maximum UPI Transaction Limit Per Month?
- Public and private sector banks impose varying UPI transaction limits. For example:
- IDFC Bank: ₹30,00,000 per month.
- State Bank of India (SBI): No specific monthly limit set.
- Until all banks comply with the standard UPI limits set by the Reserve Bank of India (RBI), the transaction limits will vary across banks.
Here is the UPI limit of popular banks in India.
| Bank Name | UPI Transaction Limit |
|---|---|
| Bank Of Baroda | ₹25,000 |
| HDFC | ₹100,000 |
| ICICI Bank | ₹100,000 |
| IDBI Bank | ₹100,000 |
| IDFC | ₹100,000 |
| India Post Payment Bank | ₹25,000 |
| Kotak Mahindra Bank | ₹100,000 |
| United Bank of India | ₹25,000 |
| Punjab National Bank | ₹25,000 |
How Many Countries Have Adopted UPI for Payments?
- The Unified Payments Interface (UPI) system, initially developed for cashless payments in India, has expanded globally. Several countries have integrated or adopted UPI for seamless digital transactions.
- As of 2023, 27 countries worldwide have adopted UPI for making cashless payments.
- Sri Lanka: Following a 2021 agreement, Sri Lanka began accepting UPI payments, making it easier for Indian travelers and businesses to transact.
- France and Singapore: These countries have also integrated UPI into their payment systems to support faster, low-cost digital transactions.
- United Arab Emirates (UAE): The Reserve Bank of India (RBI) and the Central Bank of the UAE signed a Memorandum of
- An understanding (MoU) to interlink their payment and messaging systems. This collaboration allows the UAE to integrate UPI services for residents and tourists.
Here is a list of countries that accept UPI.
| India | Singapore | South Korea |
| Armenia | Thailand | Bahrain |
| Bhutan | Cambodia | Maldives |
| Nepal | Vietnam | United Arab Emirates |
| France | Sri Lanka | Australia |
| Qatar | Indonesia | Japan |
| Saudi Arabia | Oman | Switzerland |
| Malaysia | Mauritius | Canada |
| United Kingdom | European Union | Russia |
- SBI holds the highest share in the UPI market with an average of 4.05 billion transactions recorded in Q3 2024.
- This is an increase of approximately 200 million transactions compared to the previous month.
- In October 2022, SBI’s monthly UPI transactions were 1.972 billion, indicating a growth of over 1 billion transactions in a year.
- HDFC Bank holds the second-highest share with a total transaction volume of 1 billion in Q3 2024.
- Bank of Baroda ranks third with a transaction volume of 746 million in Q3 2024.
- Union Bank of India also recorded a high number of UPI transactions, contributing to the significant total market volume.
Here are further details about the top 10 banks with the highest share of UPI based on the number of transactions
| Bank Name | Average Total Transactions Recorded In Q3 2024 |
|---|---|
| State Bank Of India | 4,052 million |
| HDFC Bank Ltd | 1,270 million |
| Bank of Baroda | 985 million |
| Union Bank of India | 941 million |
| Punjab National Bank | 835 million |
| Kotak Mahindra Bank | 772 million |
| Axis Bank Ltd | 730 million |
| Canara Bank | 722 million |
| ICICI Bank | 648 million |
| Bank of India | 478 million |
Growth of Digital Payment in India
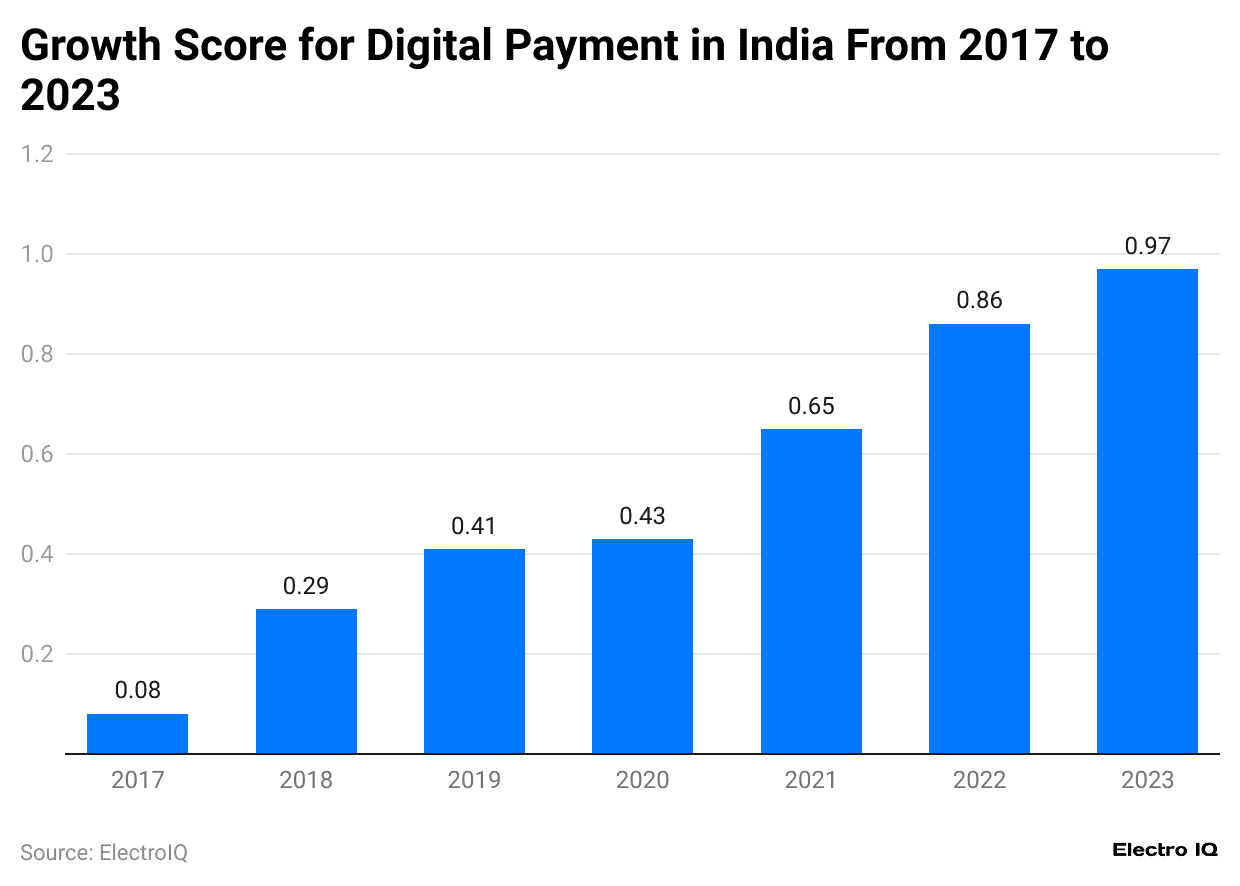
(Reference: statista.com)
- UPI Statistics show that digital payments in India have grown consistently over time.
- While in 2017, the growth rate of digital payment was 0.08%, it had become 0.97% by the end of 2023.
Digital Payment Transactions Worldwide
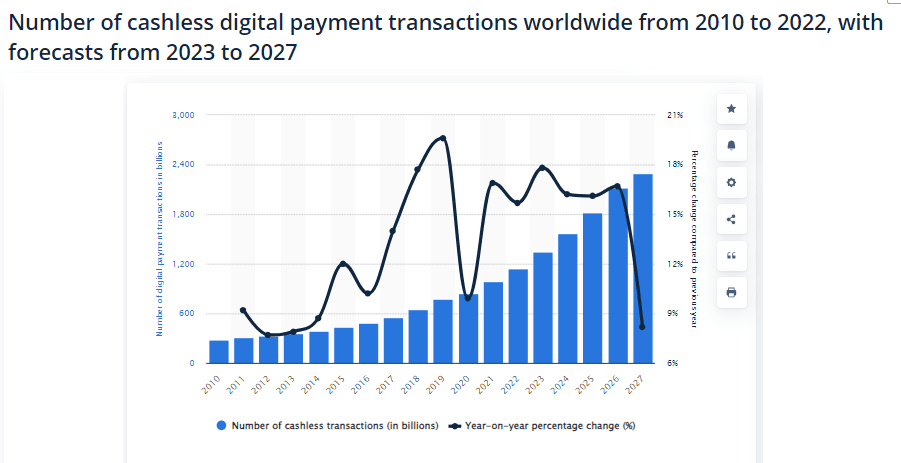
(Reference: statista.com)
- UPI Statistics show that the trend in cashless digital payments has increased significantly over the years, showing the global shift towards digital transactions.
- In 2023, there were 1348 billion transactions with a year-on-year growth of 17.8%.
- By the end of 2027, it is estimated that there will be 2,297 billion transactions with a year-on-year growth rate of 8.2%.
The Volume of UPI Payments in India
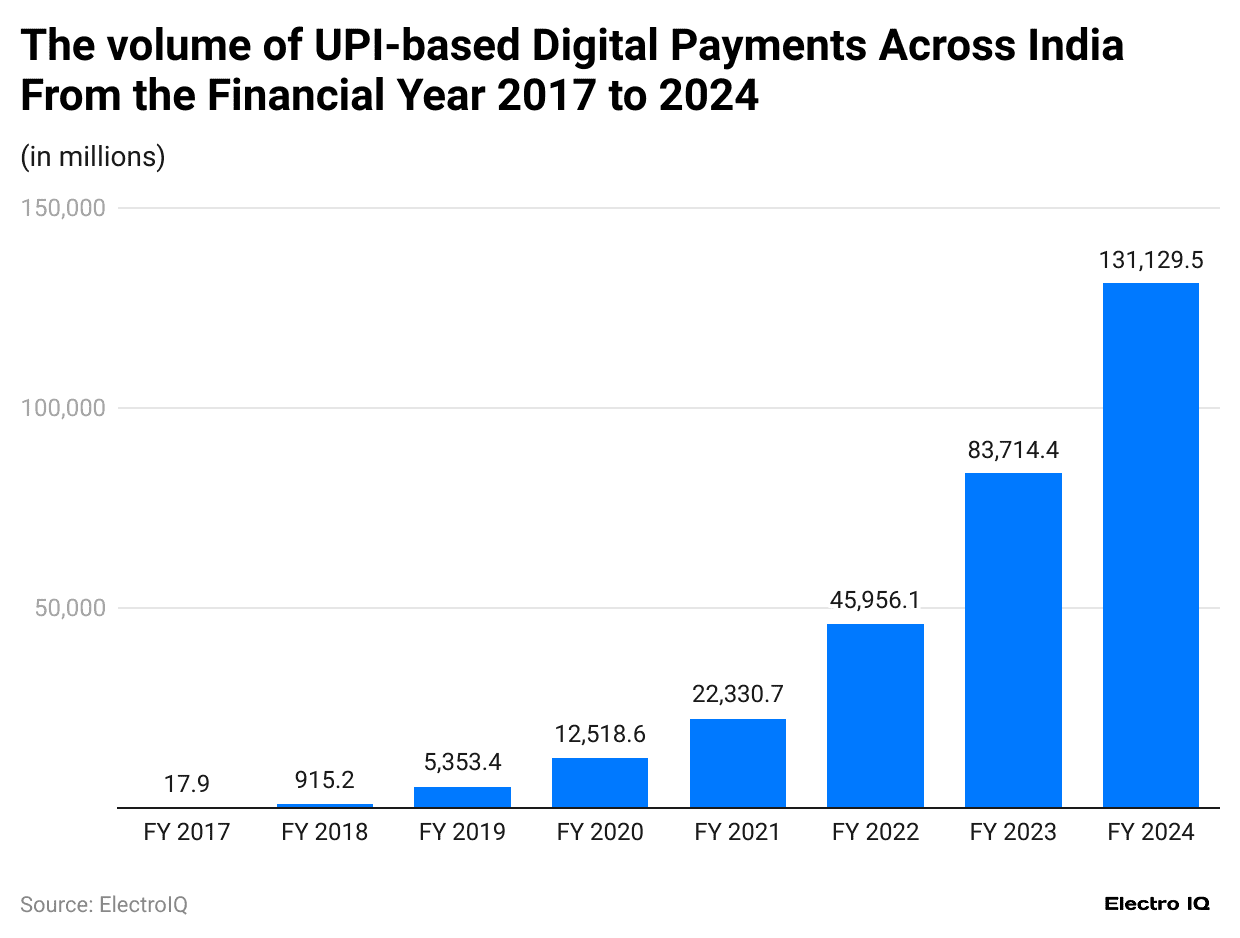
(Reference: statista.com)
- UPI Statistics show that there has been a consistent increase in the volume of UPI payments in India.
- In 2017, the transaction volume was 17.9 million; it increased to 83714.4 million by the end of 2023.
- By the end of 2024, the volume of transactions is predicted to be 131,129.5 million.
Most Popular Real-Time Payment Brands
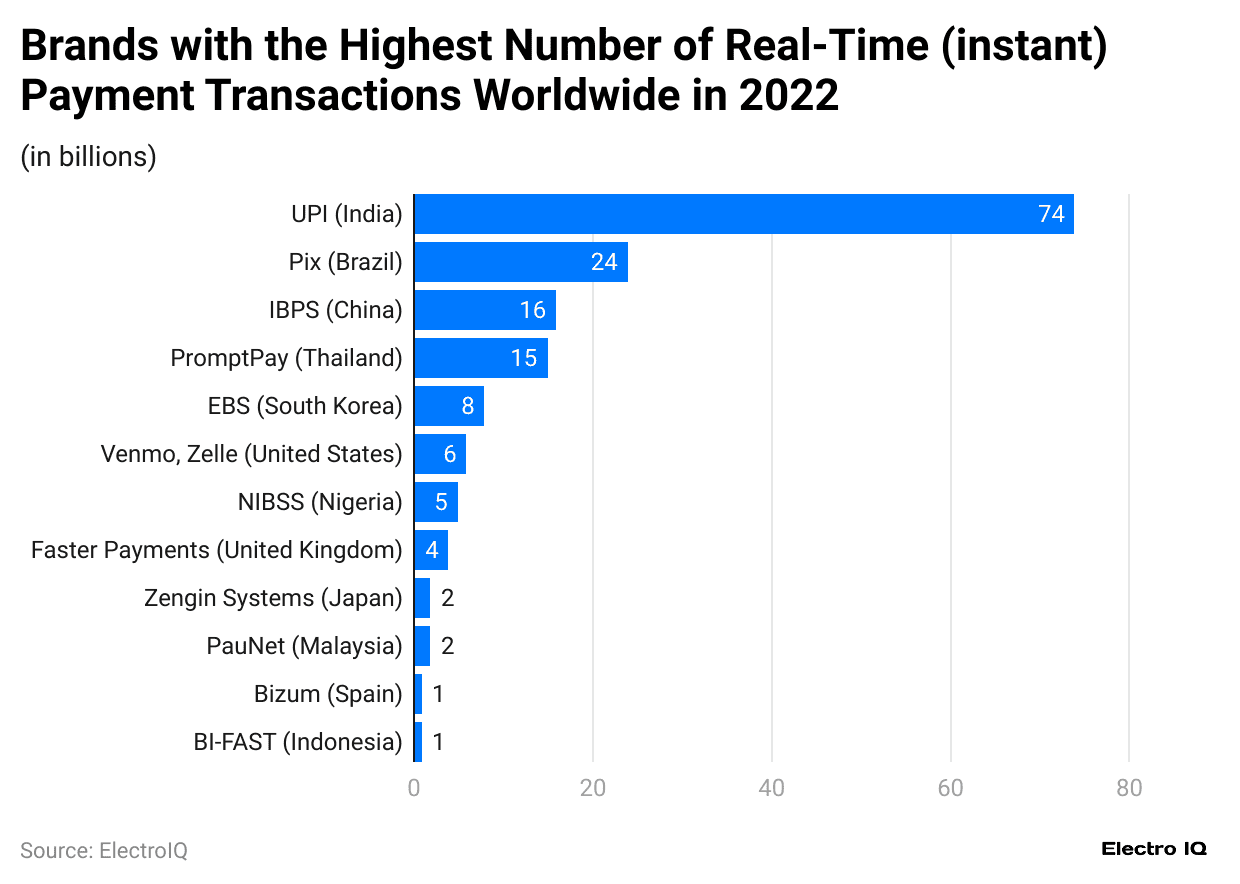
(Reference: statista.com)
- UPI Statistics show that India’s Unified Payments Interface (UPI) dominated the global real-time payment market in 2022, with a significant lead over other payment systems.
- UPI (India) recorded 74 billion transactions, which is followed by Pix from Brazil with 24 billion transactions, IBPS from China with 16 billion transactions, PromptPay from Thailand with 15 billion transactions, EBS from South Korea with 8 billion transactions, Venmo/Zelle from the United States with 6 billion transactions, NIBSS from Nigeria with 5 billion transactions, Faster Payments from the United Kingdom with 4 billion transactions, Zengin System from Japan with 3 billion transactions, PayNet from Malaysia with 2 billion transactions, Bizum from Spain with 1 billion transactions, BI-FAST from Indonesia with 1 billion transactions.
UPI Lite Statistics
- The Reserve Bank of India has raised the transaction limit for UPI Lite from ₹200 to ₹500.
- Each month, over 10 million transactions are processed through UPI Lite. Paytm has facilitated 50 million UPI Lite transactions through its Payments Bank.
- More than 63% of all UPI Lite payments made with Paytm QR codes are initiated within the Paytm app.
- To date, Paytm UPI Lite has achieved a total Gross Merchandise Value (GMV) of ₹280 crore.
- UPI Lite boasts a success rate of 99.9%, even during peak hours.
- It enables quick and seamless transactions of up to ₹500 without the need for a PIN.
General UPI Statistics
- UPI Achieved a Transaction Volume of 14,435.55 Million in July 2024
The Unified Payments Interface (UPI) recorded a transaction volume of 14,435.55 million in July 2024, with an impressive daily transaction volume exceeding 400 million.
UPI Product Statistics (Monthly)
| Month | Volume (in Mn.) |
|---|---|
| January’ 24 | 12,203.02 |
| February’ 24 | 12,102.67 |
| March’ 24 | 13,440.00 |
| April’ 24 | 13,303.99 |
| May’24 | 14,035.84 |
| June’ 24 | 13,885.14 |
| July’24 | 14,435.55 |
- The total value of UPI transactions in July 2024 was ₹20,64,292.40 crore.
- The total volume of UPI transactions reached 14,435.55 million in July 2024.
- UPI was live with 605 banks in July 2024.
- This is a significant increase from its launch in 2016, when UPI was live with only 21 banks.
- UPI witnessed a 56% YoY Growth in Transaction Volume in 2023
- The platform reported a 56% year-over-year (YoY) growth in transaction volume in 2023, rising from 42.09 billion in H2 2022 to 65.77 billion transactions in H2 2023.
- UPI achieved a 44% YoY Growth in Transaction Value in 2023
- Alongside volume growth, UPI saw a 44% YoY increase in transaction value during 2023, showcasing its expanding role in digital payments.
- UPI Transactions Crossed 1 Billion for the First Time in 2019
- Within three years of its launch, UPI surpassed 1 billion transactions in 2019, solidifying its reputation as a reliable payment platform.
- 605 Banks Enabled UPI Services in July 2024
- By July 2024, UPI services were operational with 605 banks, a significant growth compared to its launch in 2016, when only 21 banks were onboard.
- UPI Accounts for 75% of India’s Retail Payment Volume (February 2023)
- UPI accounted for 75% of the total retail payment transaction volume in India in February 2023, with 24.9 billion transactions worth INR 39.7 trillion.
- PhonePe, Google Pay, and Paytm Process 96% of UPI Transactions
- PhonePe, Google Pay, and Paytm together process 96% of UPI payments. PhonePe leads the market by handling 46.4% of total transactions, followed by Google Pay.
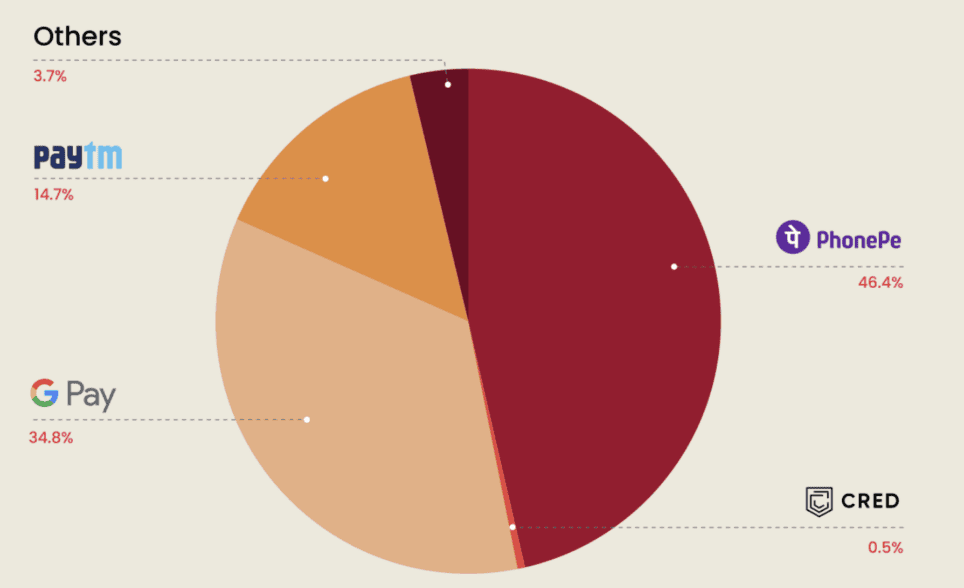
(Source: Meetanshi)
- Top Beneficiary Banks for UPI Transactions
- As of June 2023, Paytm Payments Bank processed 2 billion transactions, followed by Yes Bank with 1.7 billion transactions, and State Bank of India with 1 billion transactions.
- Projected Daily UPI Transactions to Reach 1 Billion by 2026-27
- UPI is projected to reach 1 billion daily transactions by FY 2026-27, paving the way for a cashless transaction ecosystem.
- Transaction Volume and Value for Q1 FY 2023–24
- In the first quarter of FY 2023–24, UPI transaction volume reached 24.9 billion, while the transaction value amounted to INR 39.7 trillion.
Popular Banks Using UPI
- Axis Bank
- Bank of Baroda
- Bank of Maharashtra
- Canara Bank
- Catholic Syrian Bank
- Central Bank of India
- DBS Digibank
- Federal Bank
- HDFC Bank
- HSBC
- ICICI Bank
- IDBI Bank
- IDFC Bank
- Indian Bank
- Indian Overseas Bank
- IndusInd Bank
- Karnataka Bank
- Karur Vysya Bank
- Kotak Mahindra Bank
- Punjab & Sind Bank
- Punjab National Bank
- RBL Bank
- South Indian Bank
- Standard Chartered Bank
- State Bank of India
- TJSB Bank
- UCO Bank
- Union Bank of India
- Yes Bank
- Bank of India
- City Union Bank
- Jammu & Kashmir Bank
- Janta Sahakari Bank Pune
- Equitas Small Finance Bank
- Airtel Payments Bank
- Fino Payments Bank
- Paytm Payments Bank
- Bandhan Bank
- Jio Payments Bank
- Dhanlaxmi Bank
- India Post Payments Bank
- ESAF Small Finance Bank
- AU Small Finance Bank
- Dombivli Nagri Sahakari Bank
- NSDL Payments Bank
- SBM Bank
- Utkarsh Small Finance Bank
- Cosmos Co-op Bank
- The Surat Peoples Co-op Bank
- Jana Small Finance Bank
- Tamilnad Mercantile Bank
- CITI Bank
- Fincare Small Finance Bank
- CSB Bank Limited
- Deutsche Bank
- A P Mahesh Co-operative Urban Bank Ltd
- DCB Bank
- Saraswat Bank
- Apna Sahakari Bank Ltd
- Vasai Vikas Sahakari Bank Ltd
- Thane Bharat Sahakari Bank
- Mehsana Urban Co-op Bank
- GP Parsik
- Kalyan Janta Sahakari
- Rajkot Nagrik Sahakari Bank
- Maharashtra Gramin Bank
- Gujarat State Co-operative Bank
- Hasti Co-op Bank
- GS Mahanagar Co-op Bank
- Karnataka Vikas Gramina Bank
- Andhra Pragathi Gramina Bank
- Kallapanna Arwade Ichalkaranji Janata Sahakari Bank
- Kerala Gramin Bank
- Pragathi Krishna Gramin Bank
- Andhra Pradesh Gramin Vikas Bank
- Chhattisgarh Rajya Gramin Bank
- Telangana Gramin Bank
- Saurashtra Gramin Bank
- Meghalaya Rural Bank
- Uttarakhand Gramin Bank
- Jharkhand Rajya Gramin Bank
- Rajasthan Marudhar Gramin Bank
- Mizoram Gramin Bank
- Bassein Catholic Co-operative Bank
- Assam Gramin Vikas Bank
- Jalgaon Janta Co-op Bank
- The Vishweshwar Sahakari Bank Limited
- Tripura Gramin Bank
- Manipur Gramin Bank
- Chaitanya Godavari Gramin Bank
- SVC Bank
- Baroda Gujarat Gramin Bank
- Baroda Rajasthan Kshetriya Gramin Bank
- The Sutex Co-op Bank
- NKGSB Co-op Bank
- Ujjivan Small Finance Bank
- Baroda Uttar Pradesh Gramin Bank
- Samruddhi Co-operative Bank Ltd
- The Varachha Co-op Bank Ltd
- Urban Co-op Bank Ltd, Dharangaon
(Source: npci.org.in)
List of UPI Apps
- Kiwi
- Amazon Pay
- BharatPe
- MobiKwik
- Phonepe
- Shriram One
- OkCredit
- TataNeu
- Bajaj MARKETS (Finserv Markets)
- IND Money
- slice
- Fi Money
- CRED
- Goibibo
- Google Pay
- Ultracash
- Genwise
- Bajaj Finserv
- Timepay
- money
- Paytm
- POPClub
- Pe
- One Card
- Aditya Birla Capital Digital
- Jupiter Money
- Navi
- FamApp by Trio
- salaryse
- Twid Pay
- Groww
- Samsung Pay
- Niyo Global
- Flipkart UPI
- Make My Trip
(Source: npci.org.in)
UPI Application-Specific Statistics
- PhonePe recorded a consolidated revenue of INR 2,914 crore in the financial year 2023, reflecting a 77% year-over-year growth compared to INR 1,646 crore in 2022.
- PhonePe has more than 500 million registered users and has digitized over 36 million offline merchants across India.
- Google Pay is used by 150 million users across 19 countries, including 67 million active users in India.
- Google Pay is used by 77% of Indians for online payments, while 83% use it for in-store payments.
- Google Pay is used by 2,193 companies worldwide, with the highest adoption in Germany (26.84%), the United Kingdom (19.70%), and the United States (16.98%).
- Paytm had an average of 89 million monthly transacting users in the financial year 2023, a 36% increase compared to 61 million in 2022.
- Paytm recorded total revenue of INR 7,990 crore in the financial year 2023, with payment businesses contributing INR 4,930 crore, accounting for 62% of its total revenue.
- Paytm Payments Bank recorded a transaction volume of 407.65 million in June 2023, compared to 207.3 million in June 2022.
- BHIM recorded 22.9 million monthly transactions in June 2023, compared to 22.5 million in June 2022, reflecting an increase of 0.4 million.
- The value of monthly transactions on BHIM amounted to more than INR 72 billion in June 2023, a decrease from INR 75.16 billion in June 2022.
- Google Pay ranks third among mobile payment applications in the United States, with 25.2 million users.
- In 2019, Google Pay gained an additional 69 million users and is projected to acquire another 100 million users in the upcoming year.
- The monthly transaction volume for Paytm Payments Bank in May 2023 was 425.23 million, in April 2023 was 403.18 million, and in March 2023 was 404.99 million.
- In February 2023, Paytm Payments Bank recorded a transaction volume of 360.42 million, which increased to 389.61 million in the same month.
- In January 2023, Paytm Payments Bank processed 386.5 million transactions, while in December 2022, the volume was 364 million.
Conclusion
The Unified Payments Interface (UPI) has emerged as a revolutionary force in India’s digital payment landscape, demonstrating unprecedented growth and adoption since its inception. UPI Statistics show that 2023-2024 paints a compelling picture of its success, with transaction volumes skyrocketing from 17.9 million in 2017 to over 83 billion in 2023 and values exceeding $1.6 trillion, the platform’s success in reducing fraud.
UPI continues evolving with enhanced security features and broader applications, so it stands as a model for global digital payment systems.
Sources
FAQ.
UPI is a unified payment interface facilitating India’s peer-to-peer bank transfers and merchant payments.
Over 80 billion transactions were processed in 2023, worth approximately $1.6 trillion.
55% of UPI users are 18-35 years old.
As of 2023, over 30 million merchants accept UPI payments across India.
The average transaction size increased from $20 2023 to $25 in 2024.
UPI supports inbound remittances and has partnerships with international payment providers like PayPal and Alipay.
UPI implements multiple security layers, including biometric authentication and real-time fraud monitoring systems
70% of all digital transactions in India were conducted through UPI in 2023.
Rural transactions account for 25% of total UPI volume and are expected to reach 30% by the end of 2024.
Over 80 banks support UPI, including major public and private sector banks, small finance banks, and payment banks.

Saisuman is a skilled content writer with a passion for mobile technology, law, and science. She creates featured articles for websites and newsletters and conducts thorough research for medical professionals and researchers. Fluent in five languages, Saisuman's love for reading and languages sparked her writing career. She holds a Master's degree in Business Administration with a focus on Human Resources and has experience working in a Human Resources firm. Saisuman has also worked with a French international company. In her spare time, she enjoys traveling and singing classical songs. Now at Smartphone Thoughts, Saisuman specializes in reviewing smartphones and analyzing app statistics, making complex information easy to understand for readers.