eBay Statistics By Revenue, Shipping and Logistics, App Usage and Mobile, Users And Trends (2025)
Updated · Sep 24, 2025


Table of Contents
- Introduction
- Editor’s Choice
- eBay Statistics – A Quick Look At The Marketplace
- eBay’s Global User Base and Growth Over Time
- eBay Revenue And Financial Overview
- Top-Selling Categories on eBay
- eBay App Usage and Mobile Statistics
- Geographical Distribution of eBay Users
- eBay Seller Statistics – Who’s Selling And How Much
- Buyer Behavior And Shopping Patterns
- eBay Listings And Product Count Breakdown
- eBay’s Advertising and Promoted Listings Revenue
- eBay Shipping and Logistics Statistics
- eBay Small Business and Independent Seller Growth
- eBay Motors and Auto Parts Performance
- Environmental and Sustainability Statistics from eBay
- Year‑On‑Year Trends and Projections for eBay
- Conclusion
Introduction
eBay Statistics: If you’ve ever bought or sold anything online, chances are you’ve come across eBay. It’s not just another e-commerce site; it’s one of the most iconic digital marketplaces in the world, operating since the early days of the internet. But what makes eBay stand out after all these years? The numbers tell a powerful story. Whether you’re an eBay user, a small business owner, or a digital entrepreneur looking to scale, understanding eBay statistics gives you a huge edge.
In this article, I’m going to break down the most detailed and up-to-date eBay statistics in a way that’s easy to understand and incredibly useful. We’re diving into how many people are using it, what they’re buying, where they’re shopping from, and how much money is flowing through the platform.
So, if you’ve ever wondered how much business is really being done on eBay or what category is exploding right now, stick with me, because here’s everything you need to know about eBay statistics. Let’s get into it.
Editor’s Choice
- As of 2025, eBay boasts over 1.6 billion live listings on its platform, covering everything from electronics to collectibles and fashion.
- The platform serves more than 133 million active buyers globally, showing steady user engagement year after year.
- eBay processes roughly 1.9 billion transactions annually across all categories and regions.
- Its gross merchandise volume (GMV) reached US$74 billion in 2024, demonstrating the significant value that flows through eBay annually.
- Over 17 million sellers use eBay to list and sell their products, with around 80% of them being individual or small-scale sellers.
- Approximately 60% of eBay’s transactions now involve mobile devices, indicating a significant shift towards smartphone shopping.
- The platform sees an average of 250 million monthly searches, making it a highly dynamic and active marketplace.
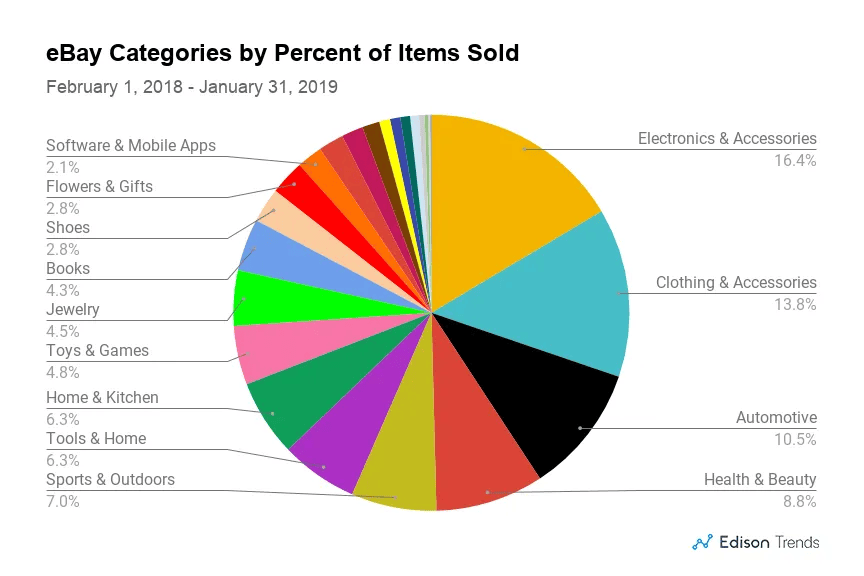
- eBay’s top-selling category is electronics, accounting for 16.4% of total sales, followed by fashion, which makes up 13.7% of the share.
- The U.S. is the largest market, contributing nearly 41% of total sales, followed by the U.K. and Germany.
- eBay Motors alone generated over US$10 billion in 2024, showing the strength of niche verticals on the platform.
- Cross-border trade on eBay makes up 57% of total transactions, reflecting its strong international buyer-seller ecosystem.
- eBay collects about US$9.8 billion in total annual revenue, most of which comes from transaction and listing fees.
- The average order value (AOV) on eBay is roughly US$65, which varies by category and region.
- Over 70% of listings on eBay are available with free shipping as sellers compete for buyer attention.
- eBay’s advertising segment, known as promoted listings, generated US$800+ million in 2024, showing seller demand for visibility.
| Metric | Value / Data Point |
| Total Live Listings | 1.6 Billion+ |
| Active Global Buyers | 133 Million+ |
| Annual Transactions | 1.9 Billion+ |
| Gross Merchandise Volume (GMV) | $74 Billion |
| Number of Active Sellers | 17 Million+ |
| Mobile Transactions Share | 60% of all transactions |
| Monthly Searches | 250 Million+ |
| Top Selling Category | Electronics (16.4%) |
| Revenue from the U.S. Market | 41% of the total |
| eBay Motors Sales | $10 Billion |
| Cross-Border Trade Volume | 57% of all transactions |
| Total Annual Revenue | $9.8 Billion |
| Average Order Value | $65 |
| Listings with Free Shipping | 70%+ |
| Promoted Listings Revenue | $800+ Million |
eBay Statistics – A Quick Look At The Marketplace

(Reference: enterpriseappstoday.com)
- eBay was founded by Pierre Omidyar in September 1995 as AuctionWeb, evolving into a global online marketplace that combines auctions and fixed-price “Buy It Now” listings to suit different buyer and seller preferences.
- Today, it operates across more than 190 markets worldwide, facilitating commerce in nearly every country, and has grown far beyond its original peer-to-peer auction model to include businesses and international sellers.
- The platform’s core mission is to connect buyers and sellers globally, creating economic opportunity and enabling anyone to participate in cross-border trade, whether they’re individuals or small businesses.
- With its reputation system built on ratings and seller performance, eBay emphasized trust through feedback and seller badges, helping both new and experienced users transact with greater confidence.
- The fee structure for sellers typically includes insertion fees and final value fees, which vary by category and location, e.g., around 12 to 15% of the sale price, incentivizing high-volume sellers.
- eBay is publicly traded on Nasdaq and is a component of the S&P 500 index, which underscores its scale and influence in the global technology and retail sectors.
- The value proposition for buyers includes unique collectibles, pre-owned luxury products, and refurbished electronics, often at significant discounts compared to retail.
- Fixed-price “But It Now” listings now account for the vast majority of sales versus auctions, reflecting shifts in buyer behaviour toward convenience and instant purchase.
- Over the last decade, eBay has steadily shifted from a consumer-to-consumer to a consumer and merchant market. Mix, as professional sellers make up an increasing share of listings and sales.
- The platform supports a wide variety of verticals from fashion to auto parts to trading cards and continues to evolve with strategic AI tools, sustainability initiatives, and partnerships with payment and advertising platforms.
| Metric / Feature | Detail |
| Founded | September 1995 |
| Market model | Auction & fixed-price listings |
| Markets | 190+ countries |
| Buyer trust system | Feedback ratings, seller badges |
| Seller fees | 12 to 15% of the sale price (category-dependent) |
| Stock index | S&P 500 listed |
| Sale mix | Primarily “Buy It Now” |
| Seller composition | A mix of individuals and professional merchants |
| Core verticals | Fashion, electronics, collectibles, motors, etc. |
eBay’s Global User Base and Growth Over Time

(Source: statista.com)
- As of Q1 2025, eBay reports approximately 134 million active buyers worldwide, up about 1 to 2% YoY, recovering from earlier declines in 2022 to 2023.
- In previous years, eBay had peaked at around 142 million buyers in early 2022, then dipped to c.132 million by mid-2023 before stabilizing in the 132 to 134 million range by early 2025.
- There are an estimated 18 to 20 million active sellers globally, based on the most recent figures and historical disclosure, suggesting a buyer-to-seller ratio of around 7:1 or 8:1, reflecting the high volume of casual buyers versus sellers.
- The platform supports roughly 2.3 billion live listings, representing an approximate 15% growth from 2023 to 2024, as sellers increasingly list inventory across multiple markets.
- Buyer growth averaged around 1% annually recently, much slower than earlier double-digit growth years, indicating market maturity and stabilization.
- The number of listings per active buyer is approximately 17 to 18 listings per buyer, reflecting robust inventory relative to the user base.
- Growth in buyers is concentrated in focus categories like collectibles and refurbished products, while overall growth has been flat or modest across other sectors.
- Regional buyer distribution leans heavily toward the U.S., accounting for 70 to 80% of total site visits and activity, with international buyers making up the rest.
- Younger users dominate mobile growth, especially buyers aged 18 to 34, who make up nearly 75% of mobile traffic and purchases.
- eBay’s user base leans toward occasional buyers, but its “enthusiast buyers,” those with 6+ buying days per year and $800 annual spend, drive a significant portion of GMV.
| Metric | Q1 2025 Value | YoY Change / Notes |
| Active buyers | 134 million | +1 to 2% YoY |
| Active sellers | 18 to 20 million | Buyer: seller 7 to 8:1 |
| Live listings | 2.3 billion | 15% growth since 2023 |
| Listings per buyer | 17 to 18 per buyer | Wide inventory per user |
| Enthusiast buyers | Subset of total buyers | High-frequency, $800 spend |
| Buyer growth rate | 1% annually | Slowed from prior years |
| U.S. share of user activity | 70 to 80% | International rest |
| Age 18 to 34 mobile buyers | 75% of mobile buyers | U.S.-led Gen Z/mobile use |
eBay Revenue And Financial Overview

(Reference: statista.com)
- In Q1 2025, eBay generated $2.585 billion in total revenue, reflecting roughly +1% YoY, and matching results in full-year 2024 with $10.28 billion total revenue.
- Gross Merchandise Volume (GMV) in Q1 2025 was about $18.8 billion, up 1% reported, or 2% on an FX-neutral basis, showing stable but modest growth.
- Non-GAAP diluted earnings per share in Q1 2025 stood at $1.38, up 10% YoY, while GAAP EP5 rose to $1.06, up 25% YoY.
- GAAP net income for Q1 2025 was $505 million, reflecting a 15% increase versus $439 million a year earlier; non-GAAP net income was about $657 million, essentially flat YoY.
- eBay’s non-GAAP operating income margin was about 29.8% slightly down from 30.3% in Q1 2024, showing efficient cost management.
- Q1 free cash flow was $644 million, representing roughly 25% of revenue, supporting strong liquidity and shareholder returns.
- Capital returns in Q1 2025 included $625 million in share buybacks and $134 million in cash dividends paid, with about $2.7 billion remaining in buyback authorization.
- Advertising revenue in Q1 2025 totaled $442 million, representing about 2.4% of GMV; first-party ads (e.g., Promoted Listings) accounted for $418 million, growing 14% YoY on an FX-neutral basis.
- Take-rate (revenue as a percentage of GMV) for Q1 2025 averaged around 13.8% stable compared to the prior year.
- Financial guidance for Q2 2025 projects revenue of $2.59 to $2.66 billion and GMV of $18.6 to $19.1 billion, slightly above analyst expectations.
| Metric | Q1 2025 Value | YoY Change / Notes |
| Total revenue | $2.585 B | +1% |
| Full-year 2024 revenue | $10.28 B | +1 to 2% YoY |
| GMV | $18.8 B | +1% (2% FX-neutral) |
| GAAP EP5 | $1.06 | +25% YoY |
| Non-GAAP EPS | $1.38 | +10% YoY |
| GAAP net income | $505 M | +15% YoY |
| Free cash flow | $644 M | 25% of revenue |
| Advertising revenue (first-party) | $418 M | +14% YoY |
| Advertising as % of GMV | 2.4% | Growing |
| Take-rate | 13.8% | Stable |
| Capital returns (share buybacks/dividends) | $625 M / $134 M | Strong return activity |
Top-Selling Categories on eBay
(Source: webinterpret.com)
- Electronics & accessories remain eBay’s leading category, comprising around 28% of global GMV, with high demand for smartphones, laptops, and wearable tech, driven by both new and refurbished items.
- Fashion, including apparel, shoes, and accessories, accounts for approximately 17% of GMV, driven by popular sub-segments like sneakers, handbags, and vintage clothing, which grow on trends and collector interest.
- Home & Garden makes up about 14% of GMV, fueled by DIY home improvement, furniture, and outdoor living products, highlighting a strong buyer preference for varied pricing and used options.
- Motors & auto parts are a key vertical with strong growth, accounting for roughly 12% of GMV, driven by niche parts, collectible vehicles, and aftermarket accessories with loyal buyer-seller communities.
- Collectibles & art, especially trading cards (sports cards, Pokemon) have experienced double-digit growth for nine consecutive years. This vertical now makes up around 4 to 5% of GMV.
- Luxury products and accessories, like watches and high-end handbags, command roughly 5% of GMV, representing a high-margin category with rising demand for authenticated pre-owned items.
- Refurbished & certified pre-owned electronics have surged, adding around 20% annual growth in GMV share, driven by buyer interest in certified, low-priced devices with warranty guarantees.
- Toys & hobbies contribute about 4 to 5% of GMV, fueled by collectors and second-hand markets for action figures, model kits, and games resurgence linked to nostalgia trends.
- Sporting products (fitness gear, outdoor equipment) comprise around 3 to 4% of GMV, with growth promoted by health-conscious consumers and outdoor activity trends.
- Everything else (books, collectibles, cameras, musical instruments) fills the remainder of GMVeBay’s platform, and diversity supports niche marketplaces that remain steady or slightly growing.
| Category | % of GMW | Notable Trend |
| Electronics & accessories | 28% | New + refurbished mobile devices |
| Fashion | 17% | Sneakers, vintage, luxury apparel |
| Home & Garden | 14% | DIY & pre-owned furniture |
| Motors & auto parts | 12% | Speciality parts, aftermarket gear |
| Collectibles & art (incl. cards) | 4 to 5% | Trading card boom |
| Luxury products & electronics | 5% | Pre-owned designer products |
| Toys & hobbies | 4 to 5% | Nostalgia-driven collector demand |
| Sporting products | 3 to 4% | Health & outdoor equipment surge |
| Refurbished electronics | +20% YoY share | Certified pre-owned tech |
eBay App Usage and Mobile Statistics

(Reference: statista.com)
- The eBay mobile app is downloaded roughly 2.7 million times monthly as of Q1 2025, maintaining consistent growth and ranking in the top 10 shopping apps globally.
- Traffic breakdown shows nearly 52% of site visits originate from mobile devices, while desktop remains just below at 48%, highlighting eBay’s mobile-first user base.
- In Q1 2025, a whopping $12 billion in GMV was processed through mobile devices, accounting for approximately 64% of the total, underscoring mobile commerce dominance.
- Among mobile users, buyers aged 18 to 34 make up about 75% this demographic drives engagement through app notifications, deals, and social integrations.
- In the U.S., the eBay app has been downloaded around 9.5 million times in 2023, with a repeat-purchase rate rising month-over-month, reflecting stickiness and app loyalty.
- The average mobile session time is around 6.8 minutes, with users viewing 9 to 11 listings per session, indicating strong browsing intent and conversion potential.
- Features like “save & Watch”. In-app chat and streamlined checkout have boosted mobile engagement by an estimated 15 to 20% over the past two years.
- Push notifications offering price drops or shipping updates see open rates near 27% significantly higher than email marketing at 18% demonstrating effective mobile communication.
- Users spend around 5 to 7% more per transaction on mobile apps, compared to desktop, driven by convenience and impulse buying tendencies.
- eBay’s in-app promotions and daily deals generate up to 30% higher conversion rates compared to web-only offers, leading to increased mobile-first marketing strategies.
| Metric | Mobile | Desktop |
| Share of site visits | 52% | 48% |
| GMV handled | $12 B (64%) | $6.8 B (36%) |
| Average session time | 6.8 minutes | 8 to 9 minutes |
| Listings viewed per session | 9 to 11 | 12 to 14 |
| Purchase frequency | Higher | Moderate |
| Average order value | 5 to 7% higher | Baseline |
| Push notification open rate | 27% | n/a |
| Email open rate | n/a | 18% |
Geographical Distribution of eBay Users

(Reference: couponfollow.com)
- The United States dominates eBay usage with around 70 to 80% of global site visits and transactions driven by its large population and strong e-commerce adoption.
- Canada and Mexico each contribute around 1.1% of global traffic, reflecting modest but growing regional user bases within North America.
- The United Kingdom accounts for close to 1% of global visits, but it maintains a disproportionately high value-per-transaction average due to premium categories.
- Internationally, cross-border GMV makes up nearly 25% of total transactions, highlighting eBay’s role in global trade and its logistics capabilities.
- eBay’s revenue split is roughly even, with 50.9% from the U.S. and 49.1% from international markets in 2024, showing global diversification.
- China, although a smaller direct marketplace, contributes approximately 10 to 11% of GMV, largely via Chinese seller bases in mature markets.
- eBay’s presence in 190+ countries allows buyers worldwide access, with language and currency localization, easing international transactions.
- The average order in 190+ countries allows buyers worldwide access, with language and currency localization, easing international transactions.
- The average order value (AOV) varies by geography: U.S. ($60 to 70), U.K. (Euro 75 to 100 / $95 to 127), and Germany (Euro 80), indicating regional price sensitivity.
- Listings growth mirrors GMV growth internationally, global listings up 15% YoY, indicating sellers in high-GMV regions are scaling inventory.
| Region/Country | % of Visits/GMV | Key Highlights |
| United States | 70 to 80% | Largest user & transaction base |
| Canada | 1.1% | Growing engagement |
| Mexico | 1.1% | Emerging market |
| United Kingdom | 1% | High AOV market |
| China (seller GMV) | 10 to 11% | Strong seller activity |
| International share | 25% (cross-border GMV) | Significant global commerce |
| US vs. International revenue | 50.9/49.1% split | Balanced growth |
| Seller origin | U.S: 31%, U.K.: 29%, Germany: 15% | Concentrated |
| AOV (US) | $60 to 70 | Reasonable average ticket |
| AOV (UK) | $95 to 127 | Lower volume but premium prices. |
eBay Seller Statistics – Who’s Selling And How Much

(Reference: statista.com)
- The estimated 18 to 20 million total active sellers include occasional individuals, part-time resellers, and full-time merchants, with the top 1% of sellers responsible for about 50% of GMV.
- PowerSellers and Top Sellers, who often operate as professional businesses, typically achieve over $100,000 in GMV annually, with many scaling into the millions.
- Casual/occasional sellers listing once or twice annually constitute over 10 million, yet only supply about 15 to 20% of total GMV, highlighting the disparity in seller performance.
- eBay charges sellers an average of 12 to 15% in fees, including insertion, final value, and optional promoted listings, which increases with category and item price.
- The average seller lifetime, defined as having 6+ transactions per year, is about 1.8 years, showing modest seller stickiness and turnover.
- Sellers with 5+ years tenure account for nearly 40% of GMV, indicating long-term commitment correlates with success.
- The average listing price across all categories is approximately $25 to 30, although high-ticket categories like electronics and cars raise the overall GMV.
- Return rates vary by category: electronics ( 4%), fashion ( 10%), collectibles (<1%), with eBay implementing policies to balance buyer protection and seller performance.
- Approximately 40 to 45% of sellers use promoted listings, and those sellers typically see an average 25% uplift in sales volume, underlining the tool’s effectiveness.
- Sellers are adopting e-commerce automation tools and API integrations, with about 30% of top-tier sellers using advanced third-party logistics platforms to streamline listings and inventory.
| Metric | Value / Share |
| Active sellers | 18 to 20 million total |
| GMV share: top 1% sellers | 50% total GMV |
| Casual seller count | >10 million |
| Fee rate | 12 to 15% average |
| Seller lifetime (6+ transactions) | 1.8 years average |
| Sellers 5+ years | 40% of GMV |
| Average listing price | $25 to 30 |
| E-promoted listing usage | 40 to 45% of sellers |
| Promoted listing uplift | 25% more sales |
| Return rates | Electronics 4%, Fashion 10% |
Buyer Behavior And Shopping Patterns

(Reference: smartinsights.com)
- Roughly 1 in 4 eBay users are considered “enthusiast buyers,” purchasing on 6+ days per year or spending over $800 annually, and account for a large proportion of GMV.
- Casual buyers making fewer than 6 transactions per year comprise about 70 to 75% of the buyer base, but account for only 30 to 35% of GMV.
- On average, buyers place 5 to 6 orders per quarter, with typical spending around $150 to $200 per quarter, revealing consistent but varied purchase patterns.
- Buyer age distribution skews younger on mobile; users aged 18 to 34 make up approximately 75% of mobile-driven purchases, showing demographic trends in engagement.
- Searches for “used” or “refurbished” surged by 45% YoY, a sign of increased interest in sustainable and affordable shopping options.
- Watchlist engagement is strong: nearly 30% of buyers add items to their watchlist, with 15 to 20% converting to purchase within 30 days, reinforcing the value of saved items.
- Push notifications triggered purchase events around 10 to 12% of transactions, underscoring effective real-time engagement mechanisms.
- Flash deals and daily discounts help drive impulsive behaviors: around 25% of buyers report making unplanned purchases during such promotions.
- When shopping internationally, 65% of buyers purchase from sellers in other countries, mostly domestic U.S. buyers purchasing from the U.S., but also high international cross-border rates.
- Buyer return rates averaged around 8 to 9% overall, with transparency on seller performance key to reducing returns and increasing satisfaction.
| Metric | Value / Insight |
| Enthusiast buyers share | 25% of the user base, a large GMV contributor |
| Casual buyers share | 70 to 75% of users |
| Orders per buyer (quarterly) | 5 to 6 |
| Avg. quarterly spend per buyer | $150 to 200 |
| Age 18 to 34 mobile buyer share | 75% |
| “Used/refurbished” search growth | +45% YoY |
| Watch-to-buy conversion rate | 15 to 20% |
| Push notification purchase trigger | 10 to 12% of buyers |
| Impulse buy via deals | 25% of buyers |
| Cross-border buyer share | 65% of buyers |
eBay Listings And Product Count Breakdown

(Source: 3dsellers.com)
- Total live listings are estimated at 2.3 billion, showing a 15% YoY increase over the past year and reflecting consistent seller growth.
- Active daily new listings average around 130 to 150 million, driven by automatic relisting and seasonal inventory updates.
- Of all listings, approximately 65 to 70% are fixed-price “Buy It Now”, while 30 to 35% are auction-style, showing the evolution toward instant-purchase formats.
- Around 30% of listings include free shipping, which often generates a 20% higher purchase conversion due to buyer preference.
- Listings with multiple shipping options (3+ choices) see about 18% higher sales velocity, demonstrating the value of flexibility.
- Pictures per listing average about 4 to 5 images, with richer visual content leading to 5 to 7% higher sell-through rates.
- Listings in top growth categories, trading cards have increased by 20 to 25% YoY, far outpacing overall listing growth.
- Average listing duration (time until sale or expiry) is about 6 to 8 days, with faster turnover in high-distance categories like electronics.
- Roughly 15 to 20% of listings are cross-listed across multiple country domains, allowing sellers to tap into global demand.
- Best-placed listings (with strong keywords, clear visuals, and low enough prices) sell 2 to 3× faster than the platform average, driven by seller optimization.
| Metric | Value / Insight |
| Live listings | 2.3 billion (total) |
| Daily new listings | 130 to 150 million |
| Fixed-price vs. auction split | 65 to 70% fixed, 30 to 35% auction |
| Listings offering free shipping | 30% |
| Listings with 3+ shipping options | 18% higher velocity |
| Average images per listing | 4 to 5 images |
| Growth in key category listings | 20 to 25% YoY |
| Average listing lifespan | 6 to 8 days |
| Cross-listed listings (multi-market) | 15 to 20% |
| Optimized listings sell faster | 2 to 3× faster |
eBay’s Advertising and Promoted Listings Revenue

(Source: statista.com)
- eBay’s advertising income primarily from Promoted Listings and Promoted Listings Advanced was $418 million in Q1 2025, growing 14% YoY (FX-neutral).
- Paid promotions now account for about 2.4% of GMV, indicating sellers’ increased investment in visibility and sales acceleration.
- The share of revenue from advertising (vs. listing and final value fees) has risen by about 1% over 3 years, highlighting ad services as a major growth lever.
- The average fee for a Promoted Listing is around 1.5 to 3% of the final sale price, determined by bidding in an auction for placement slots.
- Sellers using promoted ads earn about 25% higher sell-through rates, often selling faster and at higher realized prices.
- About 50% of top-tier sellers regularly use promoted listings, compared to 20 to 25% of casual sellers, showing adoption by established merchants.
- Mobile app placements generate 10% better conversion on promoted listings than desktop placements, underlining the importance of mobile-first ad strategies.
- Sponsored upgrades on Best Match and category-specific tiers have helped reduce listing wasted impressions by 15%, enhancing ROI.
- Promoted listings deliver click-through rates of 3 to 4%, compared to the default listings’ 0.8 to 1.2%, making them several times more effective.
- eBay continues to test new ad formats, including banners and native ads on search results pages, to expand its advertising monetization beyond performance-based listings.
| Ad Metric | Value / Insight |
| Q1 2025 ad revenue | $418 million (+14% YoY) |
| Ad spend as % of GMV | 2.40% |
| Promoted listing fee range | 1.5 to 3% of the sale price |
| Sell-through rate uplift | 25% higher |
| Usage by seller type | Top sellers 50%, casual 20 to 25% |
| Mobile vs. desktop conversion uplift | 10% better mobile |
| Improved impressions from upgrades | 15% fewer wasted views |
| Promoted listing CTR | 3 to 4% |
| Regular listing CTR | 0.8 to 1.2% |
| New ad formats | Banner/native ads in testing |
eBay Shipping and Logistics Statistics
(Source: milliemince.github.io)
- eBay buyers receive items within 6 business days on average, although top priority shipping options are available in under 3 days for domestic US shipments.
- Free shipping listings represent about 30% of all listings, and those listings convert 20% more than those without, showing buyer preference for zero shipping cost.
- International shipping services account for around 25% of GMV, facilitated by partnerships with global carriers and eBay’s Global Shipping Program (GSP).
- The GSP handled roughly 10% of total GMV through cross-border transactions, enabling sellers to ship to the U.S. to a domestic hub, which then handles international forwarding.
- eBay’s return policy requires sellers to accept returns within 30 days, with about 8 to 9% of purchases returned on average, depending on the category.
- eBay released initiatives to reduce delivery delays, including ‘estimated delivery dates’ on 50% of listings, which improved buyer confidence.
- Tracking coverage reaches 85 to 90% of shipped packages, with real-time updates driving clarity and reducing inquiries for sellers.
- Discounts negotiated through the Global Shipping Program result in shipping costs 10 to 20% lower than standard rates for cross-border volumes.
- International Sellers using GSP see 20% fewer shipping issues (lost/damaged) due to eBay-managed inspections and processes.
- eBay has partnered with regional logistics providers in bottom-tier markets (e.g., Africa, Southeast Asia), improving delivery infrastructure and reducing transit times by 10 to 15%.
| Shipping Metric | Stat / Insight |
| Avg. delivery time (domestic US) | 6 business days |
| Free-shipping listings | 30% |
| International GMV share | 25% |
| GSP GMV involvement | 10% |
| Return rate overall | 8 to 9% |
| Tracking coverage | 85 to 90% |
| GSP shipping cost savings | 10 to 20% off standard cross-border rates |
| Shipping issue reduction via GSP | 20% fewer issues |
| Delivery estimate coverage | 50% of listings |
| Regional logistics partnerships | 10 to 15% transit time improvement |
eBay Small Business and Independent Seller Growth

(Source: ebayinc.com)
- Over 31% of GMV in 2024 originated from U.S. small businesses, with a similar share internationally, highlighting strong performance among SMEs.
- U.S. small business GMV grew roughly 20% YoY in Q1 2025, while global small business GMV increased by about 18%, driven by expansion in focus categories.
- Independent sellers (part-time or a few employees) make up around 70% of all sellers, collectively contributing 25 to 30% of GMV, with growth fueled by social media integrations.
- Multi-channel sellers (those selling on eBay then shifting to Amazon or Shopify) often see their eBay revenue grow by 12 to 15% annually, leveraging cross-platform presence.
- Sellers using business tools (Promoted listings, automated repricing, listing automation) experience an average 30 to 35% higher revenue growth than novices.
- The number of “Outstanding” badge holders (top-rated sellers) grew by 8% YoY, with these sellers capturing 40% more sales due to trust signals.
- Sales from independent creators and handmade products rose 22% YoY, as consumers continue to seek personalized, unique items.
- Seller education programs (eBay Seller School, webinars) have increased attendance by 50% YoY, boosting listing effectiveness and platform navigation.
- The average e-commerce revenue for micro-businesses on eBay is around $60 to 80k annually, but those scaling to 3-4 person teams often reach $500k+ in GMV.
- Emerging markets (Southeast Asia, India, South America) saw small business GMV grow 25 to 30% faster YoY compared to mature markets due to rising internet access and e-commerce adoption.
| Metric | Value / Insight |
| US small business GMV share | 31% of total GMV |
| US small business GMV growth | +20% YoY |
| Independent sellers share | 70% of sellers, 25 to 30% of GMV |
| Multi-channel sellers’ eBay growth | +12 to 15% YoY |
| Business tool usage uplift | +30 to 35% revenue growth |
| Top-rated badge growth | +8% YoY |
| Handmade products growth | +22% YoY |
| Seller education attendance | +50% YoY |
| Micro-business annual GMV | $60 to 80k |
| Teamed seller GMV | $500k+ annually |
| Emerging market small business GMV | 25 to 30% faster growth |
eBay Motors and Auto Parts Performance

(Source: hedgescompany.com)
- The Motors category accounts for roughly 12% of overall GMV, driven by car parts, accessories, and collectible vehicles, highlighting its status as a strong vertical.
- The auto parts subcategory includes over 400 million parts listings, with 30 to 40% of this catalog cross-listed internationally due to universal demand.
- Power users in motors (large-scale parts resellers and dismantlers) list thousands of parts regularly, and the top 1% of motor sellers make up 35 to 40% of motor GMV.
- Average order value in Motors is high $85 to 120compared to the platform average, due to higher-priced parts and accessory items.
- The Motors category saw 8% GMV growth YoY in 2024, outpacing general platform growth, fueled by DIY vehicle maintenance and classic car restorations.
- Listings turnover in Motors is strongparts sell in 7 to 9 days on average, quicker than most general categories, showing consistent demand flow.
- eBay offers Advanced Vehicle Parts Compatibility that helps buyers find parts based on vehicle VIN, contributing to 20% fewer return requests.
- The Global Shipping Program coverage of motor parts is limited (about 10% participation) due to shipping regulations, but where used, it enables cross-border sales.
- Promotional activities like “Parts & Accessories Day” initiatives have driven monthly sales spikes of 12 to 15% and increased new seller sign-ups by 18%.
- Deleted/damaged parts sell at a significant discount, with average selling prices 25 to 30% below new prices, meeting buyer interest in budget repair and restoration.
| Metric | Value / Insight |
| Motors GMV share | 12% of total GMV |
| Parts listing count | 400 million |
| Top 1% motor seller share | 35 to 40% of motors’ GMV |
| Avg. motors order value | $85 to 120 |
| Motors GMV growth YoY | 8% |
| Listing turnover time | 7 to 9 days avg. |
| Parts compatibility tool | 20% fewer returns |
| GSP coverage in motors | 10% participation |
| Parts sale discount (used) | 25 to 30% below new prices |
| Category-specific promo uplift | 12 to 15% monthly GMV growth |
Environmental and Sustainability Statistics from eBay

(Source: ebayinc.com)
- Over 86% of eBay shoppers cite sustainability and reuse as their primary reason for purchasing pre-owned, demonstrating that “green” motivations drive platform usage.
- eBay estimates that buying used items avoids 63 million metric tonnes of CO₂eq (carbon dioxide equivalent) emissions annually, comparable to taking over 13 million cars off the road.
- In 2024, the sale of refurbished electronics increased by 18% YoY, reducing the need for new production and preventing e-waste.
- Seller participation in the eBay for Change program grew 30% in 2024, helping sellers donate proceeds to charitable and environmental causes.
- eBay’s global packaging innovations include promoting recyclable packaging materials and reusable mailers, with 25% of sellers adopting eco-packaging options.
- Listings with keywords like “sustainable”, “upcycled”, or “eco-friendly” have nearly doubled in two years, representing about 5 to 6% of total listings.
- eBay’s Filters (e.g., “Pre-owned”, “Open box”) are used in 20% of category searches, empowering buyers focused on reuse and better pricing.
- The “eBay Refurbished” program generated $1.2 billion GMV in 2024, offering warranty-backed warranties that reduce buyer concerns.
- In Q1 2025, the sale of reused fashion items grew 22% YoY, supporting circular fashion practices and reducing textile waste.
- eBay partners with non-profits and NGOs on sustainability awareness campaigns, which generated $5 million in proceeds in 2024, giving back to community initiatives.
| Sustainability Stat | Value / Impact |
| Shoppers citing sustainability | 86% of users |
| CO₂ emissions avoided annually | 63 million metric tonnes |
| Refurbished electronics GMV growth | +18% YoY |
| eBay for Change seller growth | +30% YoY |
| Eco-packaging adopters | 25% of sellers |
| Sustainable listing growth | Doubled, 5 to 6% of listings |
| Filter usage (“Pre-owned” etc.) | 20% of searches |
| eBay Refurbished GMV | $1.2 billion |
| Reused fashion growth | +22% YoY |
| NGO proceeds via campaigns | $5 million in 2024 |
Year‑On‑Year Trends and Projections for eBay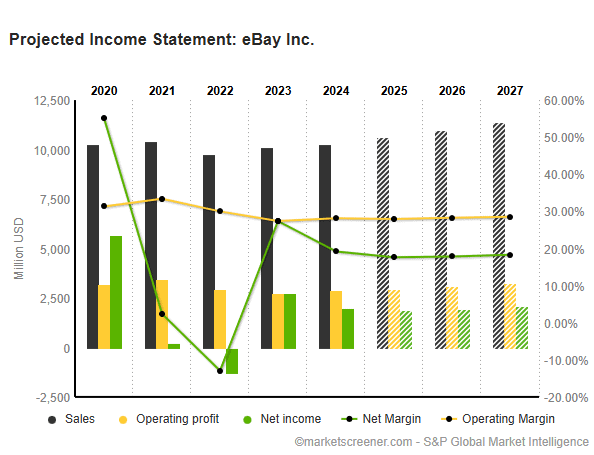
(Source: marketscreener.com)
- Buyer growth trend remains modest at 1 to 2% YoY, indicating a mature market with a stable user base; new buyers are balancing casual attrition.
- GMV growth is projected at 2 to 4% YoY through 2026, fueled by expansion in high-growth categories like tech refurbish, collectibles, and cross-border trade.
- Seller adoption of advanced tools and promoted listing engagement is projected to grow by 15 to 20% YoY, increasing monetization of each transaction.
- Mobile GMV share is expected to cross the 70% threshold by 2026, driven by younger demographics choosing apps for convenience.
- Ad revenue for Promoted Listings is forecasted to grow 12 to 15% annually as more sellers compete for visibility.
- Sustainability and refurbished categories will likely account for 20 to 25% of total GMV by 2026, following ongoing customer demand.
- eBay expects to reduce average delivery times to 4 to 5 days domestically via logistics partnerships and smart routing solutions.
- International cross-border GMV is projected to reach 30% of total GMV by 2027, backed by improvements in GSP and localized shipping.
- Net margin is expected to remain strong around 18 to 20%, thanks to stable fee structures and scalable operational efficiencies.
- The company may expand into new verticals such as digital collectibles (NFTs), home services, and refurbished subscription offerings as testing grows.
- eBay is forecasting share buybacks and dividends of $3 billion annually through 2026, maintaining shareholder returns.
- AI-enabled listing recommendations, smart pricing tools, and personalization features are expected to improve user engagement and drive a 2 to 3% uplift in conversions.
- Overall annual revenue growth is projected at 3 to 5%, targeting $11 to $ 12 billion by the end of 2026, assuming macroeconomic stability.
| Metric / Trend | Projection (By 2026 to 2027) |
| Buyer growth | +1 to 2% annually |
| GMV growth | +2 to 4% annually |
| Promoted Listings and revenue growth | +12 to 15% annually |
| Mobile GMV share | 70% of total GMV |
| Sustainability GMV share | 20 to 25% of the total |
| Domestic delivery time (US) | 4 to 5 business days |
| Cross-border GMV share | 30% of total GMV |
| Net margin | 18 to 20% |
| Revenue target | $11 to 12B by 2026 |
| Shareholder returns | $3B annually |
| AI-based feature impact | +2 to 3% conversion uplift |
Conclusion
If there’s one thing all these eBay statistics show, it’s this: eBay is far from slowing down. The platform continues to attract millions of buyers, support millions of sellers, and generate billions in sales every year. From listing volumes to top-selling categories, every number reveals how strong and active the eBay marketplace still is in 2025.
These eBay statistics don’t just show growth; they help you understand where the opportunities lie. Whether you’re selling sneakers or sourcing vintage collectibles, knowing the data gives you an edge. And now, you’ve got all the key numbers at your fingertips. Thanks for staying up until this very end.
FAQ.
You should watch metrics like active buyers (134M+ as of Q1 2025), seller counts (18 to 20M), gross merchandise volume ( to $74B in 2024), and top categories (electronics to 28% of GMV) because together, these numbers shape strategy and opportunity.
As of early 2025, there are around 2.3 billion live listings, growing roughly 15% year-on-year, spanning everything from refurbished gadgets to collectibles and homeware.
Roughly 60 to 64% of eBay’s GMV is generated via mobile app or mobile browsing, underscoring the critical importance of mobile-optimized listings.
The leading categories include Electronics ( to 28% GMV share), Fashion ( to 17%), Home & Garden ( to 14%), and Motors & Auto Parts (12%), plus fast-growing segments like trading cards and refurbished tech.
There are approximately 134 million active buyers and 18 to 20 million active sellers, giving a buyer-to-seller ratio of around 7 to 8:1.
In 2024, eBay earned about $10.3 billion in revenue, with a take rate of roughly 13.8% of GMV. Non‑GAAP EPS was $1.38, and net income margin hovered near 18 to 20%.
Cross-border trade makes up approximately 25 to 30% of overall GMV, with international buyers representing nearly half of global activity outside the U.S.
Independent and small business sellers contribute roughly 25 to 30% of GMV, with U.S. small business GMV growing around 20% YoY, and independent creators growing to 22%.
Promoted Listings generated about $418M in Q1 2025, up to 14% YoY, representing around 2.4% of GMV and giving sellers an average sales uplift of approximately 25%.
Projected stats suggest GMV growth of 2 to 4% annually, rising mobile usage past 70%, increasing promoted listings adoption, and sustainability-focused categories comprising 20 to 25% GMV by 2026.

Joseph D'Souza founded ElectroIQ in 2010 as a personal project to share his insights and experiences with tech gadgets. Over time, it has grown into a well-regarded tech blog, known for its in-depth technology trends, smartphone reviews and app-related statistics.