Ford Statistics By Revenue Growth And Challenges (2026)
Updated · Mar 27, 2026


Table of Contents
- Introduction
- Editor’s Choice
- Ford Segment Performance Breakdown 2025
- Ford Profit Growth Amid Volatility and Shareholder Value Signals
- Ford Cash Flow Performance 2025
- Best-selling Cars
- Ford’s Entry-Level Trucks Drive Volume Expansion
- Ford Truck Dominance 2025
- Ford’s Multi-Segment Growth Engine
- The 2026 Outlook
- Conclusion
Introduction
Ford Statistics: Ford Motor Company stands as a leading global car manufacturer, which currently faces a challenging process of changing from gasoline-powered vehicles to electric vehicle technology. The 2025–2026 period highlights a mixed yet strategically important phase for Ford, which shows record revenue growth and increased hybrid demand, and experiences major electric vehicle financial difficulties. Ford achieved strong U.S. sales and commercial vehicle growth despite facing tariff and, restructuring costs, and macroeconomic challenges.
Ford establishes its new long-term strategy through its focus on profitability, cost management, and hybrid development. The following statistical analysis provides a comprehensive, data-driven overview of Ford’s financials, sales performance, and future outlook.
Editor’s Choice
- Ford Motor Company’s Ford Blue revenue decreased by 1% to reach USD 101.0B, and its EBIT dropped to USD 3.02B, which resulted in a margin decline to 3.0%.
- Ford Model e revenue increased by 73% to reach USD 6.7B, but its EBIT losses extended further to reach –USD 4.81B.
- Ford Pro produced USD 66.3B in revenue while achieving a strong EBIT of USD 6.84B and a 10.3% margin.
- The latest period showed net income growth from –USD 8.2B to USD 6.8B, which then stabilized at USD 4.35B.
- Basic EPS recovered from -2.06 to 1.48 before stabilizing at 1.09.
- Operating cash flow increased to USD 21.28B in 2025 from USD 15.42B in 2024.
- The company reported a free cash flow decrease to USD 3.51B, which resulted from its substantial capital expenditures.
- The free cash flow for Q4 2025 reached -USD 2.14B because of excessive operational expenses.
- Ford Maverick sales achieved 155,051 units sold annually and experienced a Q4 sales increase of 54.2%.
- Ford Ranger sales grew by 53.6% compared to the previous year to reach 70,960 units.
- Ford F-Series reported sales of 828,832 units, which represented an 8.3% increase, thus preserving its market leadership in the United States.
- The company sold 84,113 units of electric vehicles, which included 51,620 units of Mustang Mach-E.
- Ford Explorer sales increased by 14.7% to reach 222,706 units.
- Bronco franchise sales increased by 19.9% to reach 280,500 units, which demonstrates the strong demand for SUVs.
- The company expects its 2026 EBIT to range between USD 8B and USD 10B, which represents a recovery from its USD 6.8B performance in 2025.
Ford Segment Performance Breakdown 2025
(Source: q4cdn.com)
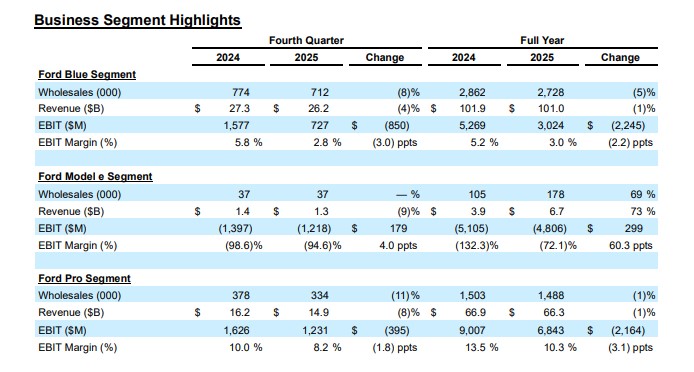
- The financial outcomes of Ford Motor Company demonstrate a combination of positive and negative results, which their three main business divisions, Ford Blue, Ford Model e, and Ford Pro, show in their current transition plan.
- The Ford Blue segment, which focuses on traditional ICE operations, displays revenue stability yet encounters margin difficulties.
- The company achieved full-year revenue of USD 101.0B, which represented a 1% decrease from the previous year, while its EBIT dropped from USD 5.27B to USD 3.02B, resulting in a margin decline from 5.2% to 3.0%.
- The company experienced this outcome because its pricing returned to normal levels while costs increased, and customers shifted toward other competitors despite wholesale volume remaining mostly unchanged, with a 5% decrease.
- The Ford Model e segment, which operates as the EV division, shows strong revenue growth yet maintains ongoing financial losses.
- Revenue surged 73% YoY to USD 6.7B, supported by a 69% increase in wholesale volumes, signalling aggressive EV scaling.
- The company expanded its EBIT negative position to reach -USD 4.81B, while its operational losses stood at -72.1%, which indicated major expense challenges from both capital investments and battery expenditures, while also facing performance difficulties during its initial development phase, which directly affected its electric vehicle profitability.
- Ford Pro achieves its position as the top performer in commercial vehicle operations, which establishes its position as a main driver of company earnings.
- The company experienced a revenue decline of 1%, which resulted in total earnings of USD 66.3B, yet maintained a strong financial performance with EBIT of USD 6.84B and a 10.3% profit margin.
- The segment supports Ford’s commercial ecosystem strategy through its three main components, which include fleet demand, software services, and high-margin recurring revenue streams.
- Ford’s financial results demonstrate an unbalanced strategic approach because legacy ICE and commercial segments deliver cash flow to the company while its electric vehicle investments create substantial financial burdens.
(Source: q4cdn.com)
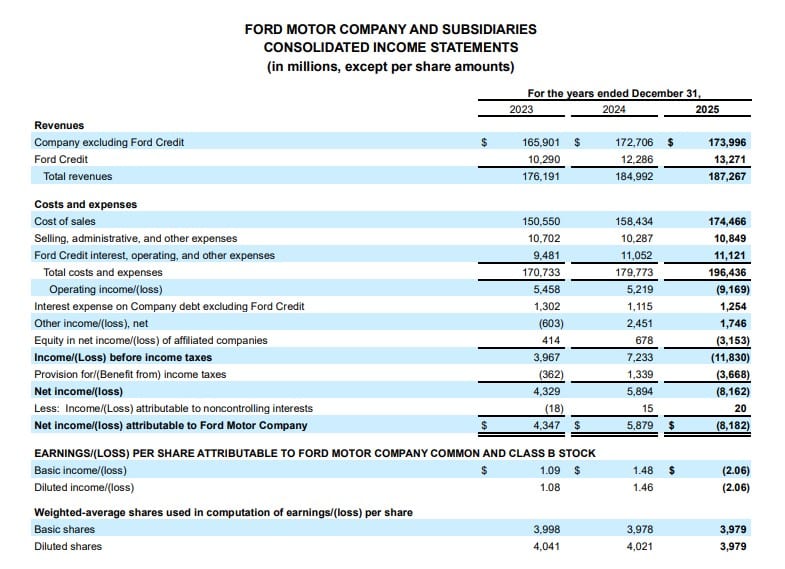
- The financial performance of Ford Motor Company shows both stable current results and future growth potential because of economic factors and the company’s operational performance across its different business divisions.
- The financial snapshot shows net income results, which shifted from a previous period loss of USD 8.2 billion to a current profit of USD 6.8 billion, although it decreased to USD 4.35 billion in the most recent year.
- The company’s ability to bounce back from extreme financial losses shows evidence of its operational resilience, which stems from its restructuring efforts, electric vehicle development, and its response to economic challenges.
- The trend receives confirmation through earnings per share (EPS), which serves as a vital profitability measure. Basic EPS improved significantly from -2.06 to 1.48, before settling at 1.09, while diluted EPS followed a similar path (from -2.06 to 1.46 to 1.08).
- The business experienced a strong earnings recovery, which later reached normalized levels because the company achieved positive profitability, yet faced challenges from rising expenses and decreasing profit margins.
- The stabilization of EPS above USD 1.00 provides a favorable indication for both shareholder value and the ability to maintain dividend payments.
- The company’s capital structure shows that weighted-average shares outstanding stayed mostly constant, as basic shares reached approximately 3.98 billion and diluted shares reached approximately 4.04 billion.
- Investors benefit from the limited equity dilution because it maintains both earnings quality and the fundamental growth of per-share value.
- The limited effect of noncontrolling interests shows through their minimal presence because they produced adjustments between USD 15M and USD 20M.
- The majority of earnings directly belong to Ford shareholders, which improves financial reporting transparency and builds investor confidence in the company’s financial standing.
- The fundamental business operations of the company maintain control over its earnings fluctuations, which remain an ongoing structural problem.
- The company achieved its first profitable quarter after suffering multi-billion-dollar losses because of its exposure to electric vehicle conversion expenses, supply chain disruptions, and worldwide market changes. The ongoing factors will maintain their impact on both net income stability and operating efficiency for the company.
- Ford establishes its earnings model through three distinct phases, which show its ability to bounce back from setbacks until it reaches its current state of partial earnings stabilization.
- Ford’s financial situation currently depends on five main factors, which include net income growth, EPS recovery, earnings volatility, shareholder value, and financial stability.
- The company uses its financial resources to support its transformation efforts while maintaining its dedication to achieving profitable results, which will help it succeed in the future, although its profits will experience temporary drops.
Ford Cash Flow Performance 2025
(Source: q4cdn.com)
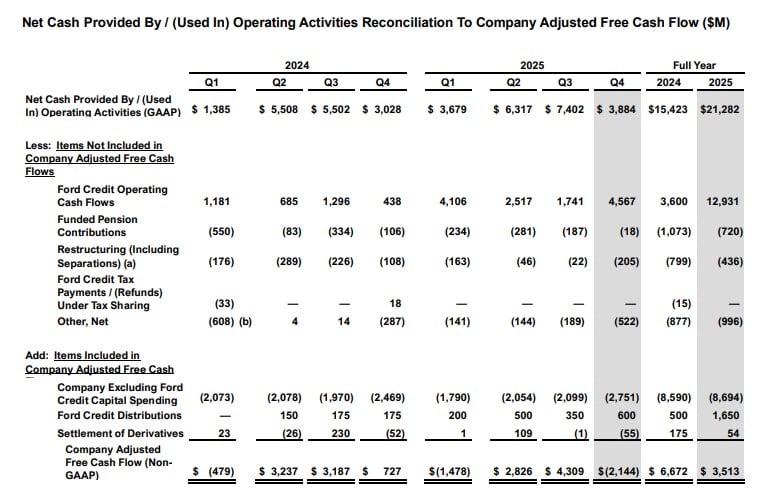
- Ford Motor Company shows strong operational cash flow performance during 2025, yet its adjusted free cash flow performance remains unpredictable because its transformation strategy requires heavy capital expenditures.
- The first quarter net cash from operating activities under GAAP rules reached USD 21.28 billion for 2025, which marked a major boost from the USD 15.42 billion level in 2024.
- The company achieved strong quarterly results, which reached their highest point of USD 7.40 billion during Q3 2025.
- The company achieved this through better working capital management, improved collection processes and steady demand in the main business areas.
- Ford maintains sufficient operational cash flow to support its investment projects while handling debt obligations and continuing dividend payments.
- The operating cash flow of Ford Credit increased to USD 12.93 billion in 2025 after rising from USD 3.60 billion in 2024.
- The company encountered greater liquidity because of increased financing operations, although this situation made them more vulnerable to credit market risks.
- The organization maintains high capital expenditures, with credit capital investments reaching approximately USD 8.69 billion, which shows their commitment to developing electric vehicle charging stations, digital systems, and new manufacturing technologies.
- The company’s free cash flow performance shows the results of these financial expenditures. Free cash flow dropped to USD 3.51 billion in 2025 because operating cash flow remained strong when compared to 2024’s USD 6.67 billion level.
- The company experienced major quarterly fluctuations because Q4 2025 showed negative free cash flow results of -USD 2.14 billion, which happened because of cash inflow timing problems and extensive investment activities.
- The company faced extra financial burdens because it had to pay pension expenses, which reduced its budget by USD 720 million, and it incurred restructuring costs that decreased its financial resources by USD 436 million.
- The company experienced cash flow instability because its “other net” items showed a decrease of USD 996 million, which resulted from non-essential financial changes.
- Ford’s financial standing shows a distinct separation between its operational performance and the cash spent on investments.
- The company shows three financial strengths through its rising operating cash flow, strong liquidity position, and effective capital spending practices, while free cash flow reduction and quarter-to-quarter financial fluctuations create short-term monetary challenges.
Best-selling Cars
(Reference: statista.com)
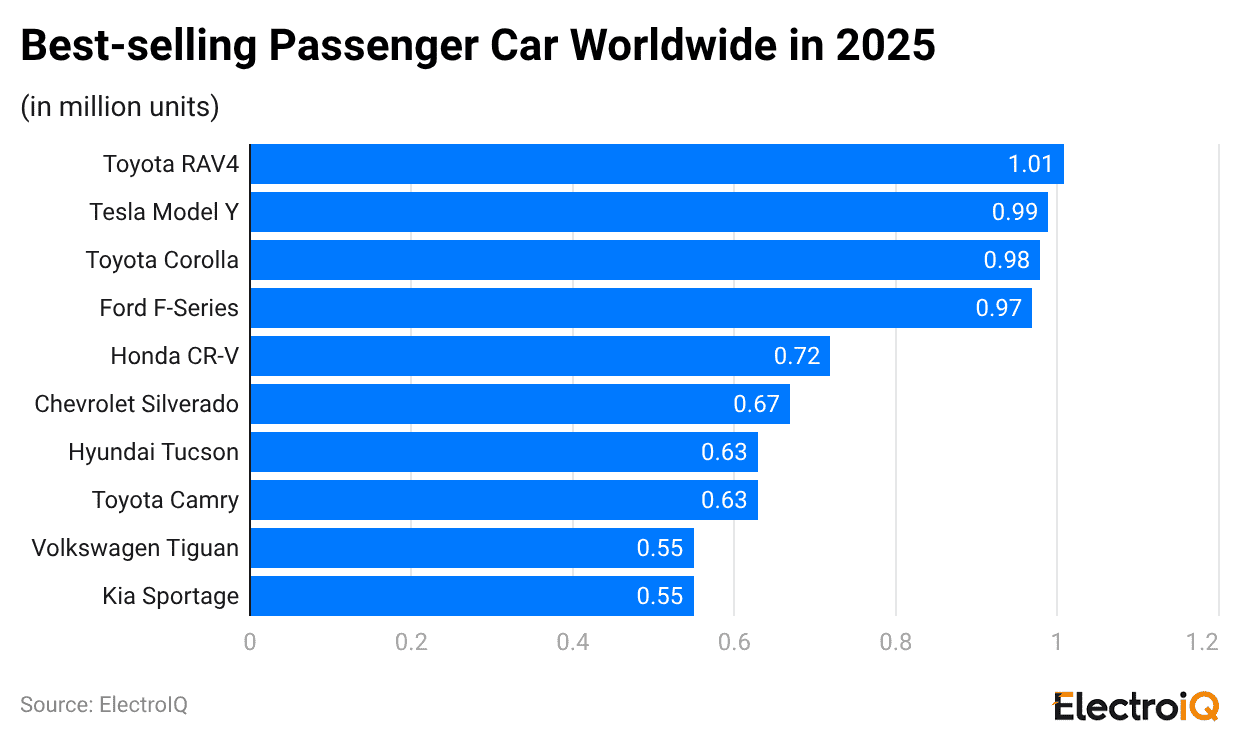
- The chart compares performance across major automotive brands to show brand strength, product distribution, and customer purchasing tendencies.
- The Honda CR-V leads the ranking with a score of 0.72, reinforcing its dominance in the compact SUV segment, driven by strong reliability, fuel efficiency, and consistent global demand.
- The Chevrolet Silverado follows closely behind with a 0.67 rating, demonstrating how pickup trucks maintain their market strength, especially in North America, through their utility and towing capacity and fleet requirements.
- The Hyundai Tucson and Toyota Camry both register 0.63, indicating balanced performance across SUV and sedan categories, with Tucson benefiting from modern design and hybrid options, while Camry continues to leverage its legacy of reliability and efficiency.
- The Volkswagen Tiguan trails behind because increasing competition in the SUV market requires companies to establish their unique value through pricing models, advanced technology, and electric vehicle development.
- The performance spread between 0.63 and 0.72 creates a highly competitive situation, which reduces performance differences between competitors because brand perception, innovation and customer experience have become critical success factors.
Ford’s Entry-Level Trucks Drive Volume Expansion
- Ford Motor Company uses low-priced products to attract customers who want affordable trucks, which helps the company gain market share in the entry-level truck market.
- The combined sales of entry trims for Maverick Ranger and Bronco Sport showed a 41.3 % increase during Q4, which indicates customers now prefer value-focused vehicles because of economic challenges.
- The Ford Maverick serves as an essential growth engine because it achieved record sales of 34,147 units in Q4, which represents a 54.2% increase compared to the previous year, and it sold 155,051 units throughout the entire year, which confirms its status as the least expensive truck in the United States.
- The basic XL trim packages experienced a 105.1% growth rate during Q4 because customers displayed high sensitivity to product prices, while the mid-range XLT package experienced a 68.8% growth rate because customers showed equal interest in products with different price ranges.
- The Ford Ranger achieved 53.6% annual growth through 70,960 unit sales, while entry-level XL sales grew 82.3% annually and surpassed premium variant sales.
Ford Truck Dominance 2025
- Ford Motor Company maintains its position as the leading U.S. truck manufacturer because it offers multiple engine options, maintains diverse product lines, and possesses strong brand recognition.
- The Ford F-Series established itself as the primary vehicle of this distribution network, which sold 828,832 units during 2025, reflecting an 8.3% increase from the previous year, therefore establishing a market position that will remain unchallenged by its closest competitor, which stands approximately 250,000 units behind.
- The F-150 Hybrid sold 84,934 units, which represents a 15.0% increase from its previous sales record, because consumers increasingly prefer fuel-efficient trucks.
- The Ford Maverick achieved record annual sales of 155,051 units, which it achieved through a 54.2% Q4 increase, because it demonstrated strength in the affordable compact truck market.
- The Ford Transit achieved its highest unit sales since 2014 by reaching 161,797 units, which resulted from increased commercial fleet requirements.
Ford’s Multi-Segment Growth Engine
- Ford Motor Company operates a growth system that combines three business sectors, including its electric vehicle market, SUV leadership, and high-profit off-road vehicle production, to maintain business growth.
- The electric vehicle (EV) market showed its current state when Ford sold 84113 vehicles through its three different vehicle models.
- The Ford Mustang Mach-E remained the flagship with 51620 units, which showed no change from 2024 sales numbers.
- Ford plans to launch its next-generation EV pickup in 2027, which will serve as an essential part of its long-term electrification strategy and platform development.
- The Ford Explorer recorded 222706 units, which represented a 14.7% increase in sales because customers wanted all its trim levels.
- The Ford Expedition also posted 85921 units, which represented a 10.1% increase over its best performance since 2019.
- The Ford Bronco franchise achieved impressive growth, which resulted in 146007 total sales with a 33.7% increase.
- The Bronco family achieved 280500 total sales, which showed a 19.9% increase because customers wanted entry-level trims and lifestyle-oriented SUVs.
- Off-road performance trims serve as essential profitability drivers because they generated 20.6% of total sales, which increased by 2.0 points from the previous year.
- The Raptor models achieved their highest sales numbers, which enabled Ford to maintain its premium pricing power.
The 2026 Outlook
- The strategic recovery phase of Ford Motor Company has begun because the company has reached its lowest point during the past two years of reduced earnings.
- The company expects to achieve USD 8 billion to USD 10 billion in 2026 adjusted EBIT based on its first adjustment, which will bring its USD 6.8 billion 2025 base up between USD 1.2 billion and USD 3.2 billion, although this amount still falls short of the USD 10.2 billion record established in 2024.
- The midpoint calculations show that Ford needs to achieve 5% EBIT margin, which will result from its USD 187.3 billion revenue to reach its 8% margin goal from its current mid-cycle profitability status until 2029.
- The recovery process depends on adjusted free cash flow, which the company expects to reach between USD 5 billion and USD 6 billion in 2026 after it increases from USD 3.5 billion in 2025.
- The company will achieve a 60 to 75 % EBIT to cash conversion ratio with these results. This amount, which falls below what asset-light competitors achieve, matches Ford’s capital-heavy production system.
- The company will use this cash to finance USD 9.5 billion to USD 10.5 billion in capital expenditures while maintaining dividends and paying off debts, which will improve its financial strength and ability to control capital.
- The Novelis aluminium plant fire created the most serious operational interruption, which resulted in substantial performance losses.
- The incident created a USD 1.5 billion to USD 2 billion loss in 2025 EBIT and a USD 2 billion to USD 3 billion loss in FCF because it caused a decrease in F-Series production, which generates 35 to 40% of North American EBIT.
- The recovery process will use alternative sourcing methods, which require USD 1.5 billion to USD 2 billion in costs and production increases of 50,000 units, which will result in USD 1 billion in net EBIT advantages throughout 2026.
- The financial results of Ford demonstrate extreme income distribution that exists across different business divisions. The Ford Pro division is projected to produce between USD 6.5 billion and USD 7.5 billion in EBIT, which will account for 65 to 75% of total earnings because of its high-profit commercial vehicle production and software service operations.
- The Ford Blue division (ICE segment) projects earnings between USD 4 billion and USD 4.5 billion, while the Ford Model e division (EV division) operates at a loss, which decreased from USD 4.8 billion to a range between USD 4 billion and USD 4.5 billion.
- The company faces a major problem because it needs to achieve profitability from electric vehicles before reaching its target for expansion.
- The United States Stolling rate assumption of 16 to 165 million vehicles, together with tariff exposure, which will cost approximately USD 1 billion in 2025, creates economic unpredictability.
- Any trade conflict escalation will result in alterations to both cost arrangements and supply distribution networks.
- The organization has decreased expenses by USD 7 billion since 2023 because Ford Pro software revenue will achieve USD 2 billion by 2026, which will increase customer value throughout their entire relationship with the company by 15 to 20 %.
Conclusion
Ford Motor Company is navigating a difficult period of change, with strong operational cash generation and stable performance across major business units, including Ford Pro and its truck division. The company shows positive results through stable revenue streams and increased vehicle sales, yet it faces profitability challenges because of escalating expenses, its commitment to electric vehicle development, and current economic conditions.
The company faces major financial losses because its electric vehicle business unit continues to incur substantial losses, creating operational obstacles to achieving profitable electric vehicle operations. The company’s hybrid approach, together with its cost management efforts and focus on revenue from software technologies, will help Ford achieve gradual progress toward recovery. Ford has entered a phase of sustainable growth because its EBIT forecasts are becoming more positive and its key business areas are currently experiencing strong customer interest.
Sources
FAQ.
Ford projects adjusted EBIT between USD 8 billion and USD 10 billion for 2026
The Ford Model e experienced its USD 4.81 billion loss because of high capital expenditures, battery expenses and difficulties with expansion operations.
Ford Pro generates the highest profits for the company because it produces USD 6.84 billion in earnings before interest and taxes at a 10.3 % profit margin.
The Ford F-Series leads with 828,832 units sold, maintaining U.S. dominance.
Operating cash flow is strong at USD 21.28B, but free cash flow declined to USD 3.51B due to heavy investments.

Maitrayee Dey has a background in Electrical Engineering and has worked in various technical roles before transitioning to writing. Specializing in technology and Artificial Intelligence, she has served as an Academic Research Analyst and Freelance Writer, particularly focusing on education and healthcare in Australia. Maitrayee's lifelong passions for writing and painting led her to pursue a full-time writing career. She is also the creator of a cooking YouTube channel, where she shares her culinary adventures. At Smartphone Thoughts, Maitrayee brings her expertise in technology to provide in-depth smartphone reviews and app-related statistics, making complex topics easy to understand for all readers.


