Garmin Statistics By Revenue, Market Share and Facts (2025)
Updated · Nov 10, 2025

Table of Contents
- Introduction
- Editor’s Choice
- About Garmin
- History of Garmin
- Garmin’s Financial Report (September 27, 2025)
- Garmin Revenue Statistics
- Garmin’s Quarterly Revenue Statistics by Segments
- Garmin Statistics by Total Assets
- By Market Capitalization
- Garmin Connect Data Report Statistics by Body Battery (2024)
- By Sleep Score
- By Stress Score
- By Training Readiness
- By Daily Steps
- Garmin’s Country Statistics by Top Import Sources
- By Top Export Sources
- Top HS Codes Imported by Garmin Corporation, 2025
- Top HS Codes Exported by Garmin Corporation, 2025
- Garmin’s Brand Statistics
- Top Products of Garmin
- Conclusion
Introduction
Garmin Statistics: Garmin is a global technology company renowned for its GPS tools, avionics, fitness watches, and outdoor electronics. This article on Garmin Statistics compiles the most useful numbers to illustrate the company’s performance and its potential direction. We cover revenue, profit, assets, and equity, as well as the team size and product mix. You’ll also see quick notes on unit shipments, market share, and results by region for extra context.
Simple charts and short callouts highlight what changed from last year and why it matters. Whether you follow Garmin as an investor, partner, or customer, these statistics provide a clear snapshot of scale, growth, and momentum, helpful for both quick review and in-depth analysis, including side-by-side views of business segments.
Editor’s Choice
- As of September 30, 2025, Garmin’s revenue was approximately $1.771 billion, representing an 11.66% increase from the same quarter in the prior year.
- Garmin raised its full-year 2025 revenue guidance to approximately USD 7.10 billion.
- The gross margin in the third quarter of 2025 was approximately 59.1%, and the operating margin was around 25.8%.
- Garmin’s marine segment grew by 20% over the same duration, reaching a revenue of roughly USD 267 million.
- On November 4, 2025, Garmin Statistics also reported that the company’s market capitalization was USD 39.52 billion, a decrease of 3.97% from the previous month.
- The company’s “Connect+” premium subscription service was launched in 2025, adding advanced AI-driven health/fitness features.
- Garmin won five CES 2026 Innovation Awards (announced in 2025) for its smartwatches and other tech innovations.
- In the United States, approximately 57% of people familiar with the Garmin brand are users of wearable devices.
About Garmin
- Garmin Ltd. is a public technology company that designs, manufactures, and sells consumer electronics, as well as provides software and online services.
- It began in October 1989 in Lenexa, Kansas, under the name ProNav, and later relocated its operations base to Olathe, Kansas.
- The headquarters is located in Schaffhausen, Switzerland.
- Gary Burrell and Min Kao founded the company, which now serves customers worldwide.
- Its leaders include Cliff Pemble (President & CEO), Min Kao (Chairman), Patrick Desbois (Co-COO), and Brad Trenkle (Co-COO).
- Garmin manufactures products including GNSS receivers, avionics, and wearable devices.
- Its stock trades on the NYSE under the ticker symbol GRMN and is part of the S&P 500 index; its ISIN is CH0114405324.
- For more detailed information, visit garmin.com.
History of Garmin
- 1989 → The company was founded as ProNav in Lenexa, Kansas, by Gary Burrell and Min H. Kao. It was later renamed Garmin.
- 1990 → The GPS 100 marine receiver debuted and received about 5,000 orders at its first trade show.
- 1991 → A manufacturing facility opened in Taiwan and the U.S. Army became the first major customer.
- 1994 → The GPS 155 became the first IFR-certified aviation GPS from the company.
- 1996 → Corporate headquarters moved to Olathe, Kansas.
- 1998 → The GNS 430 avionics unit and the StreetPilot portable car navigator were released, marking expansion in aviation and automotive navigation.
- 2000 → A Cayman Islands holding company was formed to facilitate a U.S. listing and shares began trading on Nasdaq on December 8.
- 2003 → The G1000 integrated cockpit system was announced and the first Forerunner GPS running watches were introduced.
- 2004 → The G1000 entered service following certification and became a widely adopted glass cockpit suite.
- 2010 → Shareholders approved redomestication and the legal domicile moved to Switzerland.
- 2011 → Acquisition of Navigon AG strengthened the automotive and mobile navigation portfolio.
- 2016 → An agreement was signed to acquire DeLorme, adding the inReach satellite messaging technology.
- 2019 → The Tacx indoor-training business was acquired to expand cycling and indoor fitness offerings.
- 2020 → A ransomware incident caused a multi-day outage in July and Firstbeat Analytics was acquired on June 30 to deepen physiological analytics capabilities.
- 2021 → The stock listing transferred from Nasdaq to the New York Stock Exchange on December 7.
- 2023 → The Forerunner line marked 20 years since launch, underscoring the brand position in GPS sports watches.
- 2025 → The company announced the acquisition of MYLAPS to add race-timing and live-tracking capabilities and also introduced a MicroLED smartwatch, positioning the brand at the forefront of display innovation in wearables.
Garmin’s Financial Report (September 27, 2025)
| Metrics | Valuations (USD million) |
|
Revenue |
6,943 |
| Revenue Growth (YoY) |
16.56% |
|
Cost of Revenue |
2,865 |
| Gross Profit |
4,078 |
|
Net Income |
1,571 |
| Net Income Growth |
3.50% |
|
Selling, General & Admin |
1,210 |
| Research & Development |
1,090 |
|
Operating Expenses |
2,300 |
| Operating Income |
1,778 |
|
Interest & Investment Income |
124.69 |
| Currency Exchange |
-14.6 |
|
Other Non-Operating Income |
8.03 |
| EBT Excluding Unusual Items |
1,896 |
|
Loss on Sale of Investments |
-0.84 |
| Pretax Income |
1,895 |
|
Income Tax Expense |
324.35 |
| Shares Outstanding (Basic) |
192 |
|
Shares Outstanding (Diluted) |
194 |
| Shares Change (YoY) |
0.42% |
|
EPS (Basic) |
8.16 |
| EPS (Diluted) |
8.11 |
|
EPS Growth |
3.11% |
| Free Cash Flow per Share |
6.88 |
|
Dividend per Share |
3.600 |
| Dividend Growth |
20% |
|
Gross Margin |
58.73% |
| Operating Margin |
25.61% |
|
Profit Margin |
22.63% |
| Free Cash Flow Margin |
19.19% |
|
EBITDA |
1,967 |
| EBITDA Margin |
28.33% |
|
D&A for EBITDA |
189.05 |
| EBIT |
1,778 |
|
EBIT Margin |
25.61% |
| Effective Tax Rate |
17.11% |
- Garmin reported USD 6,943 million in total revenue for the period ending September 27, 2025, marking a 16.56% growth from the previous year.
- The cost of revenue was USD 2,865 million, leading to a gross profit of USD 4,078 million.
- The company reported a net income of USD 1,571 million, representing a 3.50% year-over-year increase.
- Operating expenses reached USD 2,300 million, consisting of USD 1,210 million in selling, general, and administrative costs, and USD 1,090 million in research and development.
- Operating income stood at USD 1,778 million, supported by a strong operating margin of 25.61%.
- The firm earned USD 124.69 million from interest and investment income, while currency exchange fluctuations resulted in a loss of USD 14.6 million.
- Other non-operating income totaled USD 8.03 million, and losses on the sale of investments were minimal at USD 0.84 million.
- Pretax income reached USD 1,895 million, after considering all non-operating items.
- The income tax expense was USD 324.35 million, bringing the effective tax rate to 17.11%.
- Garmin reported 192 million basic shares and 194 million diluted shares outstanding, with a 0.42% increase in shares compared to the previous year.
- Earnings per share (EPS) stood at USD 8.16 on a basic basis and USD 8.11 on a diluted basis, indicating an EPS growth of 3.11%.
- Free cash flow per share was USD 6.88, while the dividend per share increased to USD 3.60, showing a 20% growth.
- The company maintained a gross margin of 58.73%, a profit margin of 22.63%, and a free cash flow margin of 19.19%, demonstrating efficient cost management.
- EBITDA amounted to USD 1,967 million, translating into an EBITDA margin of 28.33%.
- Depreciation and amortization charges were USD 189.05 million, keeping EBIT aligned with operating income at USD 1,778 million.
Garmin Revenue Statistics
 (Source: macrotrends.net)
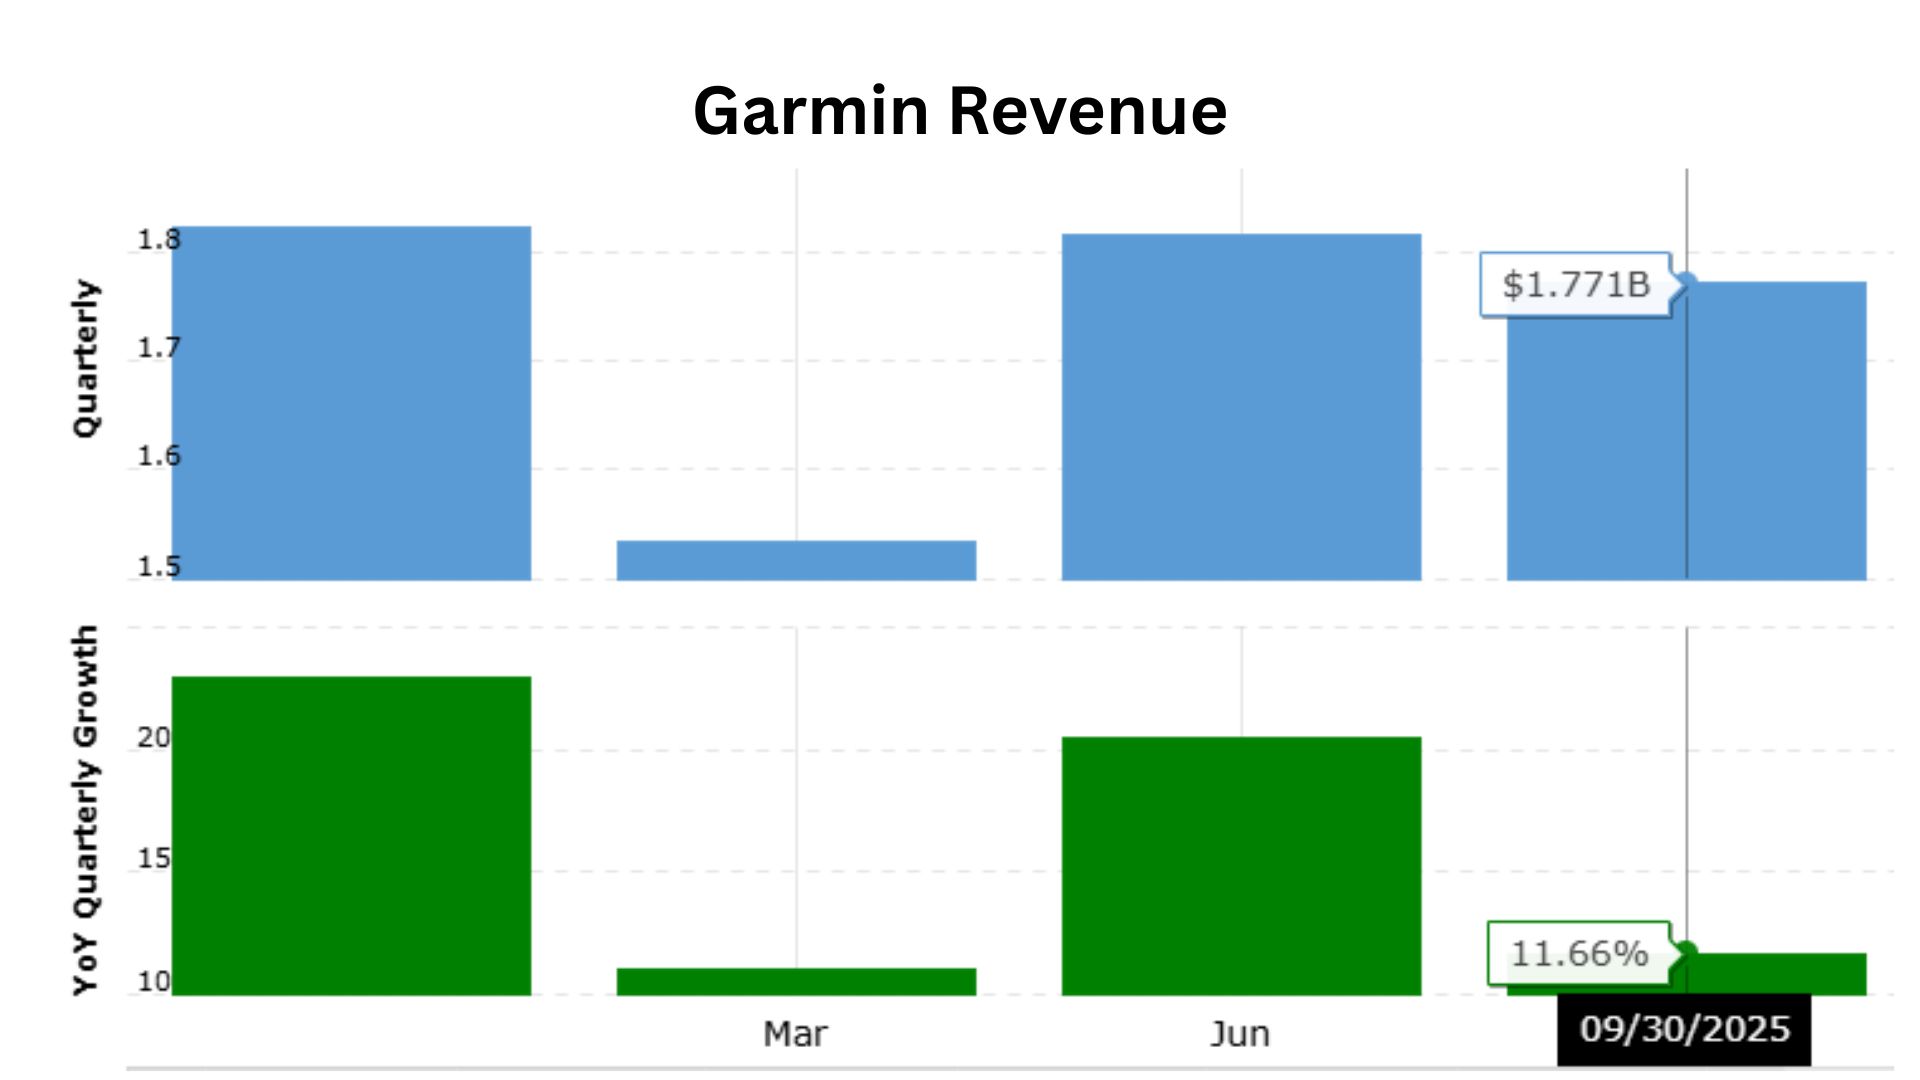
- As of September 30, 2025, Garmin generated total revenue of about USD 1.771 billion, marking an 11.66% rise compared to the same period in 2024.
- During Q2 2025, Garmin reported revenue of USD 1.815 billion, representing a 20.44% year-over-year increase.
- In Q1 2025, the company achieved USD 1.535 billion in revenue, showing a growth of 11.07% compared with the first quarter of 2024.
- For Q4 2024, revenue reached USD 1.823 billion, representing a strong 22.93% year-on-year increase.
| Quarter | Revenue (USD billion) | YoY (Growth Rate) |
| Q2, 2025 | 1.815 | +20.44% |
| Q1, 2025 | 1.535 | +11.07% |
| Q4, 2024 | 1.823 | +22.93% |
Garmin’s Quarterly Revenue Statistics by Segments
 (Reference: statista.com)
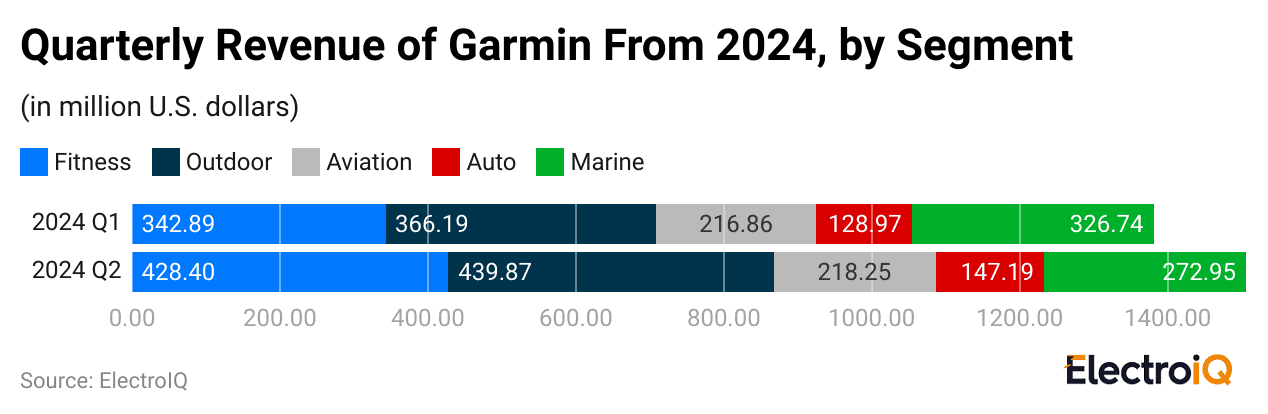
- During Q1 2024, Garmin’s outdoor segment generated the highest revenue, reaching around USD 366.19 million.
- The fitness division followed closely with approximately USD 342.89 million in revenue.
- The marine segment contributed nearly USD 326.74 million, while the aviation business recorded about USD 216.86 million.
- The automotive division registered the lowest among the segments, producing around USD 128.97 million in the same period.
- In Q2 2024, the outdoor segment maintained its lead with revenue rising to USD 439.87 million.
- The fitness division achieved about USD 428.4 million, showing strong demand for wearable and health-tracking devices.
- The aviation business brought in USD 218.25 million, reflecting consistent performance.
- The automotive segment generated around USD 147.19 million, while the marine division reported USD 272.95 million, marking a seasonal decline compared to the previous quarter.
In 2025
| Segments | 13 Weeks Ended | 39 Weeks Ended |
| (September 27, 2025) (in USD Thousand) |
||
| Fitness | 601,013 | 1,591,159 |
| Outdoor | 497,598 | 1,426,451 |
| Aviation | 240,445 | 712,926 |
| Marine | 267,005 | 885,704 |
| Auto OEM | 164,840 | 504,324 |
Garmin Statistics by Total Assets
| Quarter | Total Assets (USD billion) | YoY (Growth Rate) |
| Q3, 2025 | 10.523 | 12.57% |
| Q2, 2025 | 10.324 | 16.22% |
| Q1, 2025 | 9.788 | 13.37% |
| Q4, 2024 | 9.631 | 11.94% |
By Market Capitalization
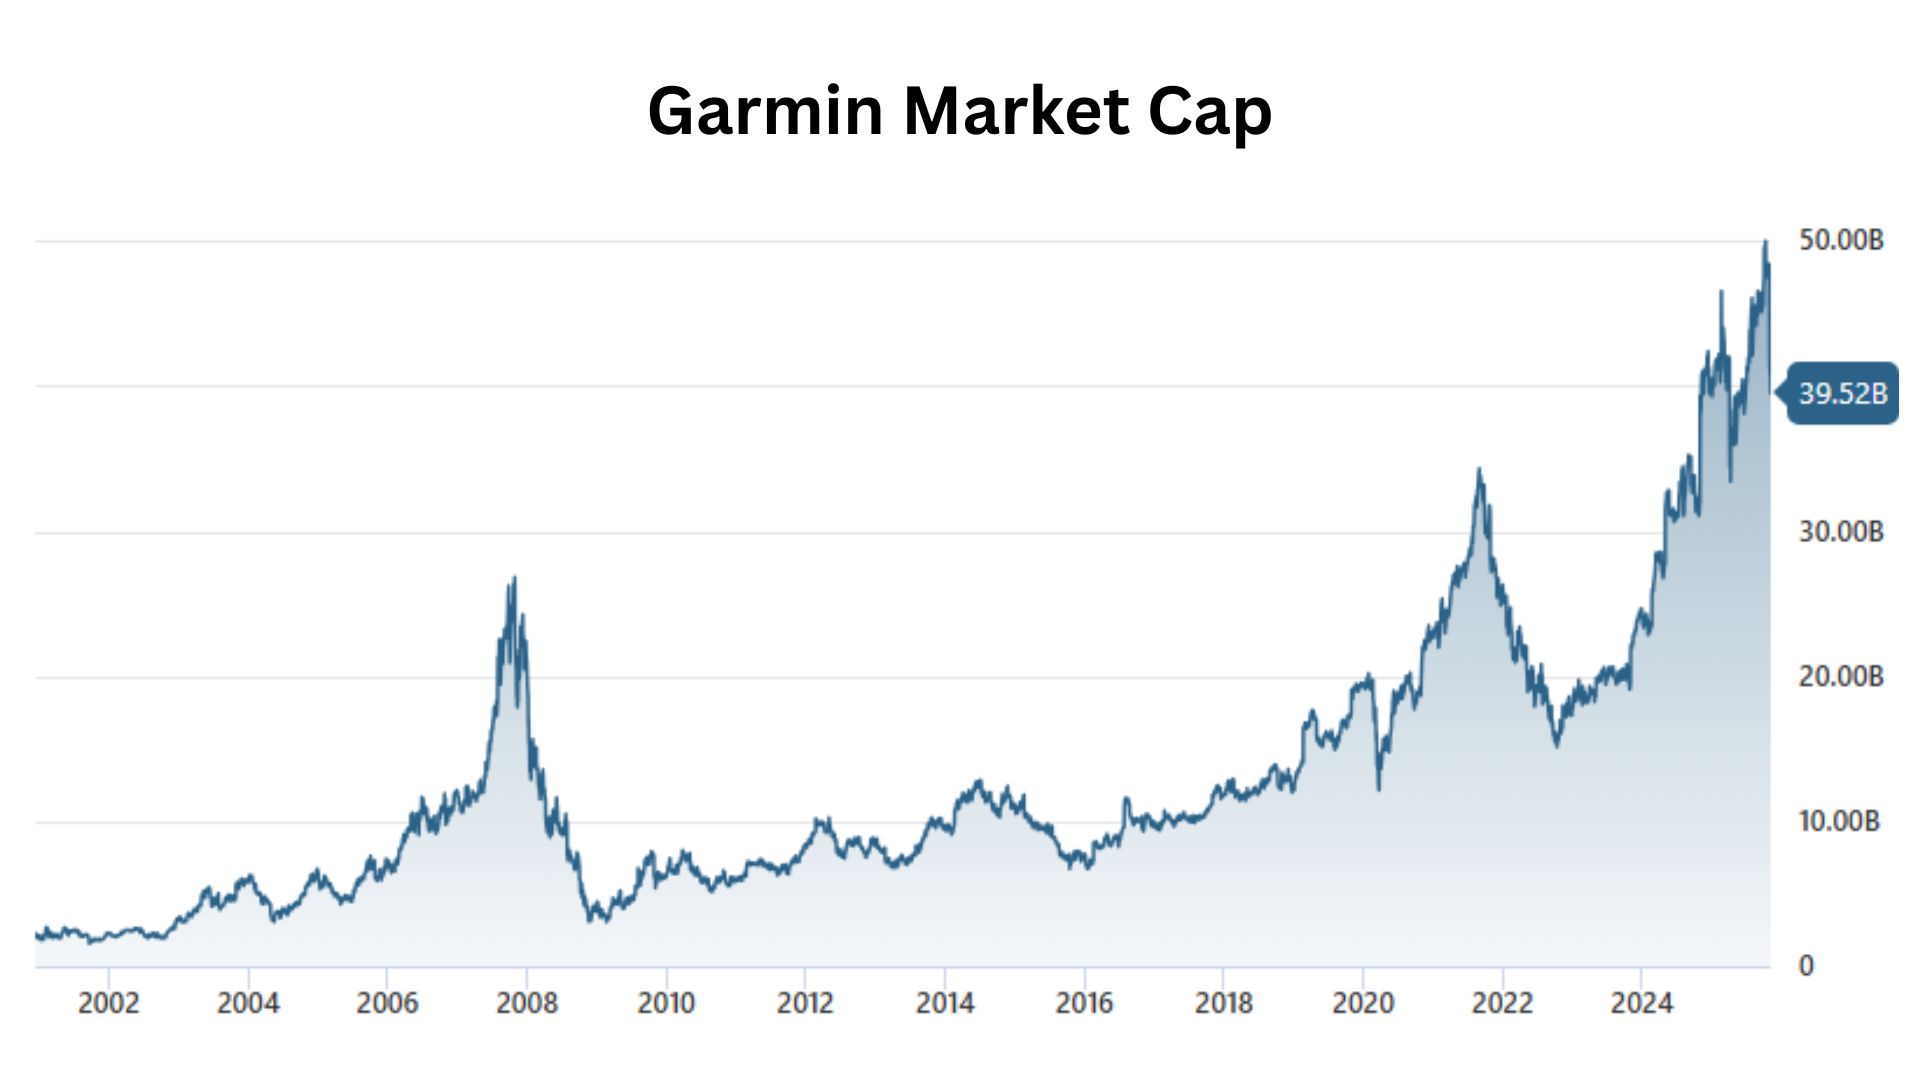
- On November 4, 2025, Garmin Statistics also reported that the company’s market capitalization was USD 39.52 billion, a decrease of 3.97% from the previous month.
Other monthly market capitalizations in 2025 are stated in the table below:
| Months | Market Cap (USD billion) | Growth Rate |
| January | 41.45 | +4.65% |
| February | 44.05 | +6.27% |
| March | 41.78 | -5.15% |
| April | 35.98 | -13.87% |
| May | 39.08 | +8.62% |
| June | 40.19 | +2.83% |
| July | 42.11 | +4.78% |
| August | 46.55 | +10.54% |
| September | 47.40 | +1.82% |
| October | 41.15 | -13.18% |
Garmin Connect Data Report Statistics by Body Battery (2024)
| Category | Value |
| Average Morning Body Battery (a.m) | 71 |
| Average Evening Body Battery (p.m) | 22 |
| Average Daily Drain (Expenditure) | 49 |
| Highest Morning Body Battery (Tuesday) | 74 |
| Lowest Evening Body Battery (Saturday) | 20 |
| Highest Daily Energy Expenditure (Tuesday) | 50 |
| Lowest Daily Energy Expenditure (Sunday) | 47 |
| Country with the Highest Average Body Battery | Netherlands (74) |
| Country with the Lowest Average Body Battery | Japan (66) |
By Sleep Score
| Category | Value |
| Average Sleep Score | 71 |
| Best Night of Sleep per Week | Monday night to Tuesday morning |
| Average Sleep Score | 73 |
| Worst Night of Sleep per Week | Saturday night to Sunday morning |
| Average Sleep Score | 68 |
| Best Night of Sleep (2024) | September 9 to 10 |
| Average Sleep Score | 74 |
| Worst Night of Sleep | December 31 to January 1 |
| Average Sleep Score | 58 |
| Country with the Best Average Sleep Score | Netherlands (73) |
By Stress Score
| Category | Value |
| Average global stress score | 30 |
| Lowest average stress score of the week (Monday) | 29 |
| Highest average stress score of the week (Saturday) | 32 |
| Highest average stress score of the year | 33 |
| Lowest average stress score of the year | 28 |
| Highest average stress score by country (Malaysia) | 33 |
| Lowest average stress score by country (South Korea) | 28 |
By Training Readiness
| Category | Value |
| Training readiness score range | |
| (Poor) | 1 to 24 |
| (Low) | 25 to 49 |
| (Moderate) | 50 to 74 |
| (High) | 75 to 94 |
| (Prime) | 95 to 100 |
| Average training readiness (year) | 60 |
| Highest weekly average training readiness (Tuesday) | 62 |
| Lowest weekly average training readiness (Sunday) | 57 |
| Highest average training readiness of the year | 64 |
| Lowest average training readiness of the year | 44 |
| The country with the highest average training readiness | New Zealand (64) |
| The country with the lowest average training readiness | South Korea (51) |
By Daily Steps
| Category | Value |
| Average global stress score | 30 |
| Lowest average stress score of the week (Monday) | 29 |
| Highest average stress score of the week (Saturday) | 32 |
Younger biological age is linked to higher daily step counts among Garmin users, are stated below:
| Age Group (Years) | Average Years Younger |
| 20 to 29 | 2.43 |
| 30 to 39 | 2.10 |
| 40 to 49 | 2.36 |
| 50 to 59 | 2.68 |
Garmin’s Country Statistics by Top Import Sources
| Exporting Country | 2025 | 2024 | 2023 |
| India | 1.31 million | 1.25 million | 391.2 thousands |
| Vietnam | 93.87 thousand | 166.15 thousand | 108.09 thousands |
By Top Export Sources
| Importing Country | 2025 | 2024 | 2023 |
| United States | – | 297.29 million | 400.4 million |
| Philippines | 5.18 million | 8.62 million | 1.27 million |
| India | 656.37 thousand | 22.81 thousand | 1.66 million |
| Vietnam | 421.8 thousand | 644.18 thousand | 425.73 thousand |
Top HS Codes Imported by Garmin Corporation, 2025
| HS Code | Import Value (USD) | Share |
| 910811 | 2.7 million | 30.69% |
| 851762 | 240.03 thousand | 30.69% |
| 852691 | 51.28 thousand | 10.71% |
| 910212 | 38.07 thousand | 9.18% |
| 910219 | 29.7 thousand | 7.46% |
Top HS Codes Exported by Garmin Corporation, 2025
| HS Code | Export Value (USD million) | Share |
| 851762 | 135.4 | 31.62% |
| 852691 | 382.09 | 7.74% |
| 901480 | 88.85 | 5.27% |
| 901490 | 17.93 | 2.02% |
| 852610 | 32.36 | 1.38% |
Garmin’s Brand Statistics
 (Reference: statista.com)
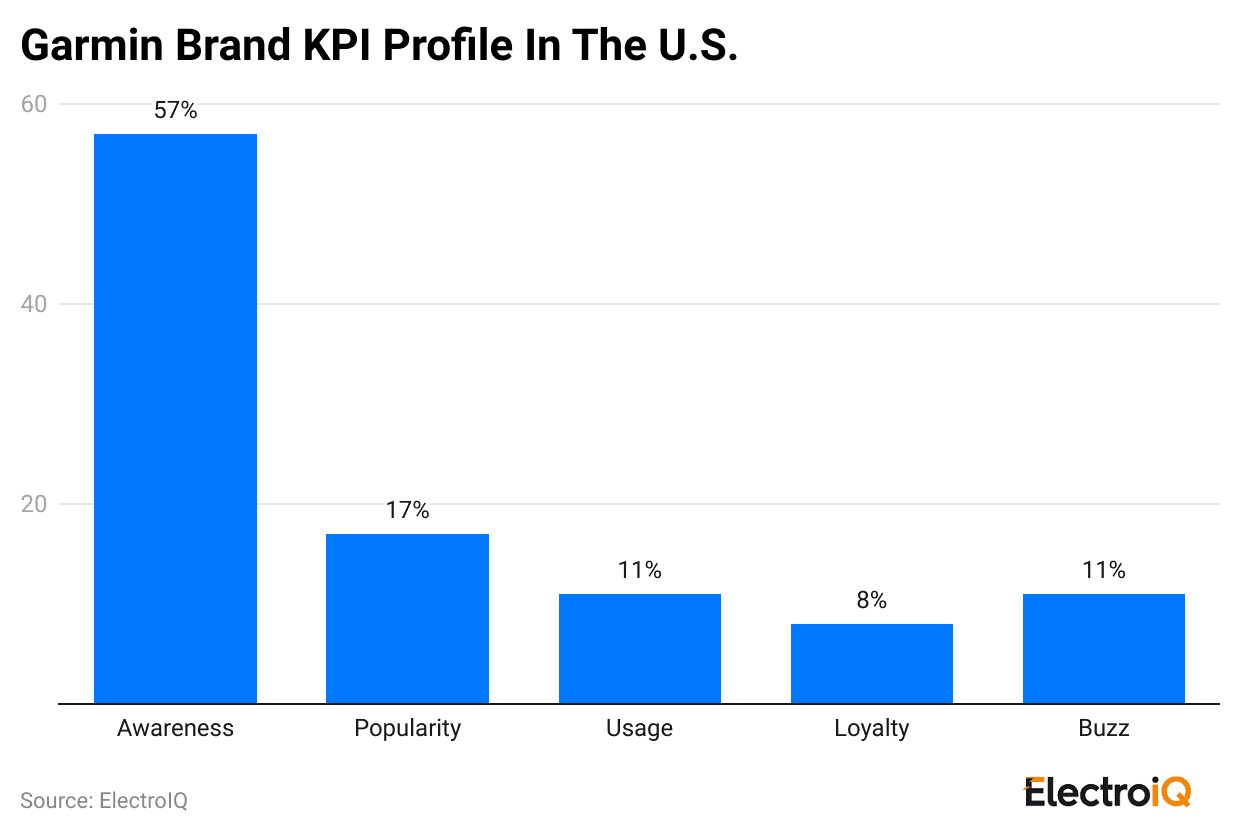
- In the United States, approximately 57% of people familiar with the Garmin brand are wearable device users, while 17% of wearable device users report enjoying the use of Garmin products.
- The brand also shows an 11% usage share, 8% customer loyalty, and 11% buzz among users.
Top Products of Garmin
- Garmin Fenix 8 AMOLED: Premium multisport flagship with AMOLED display. Specs include sizes of 43 mm/47 mm/51 mm, a built-in flashlight, and advanced connectivity, including LTE & satellite via inReach.
- Garmin Instinct 3 AMOLED: Rugged outdoor tactical watch featuring AMOLED display, 50 mm case size, built for outdoor and tactical use.
- Garmin Vivoactive 6: Mid-range fitness smartwatch – good choice for everyday wear with fitness tracking & GPS. Specs: 42 mm size listed in India.
- Garmin Instinct 3 (45 mm): Entry model of the outdoor tactical line with a 45 mm case size, AMOLED screen variant.
- Garmin Forerunner 55: Budget-friendly beginner running watch including GPS, wrist-based heart rate, and essential fitness tracking.
Conclusion
After completing the Garmin Statistics article, it’s clear that the company is currently experiencing steady growth globally. Moreover, gaining strong profits and other factors, the company is also offering a huge range of products to its customers. Its expansion into software and service solutions continues to strengthen customer loyalty.
In different business models, performance across different markets and product categories remained balanced. Garmin’s solid financial report and strategic approaches kept it focused, innovative, and well-prepared for future success.
Sources
FAQ.
Garmin Connect is a companion app and website that allows users to sync devices, track their health, and share data.
GPS dropouts, Bluetooth pairing failures, sync errors, battery drain, firmware bugs, charging issues, and screen freezes.
Garmin Pay is a contactless payment service available on Garmin watches, allowing secure purchases without the need for a phone.
Garmin tracks heart rate, steps, sleep, stress, SpO₂, VO₂ max, calories, distance, respiration, and body battery.
The military uses Garmin for reliable GPS navigation, rugged durability, secure features, and mission-ready global performance.

Maitrayee Dey has a background in Electrical Engineering and has worked in various technical roles before transitioning to writing. Specializing in technology and Artificial Intelligence, she has served as an Academic Research Analyst and Freelance Writer, particularly focusing on education and healthcare in Australia. Maitrayee's lifelong passions for writing and painting led her to pursue a full-time writing career. She is also the creator of a cooking YouTube channel, where she shares her culinary adventures. At Smartphone Thoughts, Maitrayee brings her expertise in technology to provide in-depth smartphone reviews and app-related statistics, making complex topics easy to understand for all readers.