Gen Z Spending and Buying Habits Statistics and Facts
Updated · May 14, 2026

Table of Contents
- Introduction
- Editor’s Choice
- Gen Z Composition
- Attitude Toward Spending For Gen Z
- Gen Z’s Recent Purchase Reasons
- BNPL Penetration Among Gen Z
- Gen Z’s Share of Retail Spend
- Genz’s Perception of Price Rise
- Genz Future Shopping Plan
- Why Does Gen Z Prefer In-Store Shopping?
- Genz’s Preference For Online Shopping
- Genz’s Reason to Stop Shopping With a Retailer
- Genz’s Reason For Purchasing From The Same Brand
- Genz as a Part of The Workforce
- Social Media Dominates Gen Z
- GenZ Job Preferences
- Social Media Tools for Product Research
- Shopping With Influencer Recommendation
- GenZ Shopping Preference
- Genz Preferred Shopping Features
- Conclusion
Introduction
Gen Z Spending And Buying Habits Statistics: Generation Z, born between 1997 and 2012, is shaking up how we think about spending and shopping. This generation, making up 20% of the population, has distinct habits that set it apart from older groups. Stats on Gen Z spending and buying habits show they love a mix of online and in-store shopping, with 40% favoring online options. They care deeply about value, sustainability, and social responsibility, and over half use Buy Now Pay Later (BNPL) services.
Social media, especially YouTube, has become their go-to for purchasing decisions. As more Gen Z enters the workforce—expected to hit 31% by 2031—their economic influence is only growing. For businesses, understanding how this group thinks is key to staying ahead.
Editor’s Choice
- Gen Z is projected to represent 17% of all retail shoppers by 2030, up from 5% in 2020.
- 71% of Gen Z shows selective brand loyalty while actively exploring competitor offerings.
- 45% of Gen Z purchases are driven by genuine product interest rather than marketing influence.
- BNPL usage among Gen Z is expected to reach 59% by 2026.
- 8% of Gen Z prefer in-store shopping to experience products before purchasing physically.
- 7% of Gen Z cite good discounts as the primary reason for brand loyalty.
- YouTube is the preferred research platform for 47% of Gen Z consumers.
- 48% of Gen Z favor shopping at discount retailers over other retail formats.
- 46% of Gen Z prioritize quick and easy checkouts in their shopping experience.
- Gen Z workforce participation is expected to double from 15% to 31% between 2022 and 2031.
- 49% of Gen Z make clothing purchases based on influencer recommendations.
- Social media recommendations directly influence 24% of Gen Z purchases.
- 48% of Gen Z have avoided retailers due to slow or expensive delivery.
- 66% of Gen Z prefer full-time employment over gig work.
- 7% of Gen Z plans to maintain consistent shopping habits over the next 12 months.
Gen Z Composition
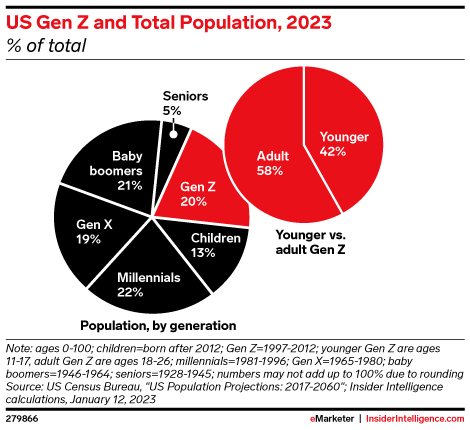
(Source: emarketer.com)
- Stats on Gen Z Spending and Buying Habits show that Gen Z makes up 20% of the total population.
- The younger population makes up 42% of the population, while the adult Gen Z population makes up 58%.
Attitude Toward Spending For Gen Z

(Reference: eMarketer.com)
- Statistics on Gen Z Spending and Buying Habits show that 71% of millennials are loyal to some brands but tend to buy from competitors.
- 66% of Millennials frequently buy from the same company but are not loyal.
- 60% of Millennials are loyal to some companies and are willing to pay more to shop with them.
- 27% of Millennials are not loyal to any particular company.
Gen Z’s Recent Purchase Reasons

(Source: eMarketer.com)
- Stats on Gen Z Spending and Buying Habits show that 45% of Gen Z respondents buy products they like.
- 33% of Gen Z respondents purchased the product after seeing an advertisement.
- 28% of Gen Z respondents were motivated to buy due to a deal, offer, or coupon.
- 24% of Gen Z respondents were influenced by the social platform’s ease of purchase.
- 24% of Gen Z respondents bought after seeing positive social media comments about the product.
- 22% of Gen Z respondents were encouraged by an influencer or creator’s recommendation.
BNPL Penetration Among Gen Z
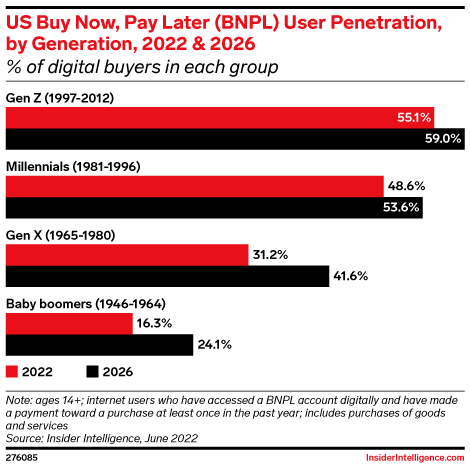
(Source: eMarketer.com)
- Statistics on Gen Z Spending and Buying Habits show that Gen Z’s tendency to buy now and pay later has increased.
- In 2022, 55.1% of Gen Z believe in buying now and paying later.
- It is estimated that by the end of 2026, 59% of users will invest in buy now pay later features.
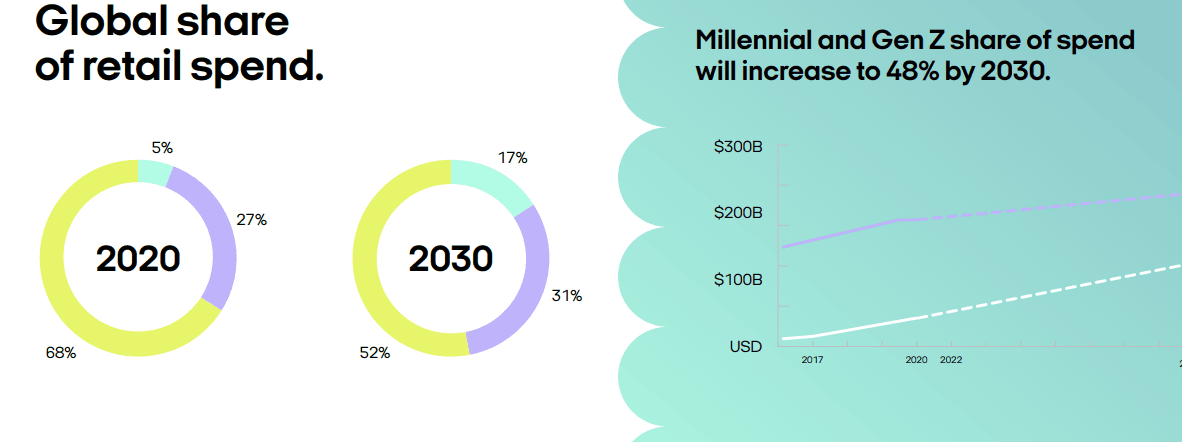
(Source: afterpay-newsroom.yourcreative.com)
- Stats on Gen Z Spending and Buying Habits reveal that Gen Z is expected to have a bigger share among real spenders over time.
- In 2020, Gen Z made up 5% of all retail shoppers globally.
- It is estimated that by the end of 2030, Gen Z will make up 17% of all retail shoppers.
Genz’s Perception of Price Rise

(Reference: afterpay-newsroom.yourcreative.com)
- Stats on Gen Z Spending and Buying Habits show that 43% of Gen Z believe l become expensive with time. with time
- 4% of Gen Z expect the prices of everyday items, such as groceries and clothing, to increase slightly.
- 2% of Gen Z think that the prices of everyday items, such as groceries and clothing, will decrease slightly.
- 7% of Gen Z anticipate that the prices of everyday items, such as groceries and clothing, will rise significantly.
Genz Future Shopping Plan
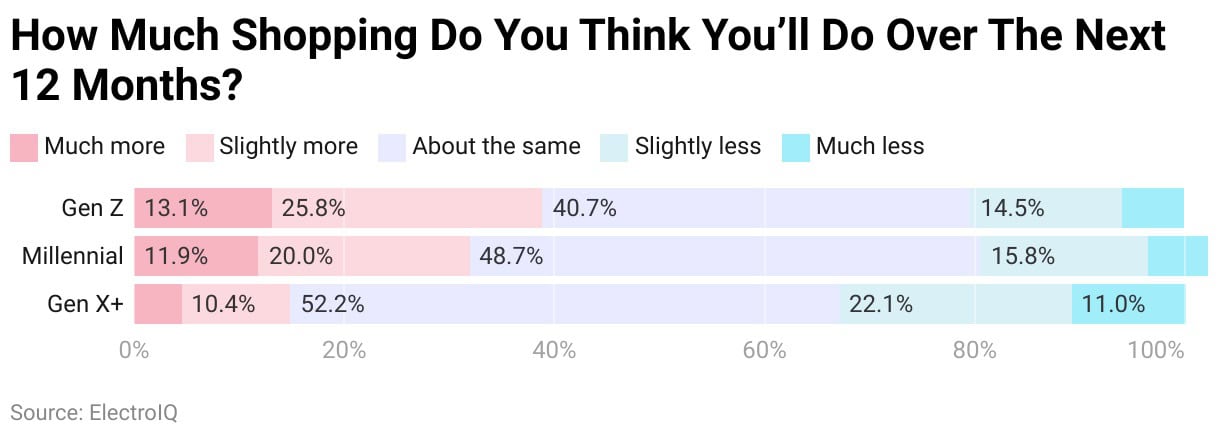
(Reference: afterpay-newsroom.yourcreative.com)
- Stats on Gen Z Spending and Buying Habits show that 40.7% of Gen Z have had similar shopping plans in the last 12 months.
- 8% of Gen Z expect to shop slightly more over the next 12 months.
- 5% of Gen Z anticipate shopping somewhat less in the coming year.
- 1% of Gen Z plan to shop more over the next 12 months.
- 9% of Gen Z expect to shop less during the upcoming year.
Why Does Gen Z Prefer In-Store Shopping?
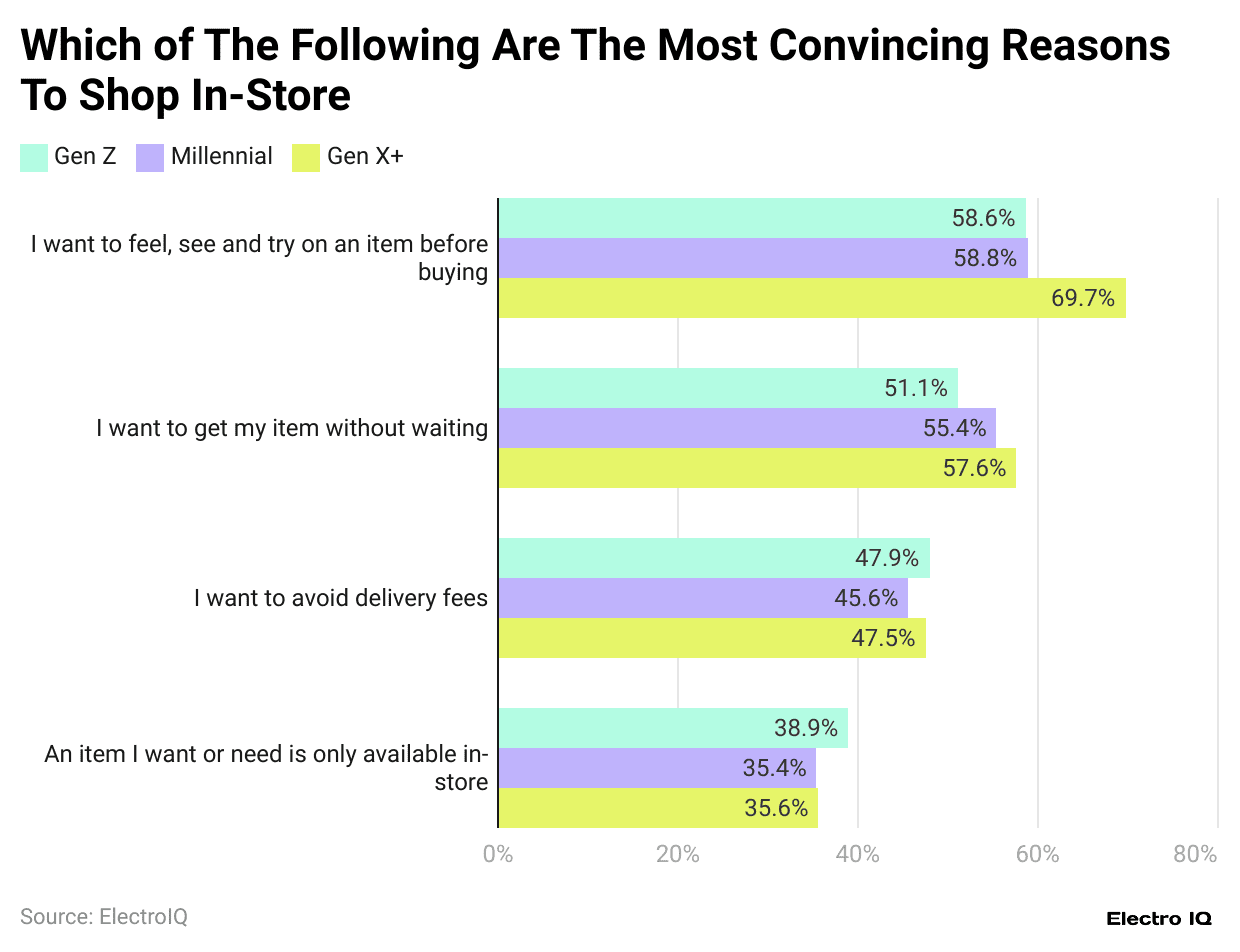
(Reference: afterpay-newsroom.yourcreative.com)
- Stats on Gen Z Spending and Buying Habits show that 58.8% of GenZ want to feel and try products before shopping as the reason for the reference for in-store shopping.
- 1% of Gen Z choose in-store shopping to get their item without waiting.
- 9% of Gen Z shoppers are in-store to avoid delivery fees.
- 4% of Gen Z shop in-store when the item they need or want is only available in-store.
Genz’s Preference For Online Shopping

(Source: afterpay-newsroom.yourcreative.com)
- Statistics on Gen Z Spending and Buying Habits show that 40% of Gen Z prefer online shopping. In-store shopping-store shopping.
- 35% of Millennials prefer online shopping over in-store shopping.
- 27% of Gen X+ prefer online shopping over in-store shopping.
Genz’s Reason to Stop Shopping With a Retailer

(Reference: afterpay-newsroom.yourcreative.com)
- Stats on Gen Z Spending and Buying Habits show that 48% of Gen Z avoided shopping with a brand or retailer because delivery was too slow or expensive.
- 5% of Gen Z did not shop with a brand due to the lack of discounts or sales.
- 4% of Gen Z refrained from purchasing because of a lack of reviews for a product.
- 1% of Gen Z avoided shopping with a brand due to poor policies or a lack of return options.
- 7% of Gen Z found the brand’s website unsafe and chose not to shop with them.
Genz’s Reason For Purchasing From The Same Brand

(Reference: afterpay-newsroom.yourcreative.com)
- Stats on Gen Z Spending and Buying Habits show that 68.7% of Gen Z cite good discounts and sales as a reason to purchase from the same brand again.
- 3% of Gen Z mention allowing online purchases to be returned in-store as a reason to purchase from the same brand again.
- 3% of Gen Z value having online and offline stores as a reason to purchase from the same brand again.
- 38% of Gen Z consider being eco-friendly as a reason to purchase from the same brand again.
- 3% of Gen Z see inclusive and transparent advertising as a reason to purchase from the same brand again.
- 4% of Gen Z regard being a small or local business as a reason to purchase from the same brand again.
Genz as a Part of The Workforce

(Source: oliverwyman.es)
- Stats on Gen Z Spending and Buying Habits show that Gen Z is expected to become a formidable part of the workforce in the coming years.
- Gen Z will comprise 15% of the workforce in 2022, and it is estimated that by the end of 2031, Gen Z will make up 31%.
Social Media Dominates Gen Z

(Source: oliverwyman.es)
- Stats on Gen Z Spending and Buying Habits show that 24% of Gen Z buy products recommended to them on social media.
- 17% of Gen Z purchase products after conducting online research.
- 10% of Gen Z buy products they discover through browsing in-person stores.
GenZ Job Preferences
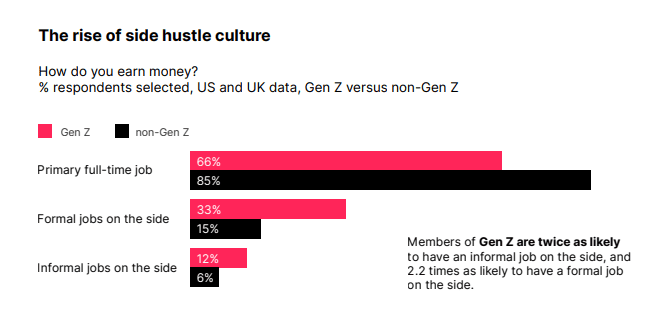
(Source: oliverwyman.es)
- Stats on Gen Z Spending and Buying Habits show that 66% of Gen Z prefer primary full-time jobs.
- 33% of Gen Z prefer formal jobs on the side.
- 12% of Gen Z prefer informal jobs on the side.
Social Media Tools for Product Research

(Source: surveymonkey.com)
- Statistics on Gen Z Spending and Buying Habits show that 47% of Gen Z users prefer YouTube as their research platform.
- 29% of Gen Z consumers prefer Instagram for product research.
- Facebook is preferred by 21% of Gen Z for product research.
- TikTok is preferred by 17% of Gen Z for product research.
- Pinterest is the least preferred platform, with only 6% of Gen Z using it for product research.
Shopping With Influencer Recommendation

(Source: surveymonkey.com)
- Statistics on Gen Z Spending and Buying Habits show that 49% of Gen Zers shop for clothing based on recommendations from Social media influencers.
- 34% of Gen Z purchase beauty and skincare products influenced by social media.
- 31% of Gen Z buy technology products based on social media recommendations.
- 29% of Gen Z purchase food and beverages as influenced by social media.
- 20% of Gen Z shop for home goods due to social media recommendations.
- 5% of Gen Z buy other products as per social media influence.
GenZ Shopping Preference

(Source: icsc.com)
- Statistics on Gen Z Spending and Buying Habits show that 48% of GenZ prefer shopping at discount/off-price retailers.
- 25% of Gen Z prefer shopping at dollar/variety stores.
- 24% of Gen Z prefer shopping at specialty retailers.
- 22% of Gen Z prefer shopping at fast fashion retailers.
- 21% of Gen Z prefer shopping at department stores.
- 13% of Gen Z prefer shopping at thrift/second-hand stores.
Genz Preferred Shopping Features

(Source: icsc.com)
- Stats on Gen Z Spending and Buying Habits show that 46% of Gen Z prefer quick and easy checkouts when shopping.
- 45% of Gen Z prefer fast shipping while shopping.
- 39% of Gen Z prefer getting what they want in-store immediately while shopping.
- 31% of Gen Z prefer free returns while shopping.
- 27% of Gen Z prefer quick and helpful customer service with enough employees while shopping.
- 23% of Gen Z prefer the ability to check stock in-store ahead of time while shopping accurately.
Conclusion
Statistics on Gen Z spending and buying habits paint a picture of a generation changing the consumer landscape. They mix online convenience with in-store experiences, prioritizing value and the social impact of their choices. Social media, particularly YouTube, plays a huge role in shaping what they buy, with influencers and peer reviews guiding their decisions.
Their spending power is set to grow from 5% to 17% by 2030, making them a force to reckon with. Brands need to meet Gen Z where they are by offering flexible payment options, embracing sustainability, and creating seamless shopping experiences to win their loyalty in an ever-changing market.
Sources
FAQ.
Gen Z makes up 20% of the total population, with 58% adults and 42% younger individuals
40% of Gen Z prefers online shopping, though many value an omnichannel experience with online and offline options
68.7% of Gen Z cites good discounts and sales as the main reason for returning to the same brand
Very important, with 55.1% of Gen Z using BNPL in 2022, expected to reach 59% by 2026.
YouTube leads, with 47% of Gen Z users using it for product research, followed by Instagram at 29%.
66% of Gen Z prefers primary full-time jobs over side gigs or informal employment.
58.8% of Gen Z prefers in-store shopping to feel and try products before purchasing.
Gen Z is projected to make up 31% of the workforce by 2031, up from 15% in 2022.
48% of Gen Z avoids retailers due to slow or expensive delivery services.
24% of Gen Z purchases are based on social media recommendations.

Maitrayee Dey has a background in Electrical Engineering and has worked in various technical roles before transitioning to writing. Specializing in technology and Artificial Intelligence, she has served as an Academic Research Analyst and Freelance Writer, particularly focusing on education and healthcare in Australia. Maitrayee's lifelong passions for writing and painting led her to pursue a full-time writing career. She is also the creator of a cooking YouTube channel, where she shares her culinary adventures. At Smartphone Thoughts, Maitrayee brings her expertise in technology to provide in-depth smartphone reviews and app-related statistics, making complex topics easy to understand for all readers.


