Marvell Statistics By Revenue, Total Assets, Future Readiness, Acquisitions And Products
Updated · Nov 06, 2024
Table of Contents
- Introduction
- Editor’s Choice
- Marvell Technology Research And Development Expenses
- Marvell Technology’s Revenue Worldwide
- Marvel Revenue Worldwide By Regions
- Marvell's Total Assets Worldwide
- Leading Technologies By Future Readiness
- Marvel Technology Acquisitions
- Marvell Technology Products
- Marvell Technology Overview
- Conclusion
Introduction
Marvell Statistics: Marvell Technology is an American semiconductor company headquartered in Santa Clara, California. It is one of the prominent names in the semiconductor industry. This company focuses on developing an electronics-based atmosphere that optimizes execution on a holistic level.
As we go forward, we will learn more about Marvell Statistics to know the factors that have promoted the company’s success. For the most part, we will learn about the relevant information that has led to its becoming a driving force in the semiconductor industry.
Editor’s Choice
- Marvell’s R&D expenses grew from $1.04M in 2014 to $1.9M in 2024
- Company revenue peaked at $5.92 billion in 2023
- China generated the highest revenue of $2486.3M in 2023
- Total assets reached a peak of $22.52 billion in 2022
- Microsoft leads the future readiness score at 100, while Marvell scores 41.6
- Revenue jumped 50% from $2.97B in 2021 to $4.46B in 2022
- The company experienced the lowest revenue point of $2.3B in 2017
- Inphi Corporation acquisition was the largest at $8.2 billion
- The USA market contributed $690.1M to revenue in 2023
- R&D expenses showed a significant jump from $1.08M in 2020 to $1.42M in 2022
- Total assets slightly declined to $21.23B in 2023
- 2024 projections show R&D spending reaching $1.9M
Marvell Technology Research And Development Expenses
(Reference: statista.com)
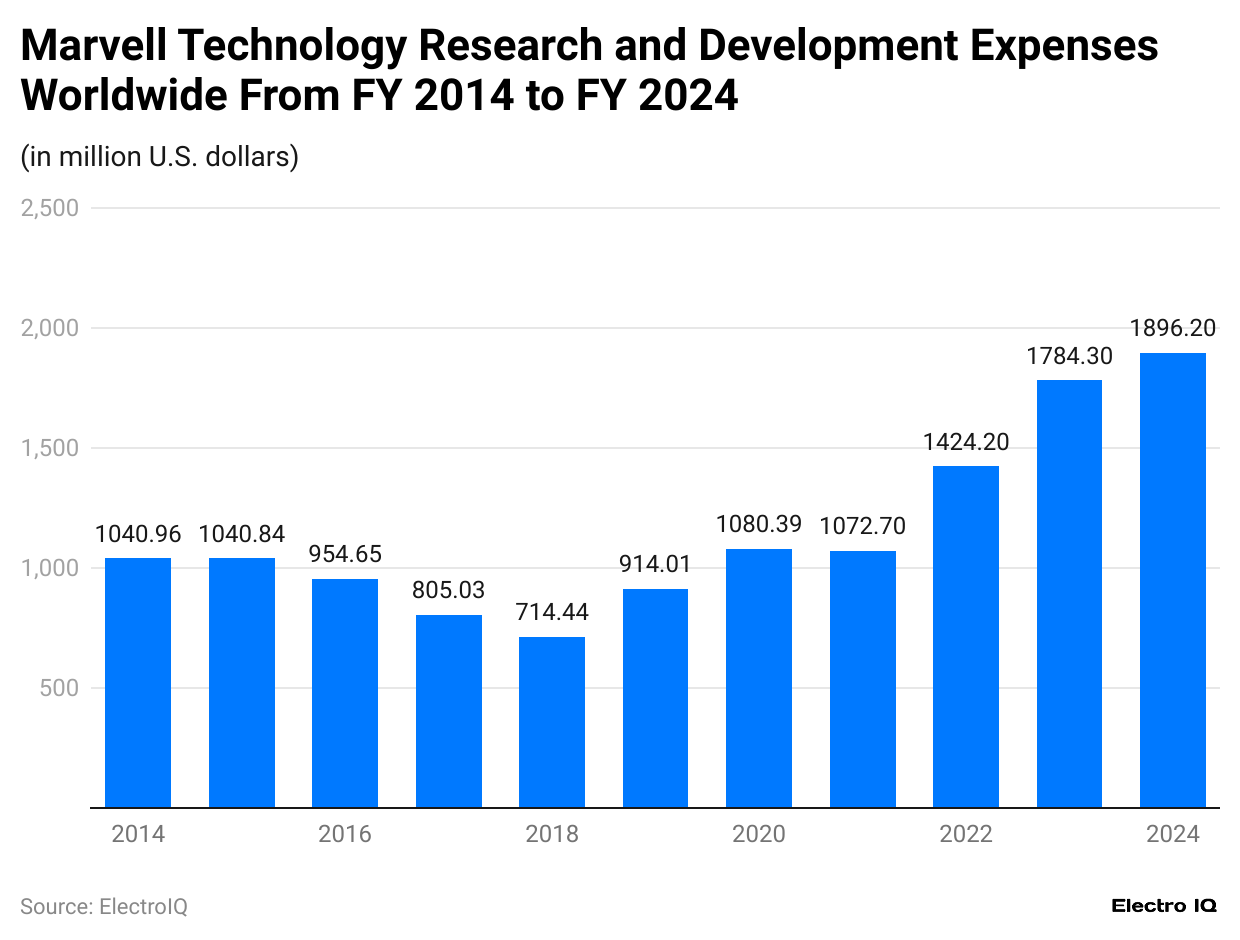
- Marvell Statistics show that the company’s R&D expenses consistently grew over the decade, from $1.04 million in 2014 to $1.9 million in 2024.
- There was a notable jump in R&D expenses from 2020 ($1.08 million) to 2022 ($1.42 million) and a further increase in 2023 to $1.78 million.
- There was a slight drop in R&D spending in 2021, with expenses falling from $1.08 million in 2020 to $1.07 million before resuming the upward trend.
- R&D expenses are projected to reach their highest in 2024, peaking at $1.9 million, reflecting Marvell’s continued investment in innovation and technology development.
Marvell Technology’s Revenue Worldwide
(Reference: statista.com)
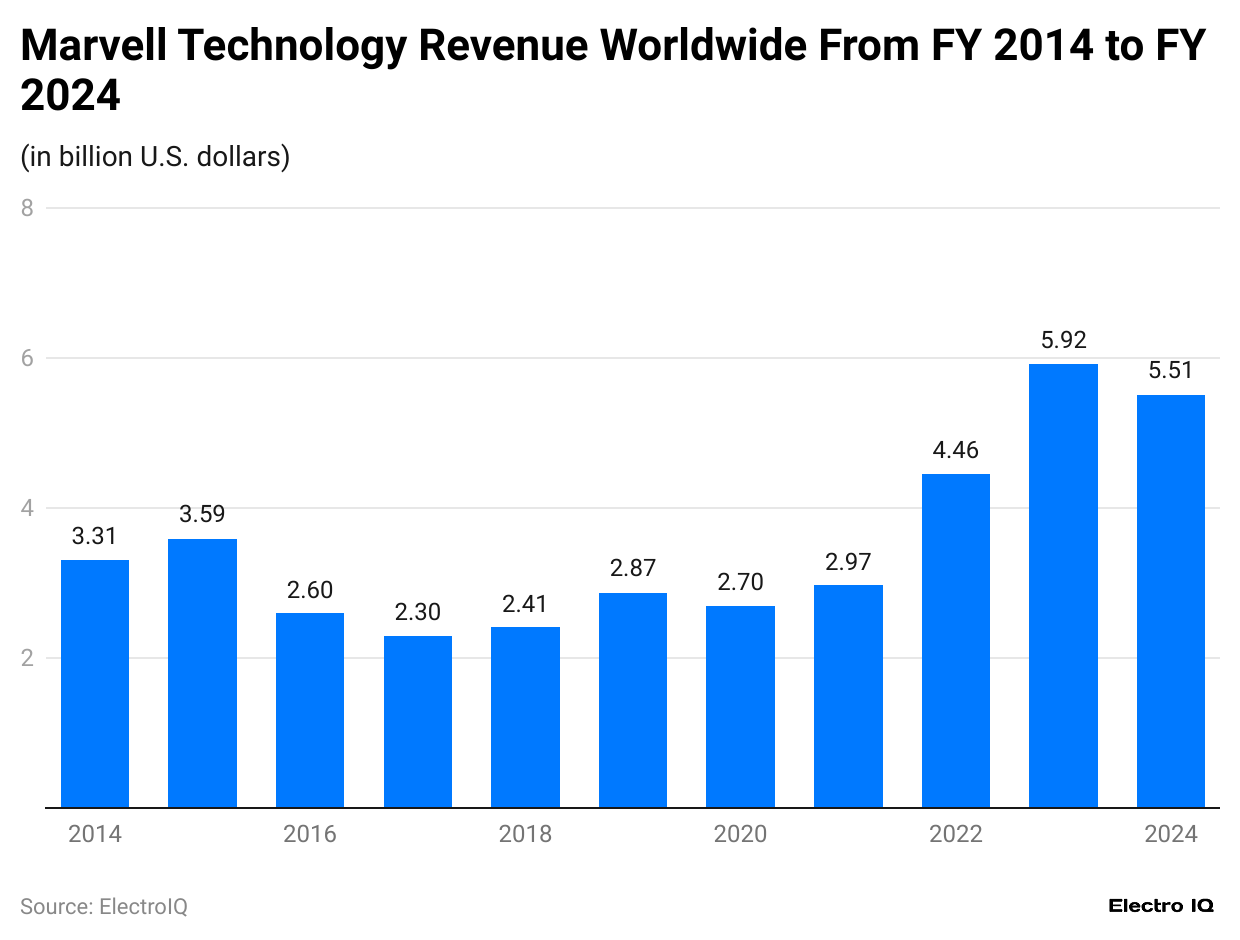
- Marvell Statistics show that after a dip in revenue from 2016 to 2018, company revenue consistently grew from 2019 onwards, reaching a peak in 2023 at $5.92 billion.
- A notable revenue jump occurred between 2021 and 2022, where Marvell’s revenue rose from $2.97 billion to $4.46 billion, showing substantial growth.
- Marvell’s revenue experienced fluctuations between 2014 and 2019, where the company had a revenue low point in 2017 at $2.3 billion before rebounding in subsequent years.
- The company achieved its highest revenue in 2023, generating $5.92 billion, marking a significant milestone in its growth trajectory.
Marvel Revenue Worldwide By Regions
(Reference: statista.com)
- Marvell Statistics show that the Philippines, United States, Taiwan, Finland, Singapore, China, Malaysia, Japan, and Thailand are the countries from where the company generates revenue.
- As of 2023, the company generated the highest revenue from China with $2486.3 million, followed by Others regions with $716.3 million revenue, USA with $690.1 million revenue, Malaysia with $393.2 million revenue, Thailand with $391.9 million revenue, Singapore with $331.7 million revenue, Taiwan with $289 million revenue, Japan with $260 million revenue, Finland with $189.6 million revenue, Philippines with $171.5 million revenue.
Marvell's Total Assets Worldwide
(Reference: statista.com)
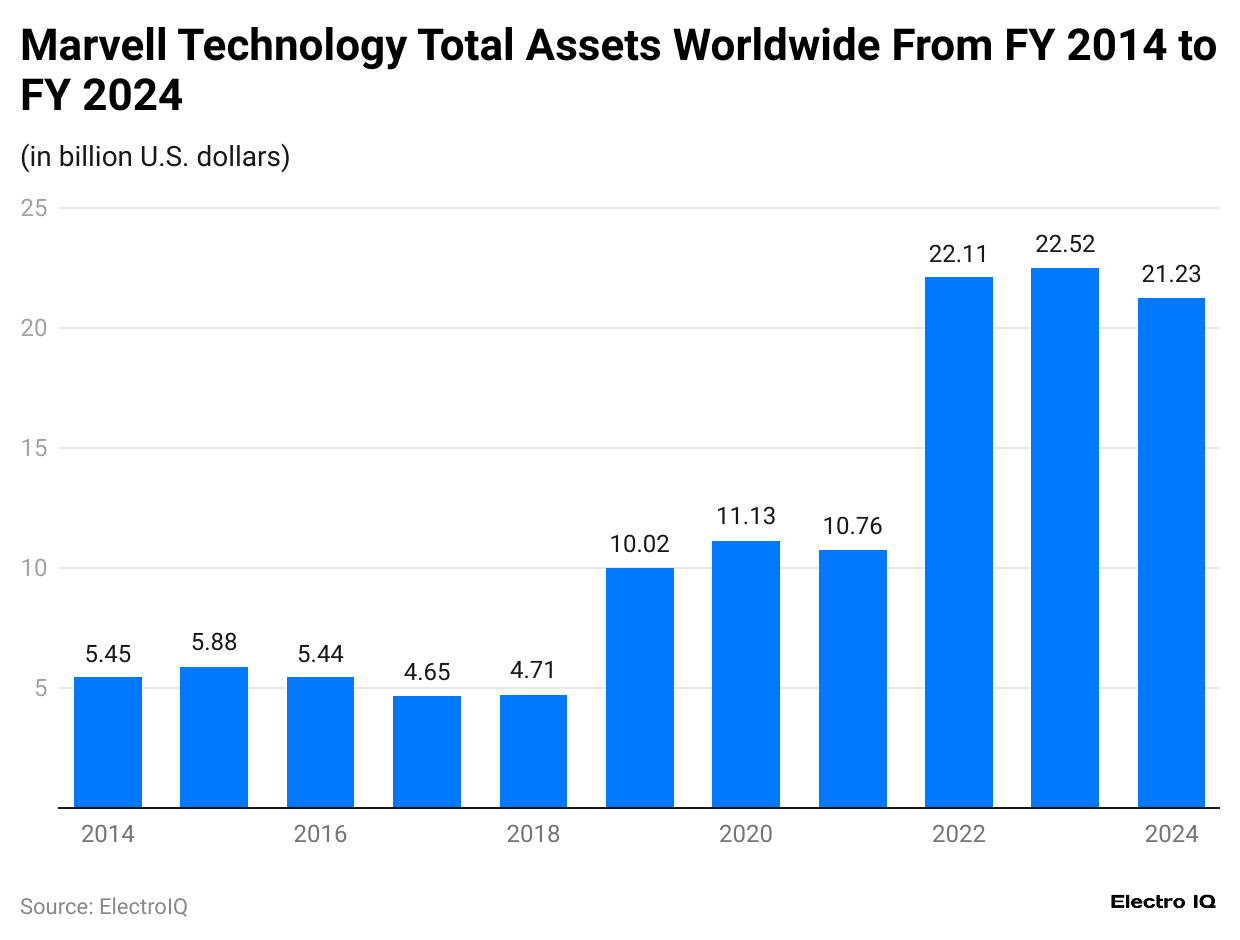
- Marvell's Statistics show that the company’s total assets have significantly increased from 2019 onward, reaching a peak of $22.52 billion in 2022.
- Between 2014 and 2019, Marvell's assets grew steadily, with a notable increase in 2019, when assets jumped to $10.02 billion from $4.71 billion in 2018.
- In 2023, the total assets slightly declined to $21.23 billion after reaching their peak in 2022.
- From 2014 to 2018, Marvell's total assets remained relatively stable, fluctuating between $4.65 billion and $5.88 billion before the substantial growth in 2019.
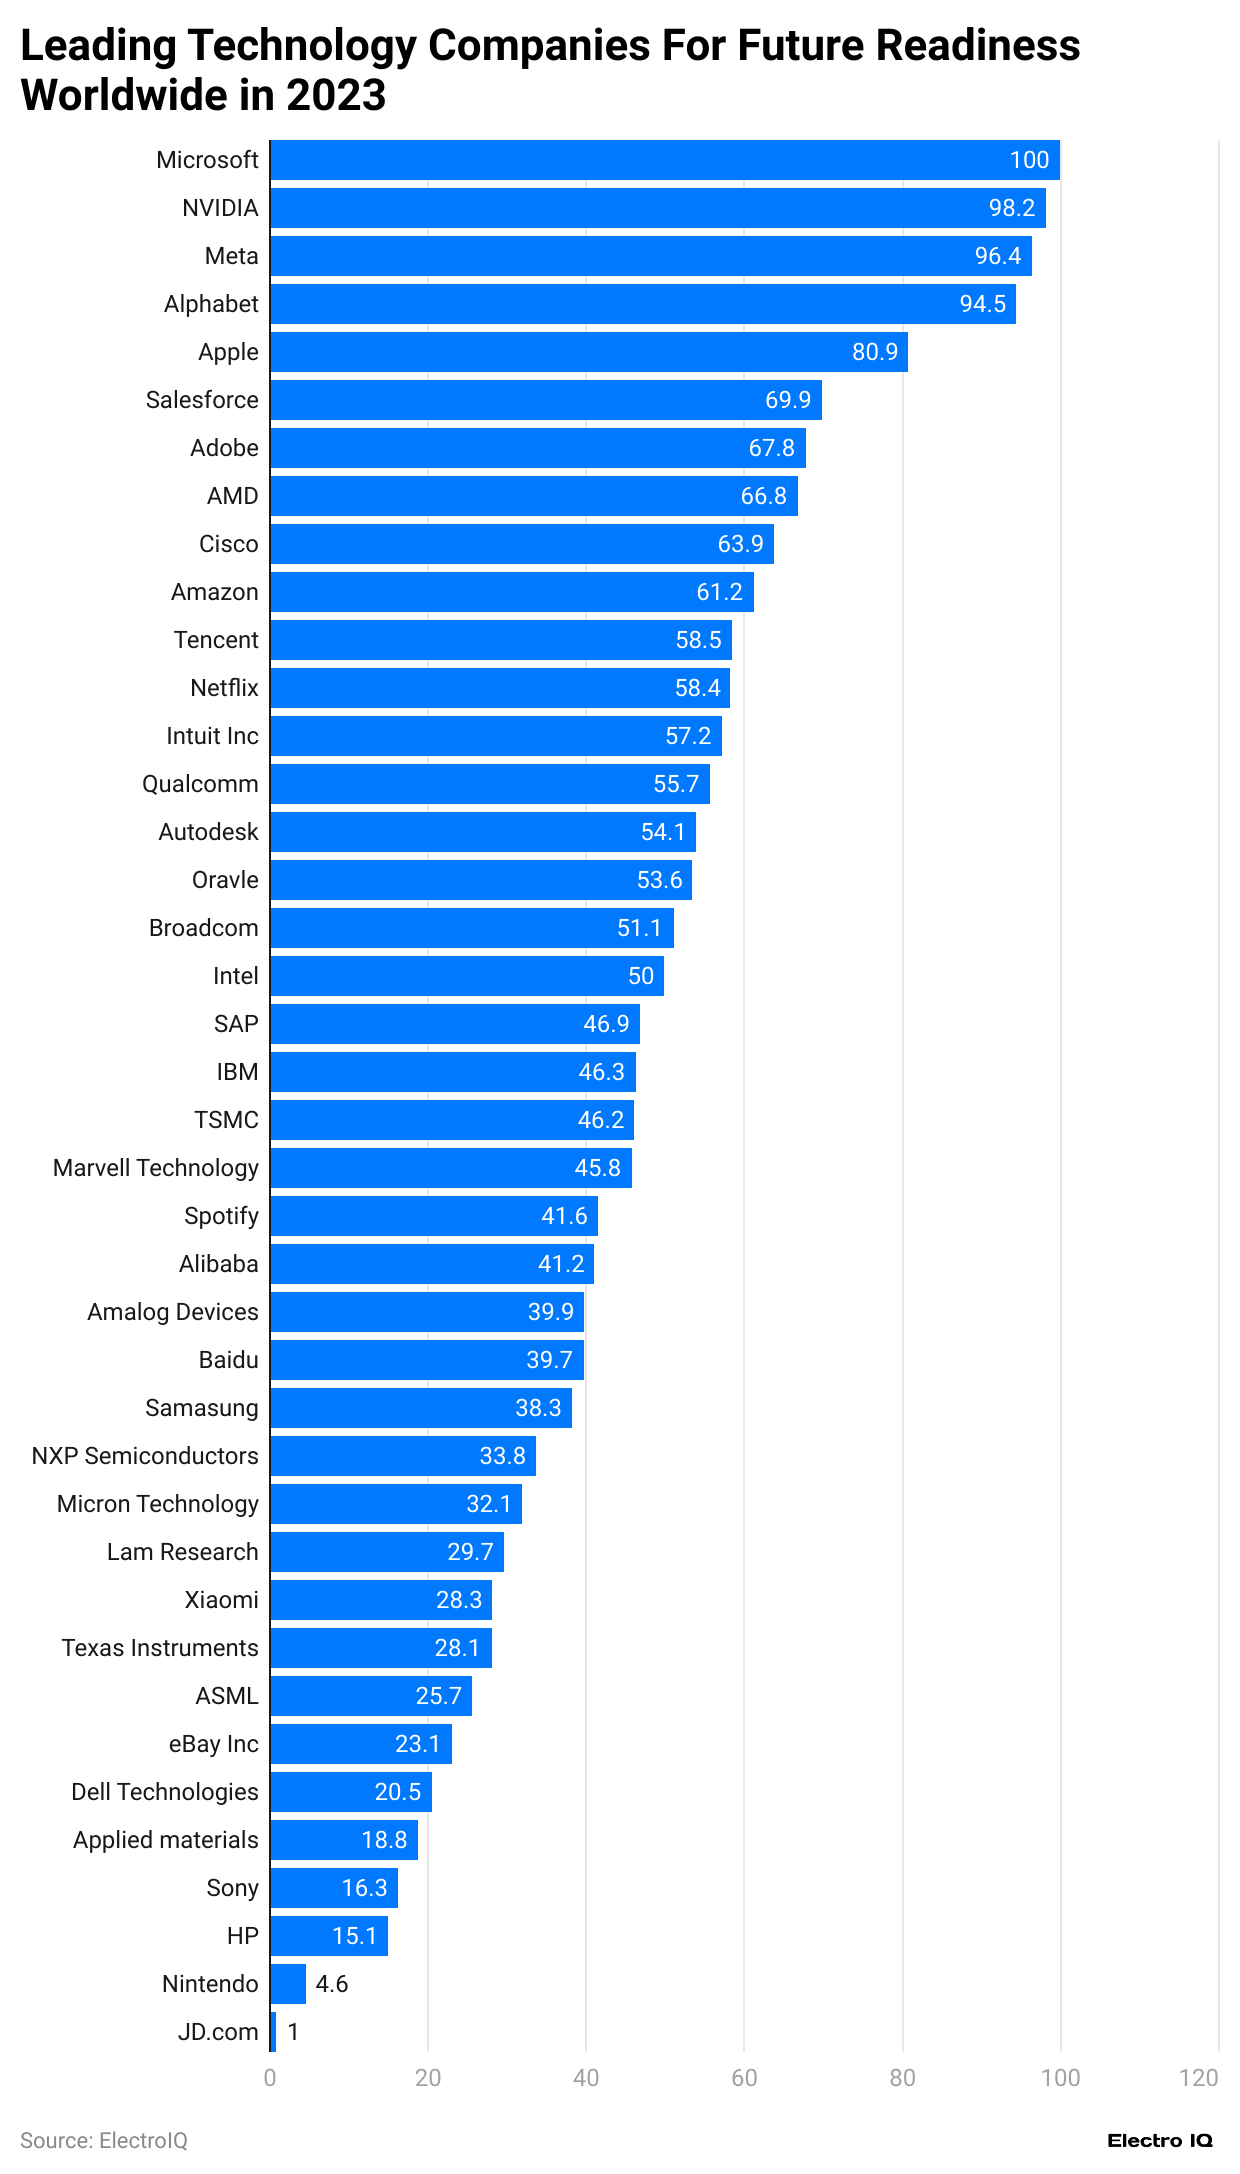
Leading Technologies By Future Readiness
(Reference: statista.com)
- Marvell Statistics show that Spotify, Intel, AMD, IBM, Salesforce, Analog Devices, Dell Technologies, Oracle, Sony, Alphabet, Nvidia, SAP, NXP Semiconductors, Xilinx, Autodesk, Apple, TSMC, Marvell Technology, Texas Instruments, Qualcomm, Microsoft, HP Inc., Cisco, Samsung, Meta, Broadcom, Applied Materials, Amazon, Arm, SK Hynix, Lam Research, Altera, Adobe, Micron Technology rank among top companies worldwide that have future readiness.
- Microsoft has the highest readiness score of 100, followed by NVidia with readiness score of 92.9, Meta with readiness score of 92.4, Alphabet with readiness score of 91.1, Apple with readiness score of 89.9, Salesforce with readiness score of 81.4, Adobe with readiness score of 77.8, AMD with readiness score of 72.4, Cisco with readiness score of 67.8, Amazon with readiness score of 64.9, Tencent with readiness score of 64.6, Intel with readiness score of 57.9, Qualcomm with readiness score of 55.7, Autodesk with readiness score of 51.7, Oracle with readiness score of 51.4, Broadcom with readiness score of 51.1, Intel with readiness score of 49.0, SAP with readiness score of 46.9, IBM with readiness score of 46.2, TSMC with readiness score of 43.2, Marvell Technology with readiness score of 41.6, Spotify with readiness score of 41.6, Alibaba with readiness score of 41.3, Analog Devices with readiness score of 38.0, Baidu with readiness score of 35.8, Samsung with readiness score of 33.6, NXP Semiconductors with readiness score of 33.3, Micron Technology with readiness score of 32.7, Lam Research with readiness score of 30.3, Xilinx with readiness score of 28.7, Texas Instruments with readiness score of 24.3, AT&T with readiness score of 23.1, Sony with readiness score of 22.1, Dell Technologies with readiness score of 21.5, Applied Materials with readiness score of 20.3, Sony with readiness score of 19.4, Nintendo with readiness score of 18.6, Zoom with readiness score of 16.9.
Marvel Technology Acquisitions
| Date | Acquired Company | Expertise | Cost |
| Jan-08 | PicoMobile Networks | Communication software for IWLAN and IMS | |
| 6-Jul-18 | Cavium | ARM Processors | $6B in cash & stock |
| Apr-21 | Inphi Corporation | Mixed-signal integrated circuit | $8.2 billion |
| Jun-02 | SysKonnect | PC networking | |
| Feb-06 | Printer ASIC business of Avago | Printer ASICs | $240M in cash |
| Aug-05 | Hard disk controller division of Qlogic | Hard disk & tape drive controllers | $180M in cash + $45M in stock |
| Sep-19 | Aquantia Corporation | ASICs Multi-Gig Ethernet | $450 million in cash |
| January 20Related | at | Network Processors | |
| Oct-00 | Galileo Technology | Ethernet switches, system controllers | $2700M in stock |
| May-19 | Avera Semi | ASICs | $650 million in cash |
| Oct-21 | Innovium | Data center network switches | $1.1 billion |
| Feb-03 | Radlan | Embedded networking software | $49.7M |
| Jul-06 | XScale product line from Intel | Communications processors and SOCs | $600M in cash |
| Aug-10 | Diseño de Sistemas en Silicio S.A. ("DS2") | Spanish company, PLC communication ICs | |
| Dec-05 | SOC division of UTStarcom | Wireless communications (3G) | $24M in cash |
(Source: wikipedia.org)
Marvell Technology Products
- Brightlane Q120xM - 100BT1 Automotive Ethernet PHY with integrated MACsec and compliant with OPEN Alliance TC10 and IEEE 802.3bw (P/N: 88Q120xM)
- OCTEON TX2 The DPDK - DPDK software package ensures the successful implementation of Marvell’s advanced packet processing and hardware accelerators.
- Structera X 2404 - CXL 2.0 DDR4 4-channel expander with up to 3200/1600 MT/s (2DPC/3DPC) data rates (P/N: MV-SLX24041-A0-HF340AA-C000)
- Liquid Security 2 HSM Adapter - Certified to NIST FIPS 140-3 level 3 and PCI PTS HSM, offering a unified solution for payments and compliance needs.
- 2670 Series - 16GFC PCIe 3.0 delivering over 1.2 Million IOPS
- CNN55xx-BGxx - NITROX V cryptographic offload engines deliver unprecedented performance in enterprise and virtualized cloud data centers.
- OCTEON TX2 CN92XX, CN96xx, CN98xx - DPUs with 12-36 64-bit Arm v8 cores at 2.4 GHz per core, with NITROX® V security accelerator, DPI engine, and PCIe 4.0 support.
- OCTEON Fusion CNF105 - Baseband processor for 5G and LTE-A PHY layer (L1) functionality, including advanced massive MIMO for high-capacity macro base stations.
- 2690 Series - Enhanced 16GFC PCIe 3.0 with Port Isolation technology delivers over 2.6 million IOPS, Universal SAN Congestion Mitigation, with concurrent FCP and FC-NVMe.
- Structera A 2504 - CXL 2.0 DDR5 4-channel accelerator with 16 Arm Neoverse V2 cores and up to 6400 MT/s data rate (P/N: MV-SLA25041-A0-HF350AA-C000)
- Brightlane Q4364 - 2.5G/5G/10GBASE-T1 Automotive Ethernet PHY with integrated MACsec and compliant with IEEE 802.3ch (P/N: 88Q4364)
- ARMADA 7040 - Includes a quad-core ARM Cortex-A72 64-bit processor with up to 1.4 GHz CPU clock speed, supporting up to 6 SerDes lanes, and PCIe 3.0.
- 2740 and 2760 Series - 32GFC PCIe 3.0 Adapters with StorFusion Technology and FC-NVMe support
- OCTEON TX2 CN9130 - A four-core Arm Cortex-A72 DPU with up to 2.2 GHz frequency, supporting high-speed SerDes interfaces and networking, public key, and security acceleration engines.
- Brightlane Q111x - 100BASE-T1 Automotive Ethernet PHY compliant with OPEN Alliance TC10 and 802.3bw (P/N: 88Q111x)
- Brightlane A1512 - 10/100/1000BASE-T PHY, Single Port, EEE, RGMII/SGMII to Copper/Fiber/SGMII Transceiver (P/N: 88EA1512)
- 2870 Series - 64GFC PCIe 4.0 single, dual, and quad-port adapters with Silicon Root of Trust, Universal SAN Congestion Mitigation, and Low Latency FC-NVMe.
- Brightlane Q1010 - 100BASE-T1 Automotive Ethernet PHY, Single Port, MII/RMII/RGMII to Copper Transceiver (P/N: 88Q1010)
- Liquid Security 1 HSM Adapter - Certified to NIST FIPS 140-2 and 140-3 level 3, providing a complete key management and data encryption solution.
- Brightlane Q2233M - Dual 1000BT1 Automotive Ethernet PHY with integrated MACsec, compliant with OPEN Alliance TC10 and IEEE 802.3bp (P/N: 88Q2233M)
- Unified Software Development Kit - DPU SDK platform for OCTEON and ARMADA processors, with DPDK, VPP, and ODP extensions.
- OCTEON 10 CN102, CN103, CN106, and CN106S - Focused on power-sensitive edge applications like 5G transport, SDWAN, SmartNICs, and edge routers.
- Structural X 2504 - CXL 2.0 DDR5 4-channel expander with up to 6400 MT/s data rate and 1x16 or 2x8-port controller configuration (P/N: MV-SLX25041-A0-HF350AA-C000)
- 2770 Series - Enhanced 32GFC PCIe 4.0 single, dual, and quad-port adapters with Silicon Root of Trust and Low Latency FC-NVMe.
- CNN55XX-NHBxx - NITROX V adapters plug into PCI Express Gen1, Gen2, and Gen3 slots for cloud servers and virtual environments.
- Brightlane A1517 - 10BASE-T/100BASE-TX automotive qualified Ethernet PHY layer (P/N: 88EA1517)
- Brightlane Q211x - 100/1000BASE-T1 Automotive Ethernet PHY compliant with IEEE 802.3bp and IEEE 802.3bw (P/N: 88Q211x)
- 2500 Series - 8GFC, PCIe 2.0, low power, backward compatible with 4GFC and 2GFC SANs.
- Brightlane Q222xM - 100/1000BASE-T1 Automotive Ethernet PHY with integrated MACsec, compliant with OPEN Alliance TC10, IEEE 802.3bp and IEEE 802.3bw (P/N: 88Q222xM)
Source:https://www.marvell.com/
Marvell Technology Overview
- Marvell Technology, a prominent player in the semiconductor industry, has consistently shown growth in its financial and operational metrics. The company has focused on delivering solutions for data infrastructure in cloud, enterprise, and 5G, which has led to notable increases in revenues and assets over the past few years.
- As of 2023, Marvell's total revenue reached $5.92 billion, a significant increase compared to previous years. This rise in revenue reflects the company's strategic initiatives in expanding its product line and investing in next-generation technologies. However, projections for 2024 indicate a slight dip in revenue to $5.51 billion, showcasing a modest decrease of approximately 7% compared to the previous year. This could be attributed to shifting market dynamics and increased competition within the semiconductor sector.
- From a research and development (R&D) perspective, Marvell has consistently increased its spending to stay competitive in the evolving technology landscape. In 2023, the company’s R&D expenses amounted to $1.78 billion, marking a significant investment toward innovation. For 2024, Marvell's R&D spending is projected to rise further to $1.9 billion. This increase highlights Marvell’s dedication to enhancing its technological offerings, focusing on 5G infrastructure and cloud computing solutions.
- Marvell’s total assets have also followed an upward trend over recent years. In 2023, the company’s total assets stood at $22.52 billion, the highest recorded in its history. This represents an increase from the $21.23 billion projected for 2024, indicating a slight decrease in asset growth. However, the company’s long-term financial stability remains solid, supported by its strong market presence and consistent investment in infrastructure and innovation.
- Regarding Marvell’s market position, the company maintains a strong foothold in key markets such as the United States and China. In 2023, the company’s operations in the US contributed significantly to its overall revenue, with the US market accounting for a significant share of its total revenue. Marvell has strategically expanded its product offerings to cater to the growing demand for advanced semiconductor solutions in these regions.
- One key metric demonstrating Marvell’s growth is its total assets-to-liabilities ratio, which has remained stable in recent years. In 2023, the company reported a healthy financial balance, with assets outpacing liabilities by a significant margin. For 2024, this trend is expected to continue, showcasing Marvell's ability to manage its financial resources effectively.
- In summary, the Marvell Statistics show that the company has been on a growth trajectory, with 2023 being a pivotal year in revenue, R&D spending, and asset growth. Looking ahead to 2024, Marvell’s focus on strategic investments and market expansion will likely sustain its position as a leader in the semiconductor industry.
Conclusion
Marvell Technology has demonstrated remarkable growth and resilience in the semiconductor industry. Marvell Statistics shows that with the company’s steady increase in R&D spending and expansive global presence generating substantial revenues across multiple regions, Marvell has demonstrated a consistent commitment to innovation and market expansion.
Looking forward, Marvell's strategic investments in research and development and its strong market presence in crucial regions like China and the United States position it well for continued success in the dynamic semiconductor industry landscape.
Sources
FAQ.
Marvell Technology is headquartered in Santa Clara, California.
Marvell’s highest revenue year was 2023, with $5.92 billion in revenue.
China generates the most revenue for Marvell, contributing $2,486.3 million in 2023.
Marvell’s largest acquisition occurred in April 2021, when it acquired Inphi Corporation for $8.2 billion.
Marvell has a future readiness score of 41.6.

Maitrayee Dey has a background in Electrical Engineering and has worked in various technical roles before transitioning to writing. Specializing in technology and Artificial Intelligence, she has served as an Academic Research Analyst and Freelance Writer, particularly focusing on education and healthcare in Australia. Maitrayee's lifelong passions for writing and painting led her to pursue a full-time writing career. She is also the creator of a cooking YouTube channel, where she shares her culinary adventures. At Smartphone Thoughts, Maitrayee brings her expertise in technology to provide in-depth smartphone reviews and app-related statistics, making complex topics easy to understand for all readers.


