Paysafe Statistics By Revenue, Factual Data And Trends (2025)
Updated · Nov 24, 2025


Table of Contents
Introduction
Paysafe Statistics: In the shifting world of digital payments and fintech, companies that smoothly connect consumers and merchants across multiple payment methods play a crucial role. PaySafe is one such player. 2025 is a pivotal year for Paysafe. Will it still be able to expand, reduce risk, and produce profits?
In this article, we will analyse the performance of Paysafe up to the middle of 2025 through some factual data, percentages, and trends. We look at revenues, volumes, profits, segments, cash flows, debt, valuation metrics, and projections.
Editor’s Choice
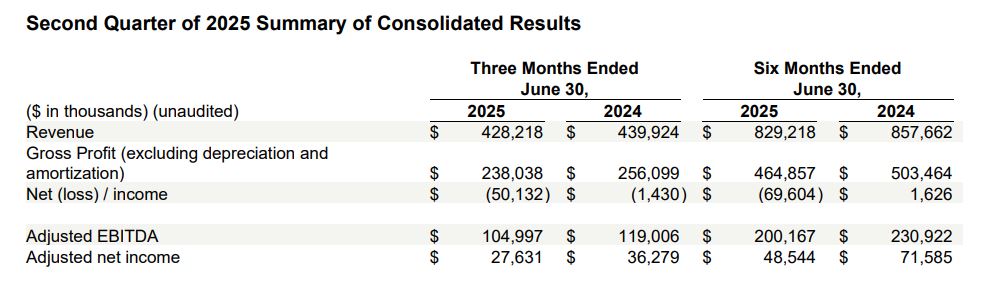
- Paysafe posted revenues of US$428.2 million in the second quarter of 2025, down 3% from US$439.9 million in the second quarter of 2024, in relation to the direct marketing payments processing business sale.
- Merchant Solutions continued the 6% organic growth track with e-commerce at double-digit growth, while Digital Wallets were up by 3%.
- Paysafe reported a net loss of US$50.1 million against a loss of US$1.4 million in Q2 2024 and mainly because of a non-cash tax expense of US$30.6 million linked to deferred tax assets in the U.K.
- Adjusted EBITDA decreased 12% to US$105.0 million, compared with US$119.0 million in the second quarter of 2024.
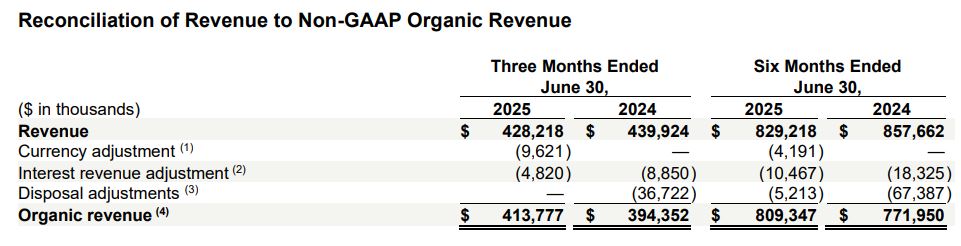
- Organic revenues in Q2 2025 were recorded at US$413.8 million compared with US$394.4 million in Q2 2024, reflecting an increase of 5% in underlying true performance.
- Organic revenues in the first half of 2025 were US$809.3 million, compared with US$771.9 million a year ago, representing a 4.9% increase year-on-year.
- Merchant Solutions brought in US$232.2 million in Q2 2025 and US$450.0 million in the first half, with 6% organic growth fueled by e-commerce expansion.
- Digital Wallets revenue rose to US$201.2 million in Q2 2025 and US$388.7 million in the first half, maintaining steady organic growth at 3%.
- GAAP gross profit was US$170.5 million in Q2 2025, down from US$187.5 million in 2024, compared to non-GAAP gross profit of US$238 million, down from US$256.1 million the prior year.
- Adjusted net income per share (diluted) was US$0.46 for Q2 2025, down 23% from US$0.59 a year earlier.
- In the first half of 2025, adjusted net income per share (diluted) was US$0.80, down 32% from US$1.16 in the same period of 2024.
- Paysafe’s revenue base, adjusted for the disposed businesses of 2024, was about US$790 million in 2024 versus US$829 million in 2025, indicating 5% organic growth year on year.
- Existing customers drove 13% growth, while new sales and new products accounted for 4% of growth.
Paysafe’s Q2 2025 Financial Performance
(Source: d1io3yog0oux5.cloudfront.net)
- As per the company report, Paysafe’s statistics show that it reported a revenue of US$428.2 million in the second quarter of 2025, down 3% from US$439.9 million in the same period of 2024.
- The downfall mainly resulted from the disposal of its direct marketing payments processing business, which had accounted for US$36.7 million in revenues in 2024.
- However, apart from revenues coming from the business that was disposed of, organic revenues actually steadied up by 5%, highlighting that Paísafe’s core businesses are indeed growing.
- Within growth, Merchant Solutions rose 6%, with a push of double-digit growth in e-commerce, while Digital Wallets grew 3%.
- Even though there was growth in the core business, Paysafe reported a net loss of US$50.1 million compared to a slight loss of US$1.4 million in the same quarter last year.
- The larger loss was primarily due to a non-cash tax charge of US$30.6 million in relation to a valuation allowance on the company’s UK deferred tax assets.
- Importantly, such a charge does not affect Paysafe’s actual cash taxes-It is an accounting adjustment.
- It was the higher losses that were experienced mainly due to the discontinued business and increased non-operating costs, along with foreign exchange losses and legal fees.
- Paysafe’s adjusted net income, excluding certain one-time and non-cash expenses, decreased by US$27.6 million from US$36.3 million last year, with lower Adjusted EBITDA dragging the numbers down with a 12% drop to US$105.0 million from US$119.0 million.
- About 24 percentage points of this decline were due to the disposed business.
- Yet, the company did incur some cost savings from reduced selling, general, and administrative expenses.
- Currency exchange movements aided results, bringing about US$9.6 million in revenue and US$2.5 million in Adjusted EBITDA, somewhat offset by a US$4 million decrease in both revenue and EBITDA from lesser interest income on consumer deposits.
- Operating cash flow stood at US$39.6 million, as compared to US$54.1 million last year, and unlevered free cash flow likewise fell to US$53.9 million from US$70.0 million.
Paysafe Organic Revenue
(Source: d1io3yog0oux5.cloudfront.net)
- The table below shows Paysafe’s calculation of organic revenue from total reported revenue after adjustments have been made for specified factors.
- In the quarter ended June 30, 2025, total revenue amounted to US$428.2 million, while for the corresponding period in 2024 it amounted to US$439.9 million.
- In reality, to know whether the business grew or not, the company tries to exclude the effects of currency movements, interest income on customer deposits, and revenue from businesses that were sold off.
- In 2025, there was a currency adjustment of US$9.6 million, negative, which means exchange rate movements increased the reported revenue by that amount.
- Interest revenue adjustments stood at minus US$4.8 million in 2025, reflecting the exclusion from organic results of that part of interest revenue.
- Adjustments in 2024 were even higher, as disposed-business adjustments amounted to US$36.7 million and interest revenue adjustments amounted to US$8.9 million, as those would otherwise have boosted last year’s totals overly much.
- On these grounds, after adjustment, organic revenue stood at US$413.8 million for Q2 2025, against US$394.4 million for Q2 2024, so despite all appearances to the contrary of total revenue, the core operations actually grew year-on-year by approximately 5%.
- For the six months ended June 30, 2025, total revenue was US$829.2 million compared with US$857.7 million in the prior year.
- Following adjustment for currency effects, lower interest income, and the disposed business (contributed US$67.4 million in the prior year), organic revenue stood at US$809.3 million for 2025 vis-à-vis US$771.9 million for 2024—approximately a 4.9% boost.
Paysafe Revenue By Segments
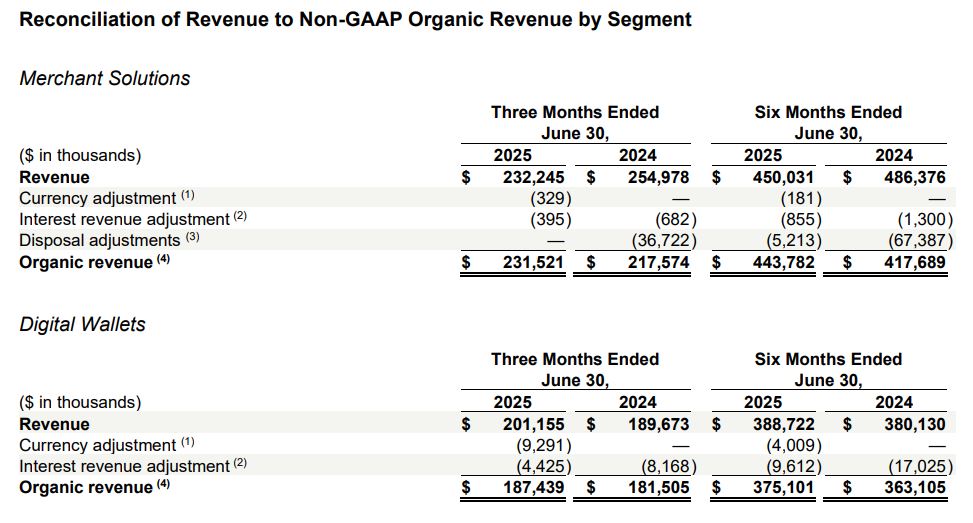
(Source: d1io3yog0oux5.cloudfront.net)
- In Merchant Solutions, there was a reported revenue of US$232.2 million for the second quarter of 2025, down from US$255.0 million in Q2 2024.
- This comparison is distorted by the sale of a business line in 2024, which contributed US$36.7 million of revenue in that year.
- Adjusting for that disposal, currency effects, and interest income, the organic revenue of this segment turns out to be US$231.5 million for 2025 as compared with US$217.6 million for 2024.
- This means that despite the reported decline, Paysafe’s core Merchant Solutions business actually experienced around 6% growth year over year, with a further contribution mainly from e-commerce.
- Merchant Solutions’ revenue saw a total of US$450.0 million for the first six months of 2025, whereas the same period in 2024 registered US$486.4 million.
- Discounting the effects of currency, interest, and the disposed business (which in 2024 had added US$67.4 million), revenues would be US$443.8 million in 2025, vis-à-vis US$417.7 million in 2024, in line with about 6% growth for the first semester.
- Coming to the Digital Wallets segment, it registered revenues of US$201.2 million for Q2 2025 as compared with US$189.7 million recorded for Q2 2024 — showing modest improvement.
- Adjusted for conversion and interest income, organic revenue for Digital Wallets was US$187.4 million in 2025, up from US$181.5 million a year earlier, anchoring 3% organic growth.
- For the six months ended June 30, 2025, Digital Wallets revenue reached US$388.7 million, compared to US$380.1 million in the same period of 2024.
- Excluding interest and currency effects, organic revenue stood at US$375.1 million in 2025, up from US$363.1 million in 2024, about a 3% growth rate.
Paysafe Gross Profit

(Source: d1io3yog0oux5.cloudfront.net)
- Paysafe registered US$428.2 million in total revenues for the second quarter of 2025, slightly diminished from US$439.9 million in the same quarter of 2024.
- The cost of services, which directly represents the costs of processing transactions and providing payment services but does not include depreciation and amortization, was US$190.2 million in the quarter ended June 2025, compared to US$183.8 million year-ago.
- The gross profit, legally considered, stood at US$170.5 million in Q2 2025 after deducting such costs in addition to depreciation and amortization totalling US$67.6 million, which in Q2 2024 was US$187.5 million, recording a decline of the order of about 9%.
- Non-GAAP gross profit adds back depreciation and amortization, so Paysafe’s non-GAAP gross profit (goods and services net of depreciation and amortization), in the second quarter of 2025, was US$238.0 million, down from US$256.1 million a year ago.
- It is considered a better parameter for measuring Paysafe’s performance since it is an indication of the company’s core profitability, disregarding non-cash charges.
- For the first half (January through June) of 2025, Paysafe reported total revenue at US$829.2 million compared to US$857.7 million for the first half of 2024.
- With an increase in the cost of services from US$354.2 million to US$364.4 million, depreciation and amortization stood at US$135.9 million versus US$136.9 million last year.
- The result was GAAP gross profit of US$329.0 million in H1 2025, down from US$366.5 million in 2024.
- On a non-GAAP basis, however, depreciation and amortization excluded gross profit was US$464.9 million in 2025 as compared to US$503.5 million the previous year.

(Source: d1io3yog0oux5.cloudfront.net)
- The data shows Paysafe’s adjusted net income per share for the three-month and six-month periods ended June 30, 2025, compared to the corresponding periods in 2024.
- These figures allow investors to discern the company’s profitability, not affected by one-off or non-cash charges whose incidence is reflected in GAAP results.
- For the second quarter of 2025, Paysafe’s adjusted net income, i.e., profit after adjustments, amounted to US$27.6 million as against US$36.3 million in Q2 2024, reflecting lower operating incomes and the disposal of the company’s business in 2024.
- As for the shares, the company had an average of 59.3 million basic shares outstanding in Q2 2025, which is somewhat less when compared with 60.7 million for Q2 2024.
- Considering dilution, which usually arises from stock options or other convertible instruments, diluted share counts for 2025 were 59.4 million versus 61.2 million for the previous year.
- With these numbers, Paysafe’s adjusted net income per share stood at US$0.47 (basic) and US$0.46 (diluted) in Q2 2025, representing a 23% drop from the earnings per share of US$0.60 (basic) and US$0.59 (diluted) recorded in the same quarter of 2024.
- During the first six months of 2025, the company’s adjusted net income stood at US$48.5 million, compared with US$71.6 million during the same period in 2024 – a decline of about 32%.
- The average number of basic shares during the year was 59.6 million in 2025 versus 61.2 million in 2024, and for diluted shares, the count was 60.5 million in 2025 versus 61.7 million in 2024.
- Resultantly, the adjusted net income per share was US$0.82 (basic) and US$0.80 (diluted) for the first half of 2025, while it was US$1.17 (basic) and US$1.16 (diluted) for the same period in 2024.

(Source: d1io3yog0oux5.cloudfront.net)
- This figure shows the total revenue of Paysafe and its change from the first six months of 2024 to the first half of 2025, with a further breakdown of the year-over-year changes into their respective contributing factors.
- Paysafe registered total revenues of US$858 million during H1 of 2024. Approximately US$67 million out of that amount was contributed by one business that the company later disposed of.
- Removing this one-time contribution set the adjusted 2024 revenue base for continuing operations at roughly US$790 million.
- From this allowed base, Paysafe suffered some customer attrition, thus decreasing revenue by some 12%.
- This implies a reduction in sales from those existing clients who either scaled down their transaction volumes or simply ceased to contract Paysafe’s services.
- Meanwhile, revenues from the existing customers that remained with Paysafe increased by almost 13%, indicating strong engagement and transaction growth by continuing clients. New business and NPI added a further approximately 4%.
- Accordingly, total revenue for the first six months of 2025 reached US$829 million, reflecting an overall decline compared to US$858 million in the first half of 2024 but a strong underlying organic upsurge when the one-off factors are set aside.
Conclusion
Paysafe Statistics: Paysafe’s financial performance in the first half of 2025 paints a somewhat mixed but hopeful picture. In reported terms, revenue decreased almost marginally to US$829 million on account of the disposal of a business line, whilst in organic terms it grew at 5%, showing that core activities remain strong- core Merchant Solutions and Digital Wallets.
Net loss further widened through the application of a UK non-cash tax charge and increased non-operating costs; however, adjusted metrics, including new customer revenues and revenues from incumbent customers, continue to see growth, suggesting Paysafe is overcoming the market headwinds while holding on to the growth model for the future.
Sources
FAQ.
Paysafe recorded US$428.2 million in revenue in Q2-2025, down by 3% from US$439.9 million in Q2-2024 due to dispositions of its direct marketing payments processing business.
Paysafe was recording an organic revenue increase of 5% excluding the disposed business, Merchant Solutions by 6%, and Digital Wallets by 3% indicating a solid performance in e-commerce and digital payments.
Net loss of US$50.1 million was mainly on account of non-cash UK tax charges of US$30.6 million, a decline in operating income of US$16 million from the disposed business, and increases in non-operating expenses.
Adjusted EBITDA was down by 12% to US$105 million, with adjusted net income per diluted share also dropping from US$0.59 in Q2 2024 to US$0.46 in Q2 2025, on account of lower operating income and one-time adjustments.
Revenue from existing customers grew 13%, new sales and product introductions contributed 4%, and overall organic growth of 5% offset customer attrition and the disposed business impact.

I hold an MBA in Finance and Marketing, bringing a unique blend of business acumen and creative communication skills. With experience as a content in crafting statistical and research-backed content across multiple domains, including education, technology, product reviews, and company website analytics, I specialize in producing engaging, informative, and SEO-optimized content tailored to diverse audiences. My work bridges technical accuracy with compelling storytelling, helping brands educate, inform, and connect with their target markets.