Samsung Electronics Statistics By Market Share, Net Worth, Revenue, Region, Trends and Facts (2026)
Updated · Mar 14, 2026

Table of Contents
- Introduction
- Editor’s Choice
- Samsung Electronics Sales And Operational Profit
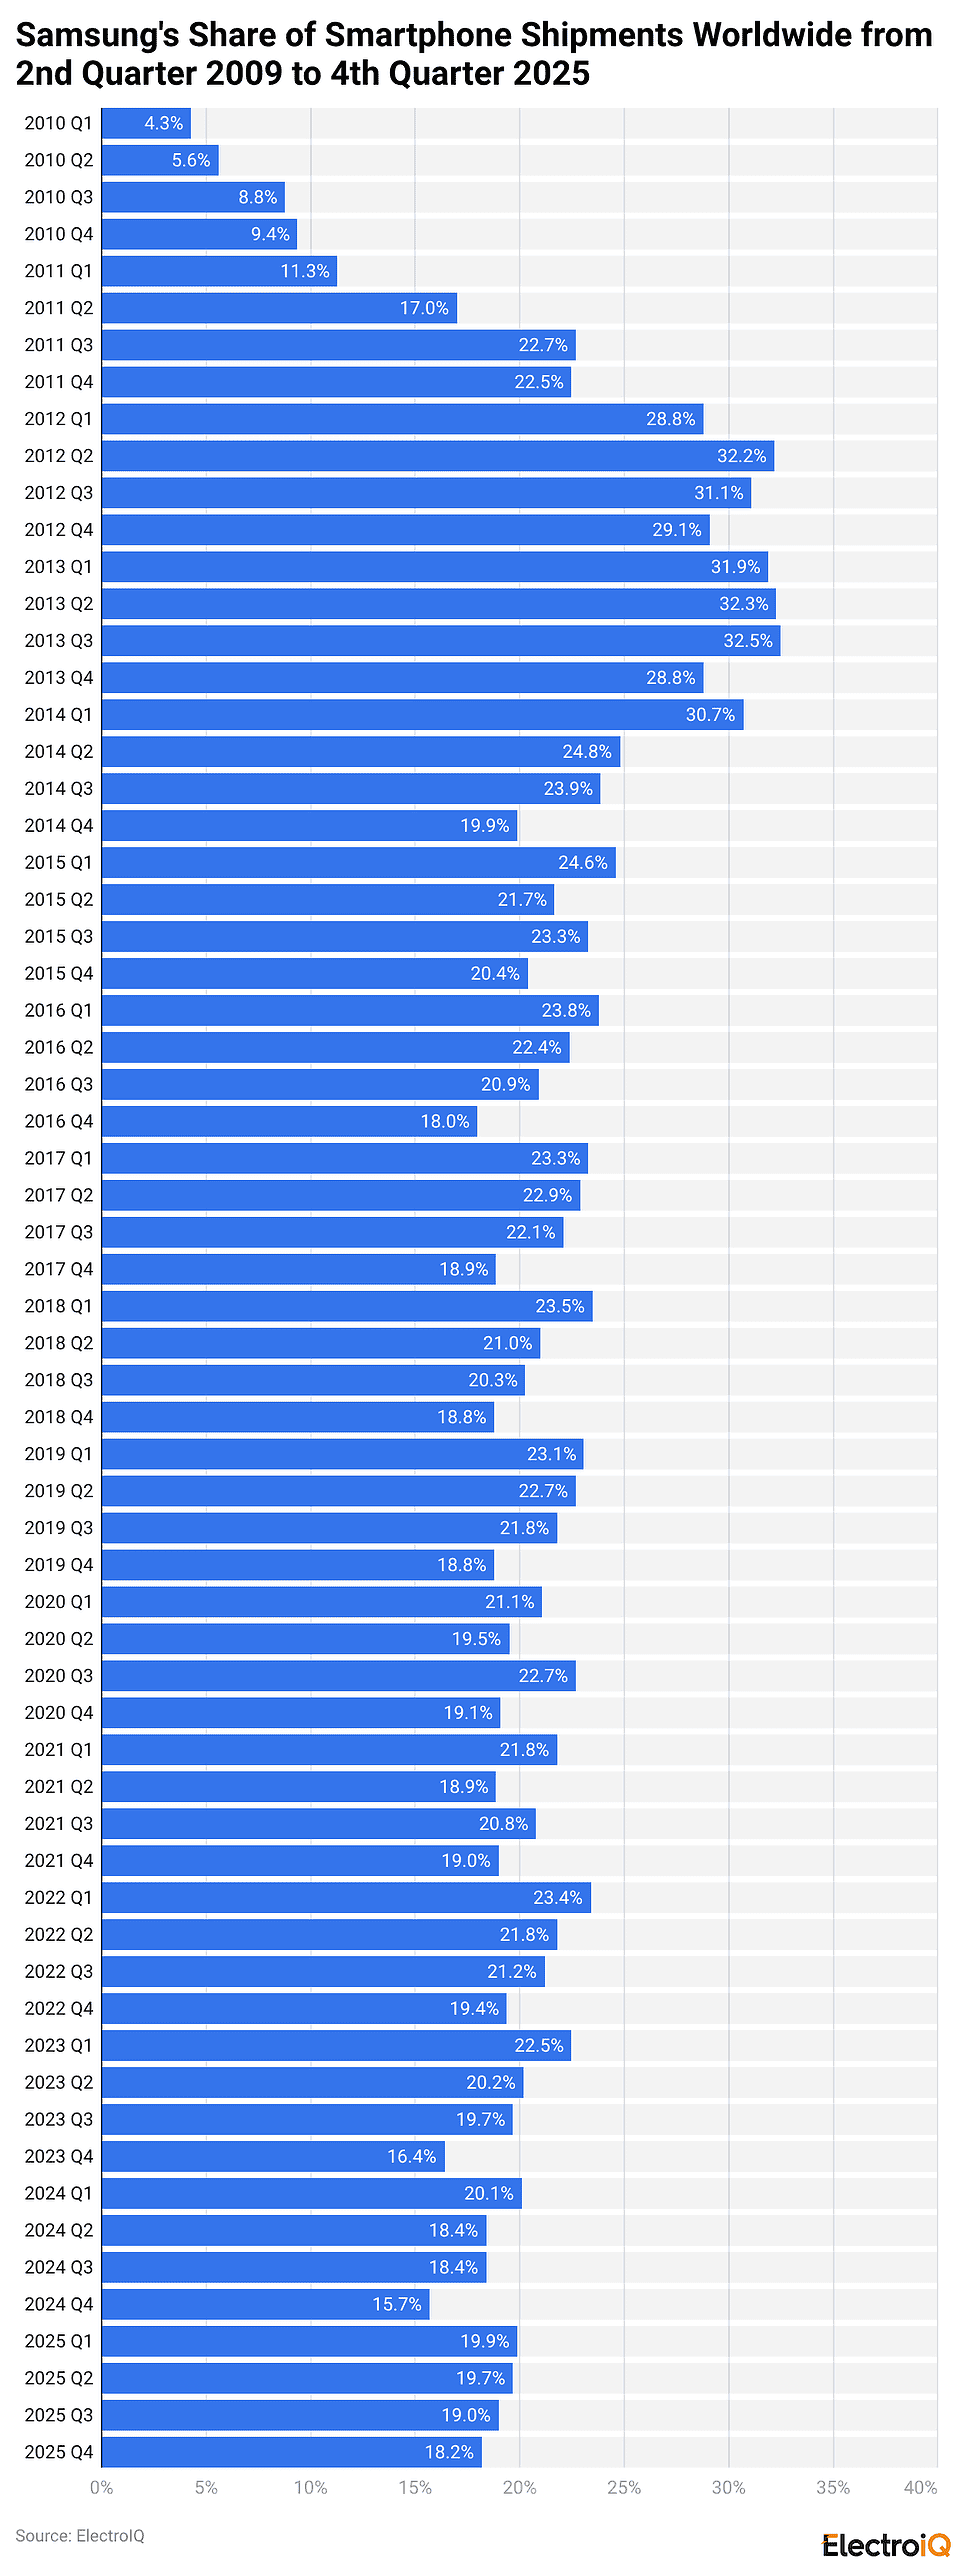
- Samsung’s Share Of Smartphone Shipments Worldwide
- Samsung’s Market Position From 2009 To 2025
- Samsung Electronics Semiconductor
- Samsung Electronics Inventories
- Samsung Electronics Share Capital
- Net Worth Of Samsung Company
- Samsung Electronics Revenue By Segment
- Samsung Electronics Share Of Revenue By Region
- Samsung’s Products
- Samsung Competitive Landscape And Market Rivalries
- Conclusion
Introduction
Samsung Electronics Statistics: Samsung Electronics Co., Ltd. established itself as a leading innovative company that operates multiple technology fields when it developed semiconductor, display, smartphone, and consumer electronics products in 2025. The global digital transformation creates increased demand for artificial intelligence systems, high-bandwidth memory chips, advanced semiconductor technologies, and high-end connected devices. The 2025 performance of Samsung shows how the business opportunities and operational challenges exist in the market because the company achieved its highest revenue and made strategic investments while maintaining its leading position in important business areas.
The article conducts an extensive investigation of Samsung Electronics’ 2025 performance through its financial data, semiconductor market position, smartphone sales, research and development expenditures, and other metrics.
Editor’s Choice
- Samsung Electronics reported KRW 333.6 trillion in revenue in 2025, up from KRW 258.9 trillion in 2023 (29% two-year growth).
- The 2025 revenue increased by 10.9% compared to the previous year, which recorded KRW 300.9 trillion in 2024.
- The operating profit climbed to KRW 43.6 trillion in 2025 from KRW 6.6 trillion in 2023, representing 560% growth.
- The operating margin increased from 2.5% (2023) to 13% (2025).
- The smartphone market shipped 61.2 million units in Q4 2025, accounting for an 18.2% share of the global market.
- The total smartphone market in 2025 reached 241.2 million units, representing 19.1% of the worldwide market share.
- The DS Division achieved Q3 2025 results of KRW 33.1 trillion in revenue and KRW 7.0 trillion in operating profit, which represents approximately 21% profit margin.
- The 2025 inventories reached KRW 58.48 trillion, a 3.1% increase from the previous year.
- The finished goods inventory decreased to KRW 13.98 trillion, indicating stronger product sales performance.
- 2024–2025 buybacks reduced ordinary shares by ~142 million shares (2.4%).
- Net worth increased from USD 41.54B (2005) to USD 294.69B (2025)—over 610% growth. Americas’ revenue share rose from 29% (2011) to 39% (2024).
- Mobile Experience (MX) revenue peaked at USD 24.6B in Q3 2024, showing product-cycle seasonality.
Samsung Electronics Sales And Operational Profit
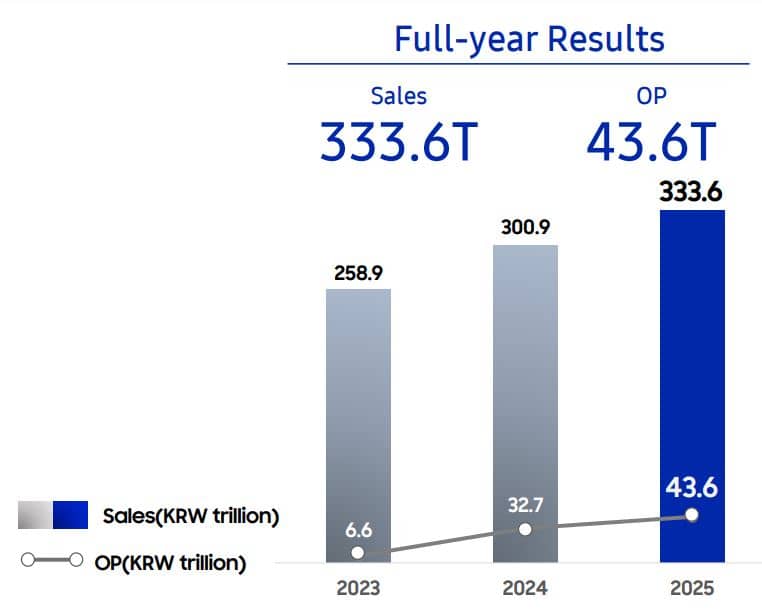
(Source: samsung.com)
- The current financial performance of Samsung Electronics shows that the company has achieved a substantial increase in both its profits and its ability to manage operational costs.
- The company achieved sales of KRW 333.6 trillion in 2025, which represented an increase from KRW 300.9 trillion in 2024 and KRW 258.9 trillion in 2023 because of two years of growth that reached almost 29%.
- The company achieved continuous revenue growth, which demonstrated that customer demand had improved and the company had successfully enhanced its product distribution.
- The more convincing transformation happens in operating profit (OP). Profits increased dramatically from KRW 6.6 trillion in 2023 to KRW 32.7 trillion in 2024 and reached KRW 43.6 trillion in 2025.
- The period from 2023 to 2025 showed an extraordinary growth rate of 560 %.
- The company achieved operational margin increases, which started at approximately 2.5 % in 2023 and reached around 13 % in 2025 because of its effective cost management and the recovery of the semiconductor market.
- The performance of Samsung Electronics demonstrates that the company has entered a period of earnings recovery after experiencing industry-wide market fluctuations.
- The company achieved revenue growth of about 10.9%, which extended from 2024 to 2025 because of permanent structural changes that created ongoing business growth.
(Reference: statista.com)
- Samsung’s smartphone development path has become one of the most important business growth achievements in the present-day consumer electronics market.
- According to recent Samsung Electronics statistics, the company shipped 61.2 million smartphones in Q4 2025, capturing 18.2% of global shipments, while Apple led the quarter with 24.2%.
- Samsung achieved a market share of 19.1% through its sale of 241.2 million units during 2025, which demonstrated its ability to maintain operational volume and reach customers.
Samsung’s Market Position From 2009 To 2025
- Samsung’s market share increased from 3% in Q2 2009 to 32.2% in Q2 2012, representing almost a tenfold increase over three years.
- The smartphone market has seen only a few competitors achieve growth rates that matched this pace of development.
- The Galaxy series, which Samsung introduced in 2009 as its primary growth product, led to an explosion of international smartphone use during this time.
- The ability of Nokia to control almost half of the market in 2007 ended when the company fell to approximately 3% market share by 2013 because of the unpredictable nature of mobile phone industry leadership.
- Samsung and Apple have maintained their status as leading companies for more than 15 years.
- The company achieves operational excellence through its ability to maintain almost 20 % of worldwide shipments in a market that has become completely established with multiple product lines that include both high-end and mid-range items.
Samsung Electronics Semiconductor
- The semiconductor industry, experiencing recovery, does not demonstrate cyclical fluctuations but instead shows permanent growth because artificial intelligence systems create new infrastructure needs.
- The latest Samsung Electronics statistics show that the DS Division achieved KRW 33.1 trillion in Q3 2025 revenue and KRW 7.0 trillion in operating profit, which results in an operating margin of around 21%—this achievement represents a significant improvement beyond the 2023 downturn period.
- All current business developments depend on the Memory Business operations.
- The company achieved its highest quarterly revenue through its aggressive expansion of HBM3E sales, which now reaches full mass production for all primary customers.
- HBM4 samples are now being delivered to strategic clients, which indicates strong future business development prospects. Improved ASPs (average selling prices) and reduced one-off inventory adjustment costs further amplified profitability.
- The industry estimates show that HBM demand increases at a yearly rate between 30 to 40% because AI server installations drive the growth.
- Samsung intends to use its high-density eSSDs and 128GB+ DDR5 and 24Gb GDDR7 products to meet AI and traditional server requirements, which will start in Q4 2025.
- The company will begin HBM4 mass production in 2026 while it expands 1c node capacity and develops advanced products such as LPDDR5x and QLC SSDs, which serve AI workloads.
- System LSI during this period experienced seasonal challenges and customer inventory adjustments while maintaininga premium SoC supply.
- The company needs to develop its Exynos platform together with its unique image sensors to reach its goals in 2026.
Samsung Electronics Inventories
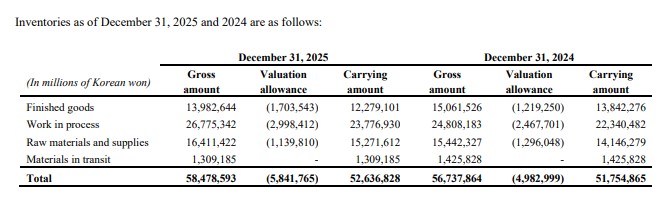
(Source: londonstockexchange.com)
- The most recent Samsung Electronics data shows that inventory levels will reach stable levels before 2026.
- The total gross inventories on December 31 2025, reached KRW 58.48 trillion, which represented a 3.1 % increase from the 2024 inventory total of KRW 56.74 trillion.
- The provision for risk assessment increased to KRW 5.84 trillion from the previous year’s allocation of KRW 4.98 trillion, which indicates that the company adopted conservative practices to manage unpredictable market conditions.
- The total inventory valuation reached KRW 52.64 trillion, which marks an increase from the 2024 total of KRW 51.75 trillion.
- The most significant inventory components include work in process, which amounts to KRW 26.78 trillion, and raw materials, which total KRW 15.27 trillion, because these items reflect Samsung’s extensive semiconductor manufacturing process.
- The finished goods inventory decreased from KRW 15.06 trillion to KRW 13.98 trillion, which demonstrates better sales performance and stable product demand.
- The inventory distribution of Samsung Electronics demonstrates the company’s ability to meet future AI semiconductor requirements while upholding its valuation security needs.
- The Samsung Electronics data shows that the company maintains operational equilibrium, which enables business development while keeping financial integrity.
(Source: londonstockexchange.com)
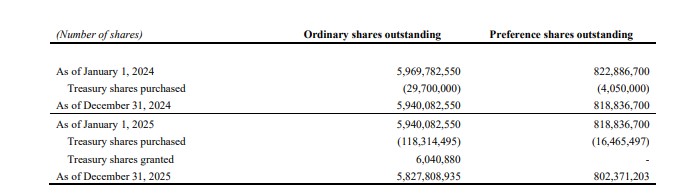
- New Samsung Electronics data show that the company uses its capital management system to increase shareholder value through its treasury stock buyback program.
- The number of ordinary shares that existed on January 1 2024, decreased to 5940082550 by the end of 2024 after the company repurchased 29700000 shares.
- Samsung bought back 1183 million shares while it retired 64 million shares, which brought down its total shares to 5827808935 by December 31 2025.
- The total shares decreased from 5940000000 to 57900000,00 which represents a 24% decline across two years.
- The preference share count decreased from 822886700 at the beginning of 2024 to 802371203 by the end of 2025, which showed the company’s ongoing efforts to optimize its capital.
- The buybacks show that Samsung Electronics has confidence in its ability to generate cash flow and maintain its actual business value.
- The reduction of share count automatically increases earnings per share (EPS) until operational improvements start to produce results.
- The Samsung Electronics data shows that institutional investors believe the company practices effective balance sheet control because it uses extra cash to boost earnings per share while keeping its capital structure intact.
Net Worth Of Samsung Company
| Date | Net Worth (in Billion USD) | Change |
| 2005 | 41.54 | / |
| 2006 | 52.26 | 0.2581 |
| 2007 | 60.42 | 0.1561 |
| 2008 | 50.65 | -16.17% |
| 2009 | 63.45 | 0.2527 |
| 2010 | 79.27 | 0.2493 |
| 2011 | 87.84 | 0.1081 |
| 2012 | 117.02 | 0.3322 |
| 2013 | 142.28 | 0.2159 |
| 2014 | 153.46 | 0.0786 |
| 2015 | 152.33 | -0.74% |
| 2016 | 160.07 | 0.0508 |
| 2017 | 201.19 | 0.2569 |
| 2018 | 221.94 | 0.1031 |
| 2019 | 227.33 | 0.0243 |
| 2020 | 253.99 | 0.1173 |
| 2021 | 256.24 | 0.0089 |
| 2022 | 281.35 | 0.0980 |
| 2023 | 281.15 | -0.07% |
| 2024 | 274.08 | -2.51% |
| 2025 | 294.69 | 0.0751 |
- The long-term valuation curve reflected in recent Samsung Electronics statistics demonstrates both cyclical volatility and structural expansion.
- In 2005, Samsung’s net worth stood at USD 41.54 billion. By 2012, it had nearly tripled to USD 117.02 billion, reflecting a compound annual growth rate (CAGR) of roughly 16–18% during its global smartphone and semiconductor expansion phase.
- Growth accelerated further between 2016 and 2018, rising from USD 160.07 billion to USD 221.94 billion, a gain of nearly 38% in two years.
- The 2017 surge alone delivered 25.69% growth, coinciding with peak semiconductor pricing cycles.
- Despite temporary corrections—such as -16.17% in 2008, -2.51% in 2024, and marginal contractions in 2015 and 2023—the broader trajectory remains upward.
- By 2025, net worth reached USD 294.69 billion, marking an overall increase of more than 610% since 2005. Even with periodic slowdowns, valuation resilience is evident, particularly during global downturns.
- These Samsung electronics statistics illustrate a company deeply tied to technology cycles yet structurally positioned for long-term capital appreciation.
- From a macro-financial lens, the data underscores balance sheet strength, innovation-led growth, and the strategic importance of semiconductors within overall enterprise valuation trends.
Samsung Electronics Revenue By Segment
(Source: tridenstechnology.com)
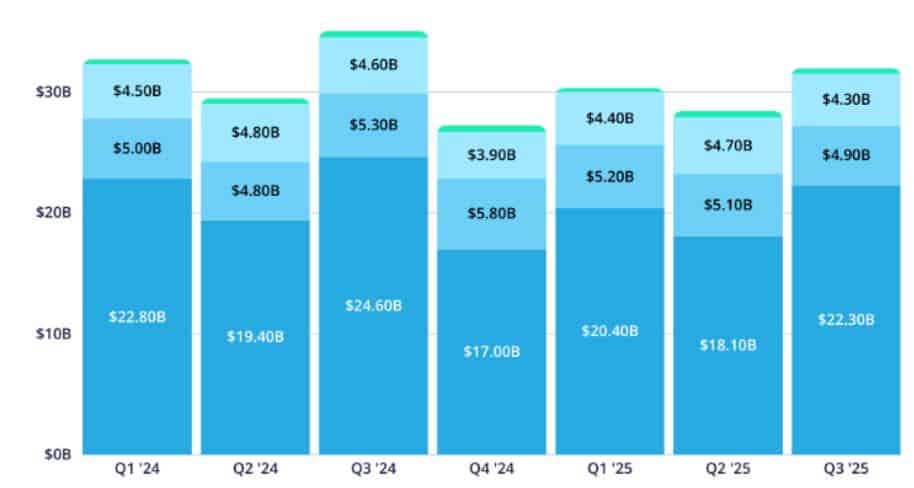
- According to Statista, Samsung Electronics’ latest statistics show that the Mobile Experience (MX) division maintains its dominant position, while other business units show stable performance with minor changes.
- The MX revenue for 2024 ranged from USD 17.0 billion in Q4 to USD 24.6 billion in Q3, driven by seasonal patterns following the release of major smartphone devices.
- The Q3 2024 peak shows product cycle activity, while Q4 weakness indicates the period after a product launch has ended.
- The performance of MX financials started at USD 20.4 billion in Q1 2025, then decreased to USD 18.1 billion in Q2, before reaching USD 22.3 billion in Q3, showing both cyclical patterns and strong operational results.
- The Visual Display (VD) segment maintained its stable performance by generating quarterly revenues between USD 5.1 billion and USD 5.3 billion,n which reached a peak of USD 5.8 billion during Q4 2024 due to increased holiday demand.
- Digital Appliances (DA) maintained a narrow revenue band between USD 3.9–USD 4.8 billion, showing consistent but mature market performance.
- The Networks (NW) segment had lower revenue than other segments but experienced revenue changes between USD 0.34 billion and USD 0.54 billion because of its project-based revenue model.
- The Samsung Electronics statistics demonstrate multiple revenue streams that support the financial growth of the company because MX drives increased revenue while VD and DA maintain steady income.
- The company maintains balanced portfolio management through its selection of business segments, which creates balanced tracking of Samsung electronics financial performance.
- According to Statista, Long-term Samsung Electronics statistics show that the company has shifted its revenue sources to different regions during the last ten years.
- The Americas increased their share from 29% in 2011 to 39% in 2024, while reaching their highest point of 39% during both 2022 and 2024.
- The 10% increase demonstrates that North America experiences higher premium device sales, together with increased semiconductor requirements.
- European markets experienced only minor changes until they reached their current state of market maturity, which shows 17 to 19 % growth between 2011 and 2012.
- Chinese market contributions showed high volatility, which resulted in an increase to 18 % during 2013 and 2016, followed by a decrease to 11 % in 2023 before reaching 16 % in 2024. The existing market conditions show high competition, together with shifting international political relations.
- Korea maintained a steady band between 10% and 17%, highlighting domestic stability without overdependence.
- The “Other” category reached its highest point of 22% during 2015, after which it declined to 13% in 2024, which indicates that companies in emerging markets have optimized their portfolios.
- The Samsung Electronics statistics show that the company relies more on its American market while still keeping access to various international markets.
- The organization uses balanced regional allocation as a risk management strategy, which helps to reduce the effects of economic downturns.
- The changing composition of Samsung electronics statistics shows that the company has developed global operations instead of focusing on specific regional markets.
Samsung’s Products
- The premium ecosystem of Samsung products creates the foundation for its products to deliver their maximum performance.
- The Galaxy S series maintains its position as the top smartphone worldwide, which continues the pattern established by recent Samsung electronics data that showsthe mobile business generates about 40 to 45 % of its quarterly earnings.
- The product reaches its maximum market value through its flagship position, which maintains durable profit margins while achieving higher average sales prices.
- QLED 8K TVs maintain their position as the top product in the premium display market because they meet the increasing customer needs for high-definition home viewing systems.
- The Galaxy Tab S10, which runs on Galaxy AI, helps Samsung expand its tablet range during the period when customers need more productivity tools.
- Samsung Electronics data demonstrate that companies generate most of their income through products that drive their technological advancements.
Samsung Competitive Landscape And Market Rivalries
- The device and component markets face intense competition, according to SamsungElectronicss data.
- Samsung competes with Apple, Huawei, Xiaomi, and LG Electronics in the smartphone and consumer electronics markets, where they use pricing, ecosystem, and premium products to increase their market shares.
- The memory semiconductor market faces strong competition between Samsung, SK Hynix, and Micron Technology, which specifically affects the profitability of the DRAM and NAND markets.
- Sony functions as a major competitor in the field of imaging sensors. Samsung electronics data show that various competitor threats impact revenue patterns and research development activities within the company.
Conclusion
Samsung Electronics Statistics: The performance of Samsung in 2025 shows structural recovery, which slams cyclical fortune. The revenue growth, together with the 560% operating profit recovery and the return to average margins, shows the semiconductor cycle strength and the company’s effective cost management. The smartphone market exhibits permanent growth through smartphone shipments that exceed 240 million units in a worldwide market that has reached saturation. The company demonstrates its financial responsibility through inventory normalization and share buybacks, which strengthen its financial situation.
The company achieves risk management through geographic expansion that increases its presence in the Americas while reducing its dependence on the Chinese and European markets.. The data demonstrates that the technology conglomerate uses AI-driven semiconductor demands to create a high-end consumer ecosystem,s which helps it maintain market leadership.
FAQ.
The total revenue of the company reached KRW 3336 trillion, which marked a 10.9% increase compared to 2024.
The operating profit reached KRW 43.6 trillion, which resulted in approximately 13% profit margins.
The company sold 241.2 million units of smartphones to customers worldwide.
The company held approximately 19.1% market share throughout the entire year.
The company’s net worth reached USD 294.69 billion.
The operating profit shows 560% growth which occurred in the two-year period.

Tajammul Pangarkar is the co-founder of a PR firm and the Chief Technology Officer at Prudour Research Firm. With a Bachelor of Engineering in Information Technology from Shivaji University, Tajammul brings over ten years of expertise in digital marketing to his roles. He excels at gathering and analyzing data, producing detailed statistics on various trending topics that help shape industry perspectives. Tajammul's deep-seated experience in mobile technology and industry research often shines through in his insightful analyses. He is keen on decoding tech trends, examining mobile applications, and enhancing general tech awareness. His writings frequently appear in numerous industry-specific magazines and forums, where he shares his knowledge and insights. When he's not immersed in technology, Tajammul enjoys playing table tennis. This hobby provides him with a refreshing break and allows him to engage in something he loves outside of his professional life. Whether he's analyzing data or serving a fast ball, Tajammul demonstrates dedication and passion in every endeavor.