Table of Contents
Introduction
Sharp Corporation Statistics: Sharp Corporation (シャープ株式会社, Shāpu Kabushiki-gaisha) is a renowned Japanese electronics company headquartered in Sakai, Osaka. Founded in 1912 by Tokuji Hayakawa in Honjo, Tokyo, the company initially operated as the Hayakawa Metal Works Institute in Abeno-ku, Osaka, starting in 1924. Since 2016, Sharp has been majority owned by Hon Hai Precision Industry Co., Ltd. (Foxconn), a Taiwan-based manufacturer.
Over the years, Sharp has diversified its product portfolio, manufacturing a wide range of consumer electronics, including kitchen appliances such as microwave ovens, cookers, washing machines, and refrigerators. It also produces home appliances like solar cells, vacuum cleaners, air purifiers, and lighting, along with office and home devices such as printers, computer displays, TVs, camcorders, VCRs, calculators, and audio products like radios, audio systems, and wireless speakers.
Sharp’s financial performance in fiscal year 2022 (ending February 29, 2024) recorded net sales of 2.55 trillion yen, a slight increase from 2.5 trillion yen in the previous year, reflecting steady growth and resilience in the competitive consumer electronics market.
Editor’s Choice
- Sharp’s total net sales peaked at ¥2,548,117 million in 2023 but decreased to ¥2,321,921 million in 2024.
- Domestic sales fell from ¥800,315 million in 2023 to ¥772,968 million in 2024.
- Overseas sales decreased from ¥1,747,802 million in 2023 to ¥1,548,953 million in 2024.
- Operating profit turned positive at ¥84,716 million in 2022 but then turned into losses of ¥25,719 million in 2023 and ¥20,343 million in 2024.
- Profit before income tax fell drastically from ¥89,802 million in 2022 to losses of ¥239,043 million in 2023, with some recovery to a loss of ¥137,563 million in 2024.
- Net assets shrank from ¥469,269 million in 2022 to ¥222,362 million in 2023 and further down to ¥157,424 million in 2024.
- Total assets peaked at ¥1,956,288 million in 2022, falling to ¥1,590,032 million in 2024.
- Capital investment recorded the highest at USD 91,572 million in 2021 but fell to USD 44,512 million in 2023 before edging up to USD 47,647 million in 2024.
- R&D expenditures steadily decreased from USD 100.59 billion in 2020 to USD 73.02 billion in 2024, marking a cumulative drop of 27.4%.
- Income per share was 121.14 yen in 2022 but slipped into negative territory in 2023 (-407.31 yen) and again in 2024 (-230.99 yen).
- The workforce diminished from 52,876 in 2020 to 43,445 in 2024, a 17.8% reduction.
- Cash and cash equivalents increased to ¥219,128 million in 2024, up ¥12,515 million from the previous year.
- Operating cash flow surged to ¥124,495 million in 2024, up from ¥14,746 million in 2023.
- Investing cash flow improved by ¥51,843 million, while financing cash flow showed a negative ¥149,668 million, primarily due to debt repayment.
Sharp Net Sales
 (Reference: global.sharp)
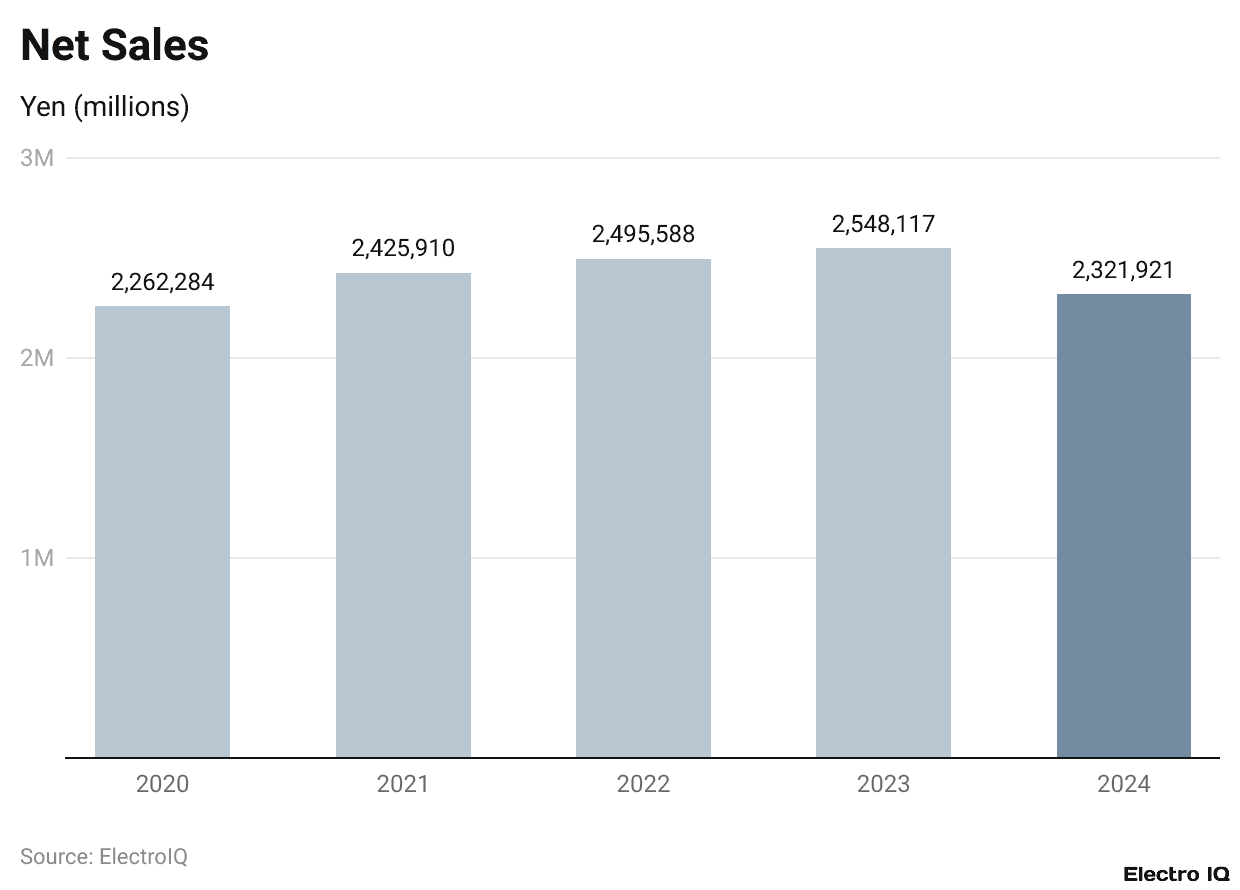
- In 2020, Sharp Corporation recorded total net sales of ¥2,262,284 million.
- In 2021, net sales grew to ¥2,425,910 million, marking a notable rise in revenue.
- The upward trend continued in 2022 with net sales reaching ¥2,495,588 million, reflecting strong performance.
- In 2023, Sharp achieved the highest net sales in the five years, totaling ¥2,548,117 million.
- However, in 2024, net sales declined significantly to ¥2,321,921 million, indicating a downward trend in overall revenue.
- The breakdown of net sales into domestic and overseas figures shows that domestic sales in 2020 were ¥778,976 million.
- Domestic sales increased to ¥863,154 million in 2021, reflecting growth in Japan.
- Domestic sales fell to ¥817,794 million in 2022, continuing the decline to ¥800,315 million in 2023.
- Domestic sales dropped further in 2024 to ¥772,968 million, marking the lowest figure in the five years.
- Overseas sales in 2020 stood at ¥1,483,308 million, and increased to ¥1,562,755 million in 2021.
- Overseas sales continued to rise, reaching ¥1,677,794 million in 2022.
- In 2023, overseas sales peaked at ¥1,747,802 million, the highest for the period.
- However, in 2024, overseas sales dropped significantly to ¥1,548,953 million.
- Overall, Sharp experienced growth in both domestic and overseas markets from 2020 to 2023, with overseas sales contributing the most.
- In 2024, both domestic and overseas sales declined, contributing to the fall in total net sales, which could be attributed to factors like economic recession, supply chain disruptions, or increased competition in key markets.
Sharp Operating Profit
 (Source: global.sharp)
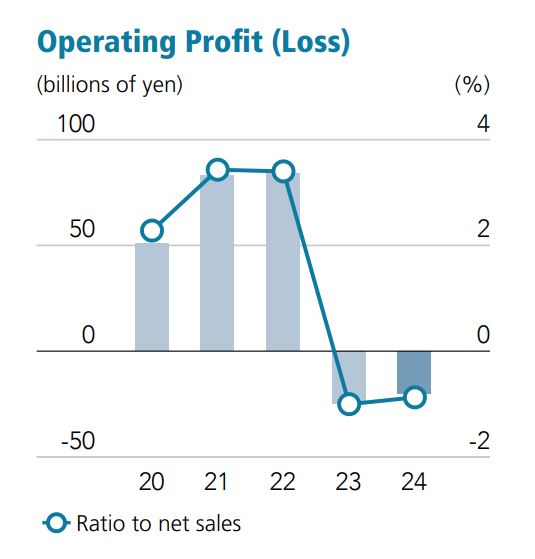
- Sharp Corporation recorded operating profits of ¥51,464 million in 2020.
- Operating income increased to ¥83,112 million in 2021 and ¥84,716 million in 2022, indicating a gradual improvement in business performance and operational efficiencies.
- In 2023, Sharp Corporation experienced an operating loss of ¥25,719 million, suggesting severe financial difficulties, likely due to rising costs, falling sales, or macroeconomic conditions.
- The operating loss improved slightly in 2024, amounting to ¥20,343 million, indicating some recovery efforts were underway.
- Profit before tax was ¥32,331 million in 2020, with a significant increase to ¥66,442 million in 2021, reflecting strong financial health during those years.
- In 2023, Sharp Corporation faced an immense pre-tax loss of ¥239,043 million, indicating extraordinary financial distress, large write-offs, or other substantial challenges.
- Recovery efforts were seen in 2024, but the company still posted a massive pre-tax loss of ¥137,563 million, suggesting ongoing financial pressures.
Sharp Net Assets
 (Reference: global.sharp)
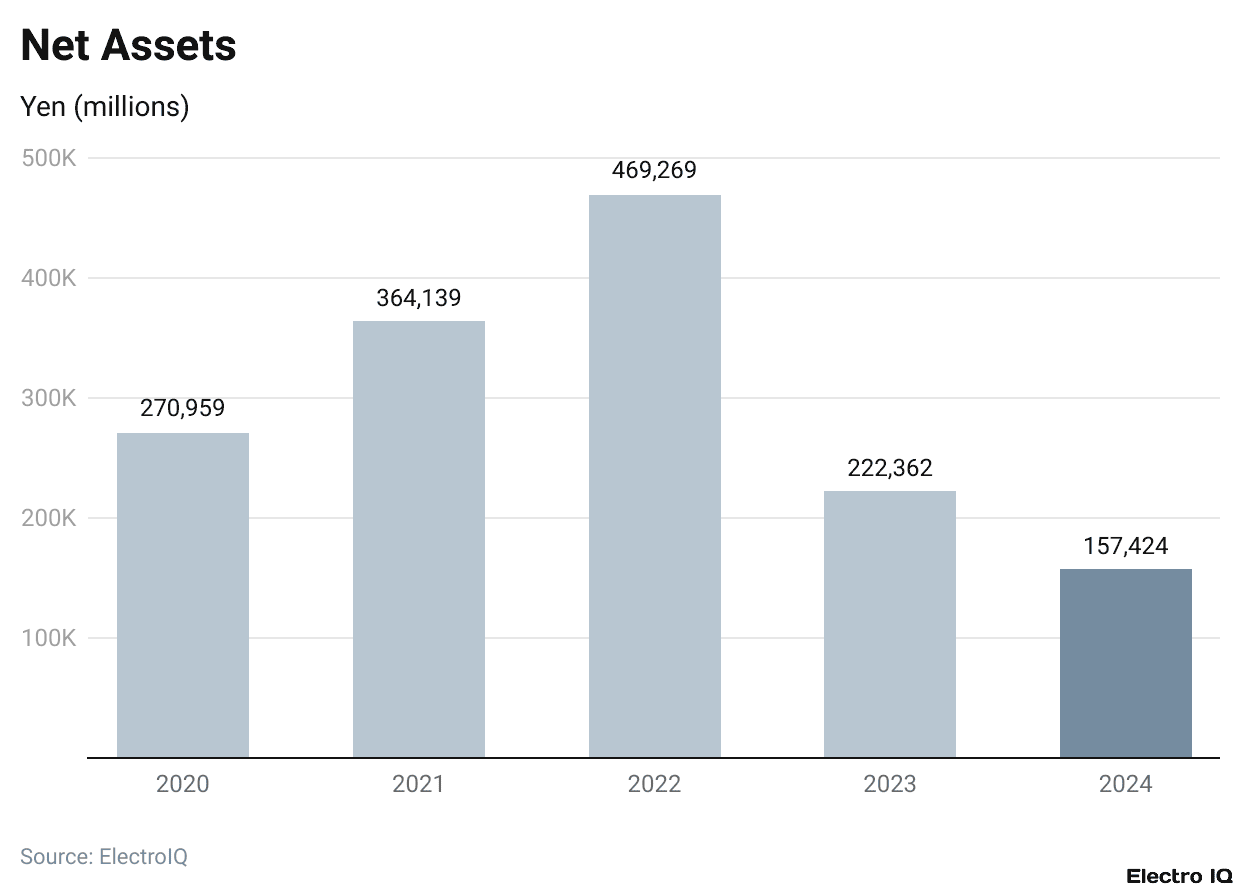
- In 2020, Sharp’s net assets were USD 270,959.
- Sharp’s net assets grew significantly in 2021 to USD 364,139 and reached USD 469,269 in 2022.
- In 2023, Sharp’s net assets dropped to USD 222,362, reflecting a decrease of 52.6% from 2022.
- Net assets continued to decline in 2024, falling further to USD 157,424, which represents a decrease of 29.2% from 2023.
- Total assets stood at USD 1,811,907 in 2020.
- Total assets increased to USD 1,927,226 in 2021 and further rose to USD 1,956,288 in 2022.
- In 2023, total assets declined to USD 1,772,961, a decrease of 9.4% from 2022.
- Total assets continued to decline in 2024, falling to USD 1,590,032, representing a decrease of 10.3% from 2023.
- Sharp experienced increases in both net assets and total assets from 2020 to 2022, but both indicators significantly declined in 2023 and 2024.
- The sharp decline in net assets and total assets during the last two years suggests potential financial challenges, possibly due to a lack of profitability, increased liabilities, or operational inefficiencies.
- The decline in total assets may indicate asset liquidation, decreased investment, or restructuring efforts to address financial difficulties.
Sharp Capital Investment
 (Reference: global.sharp)
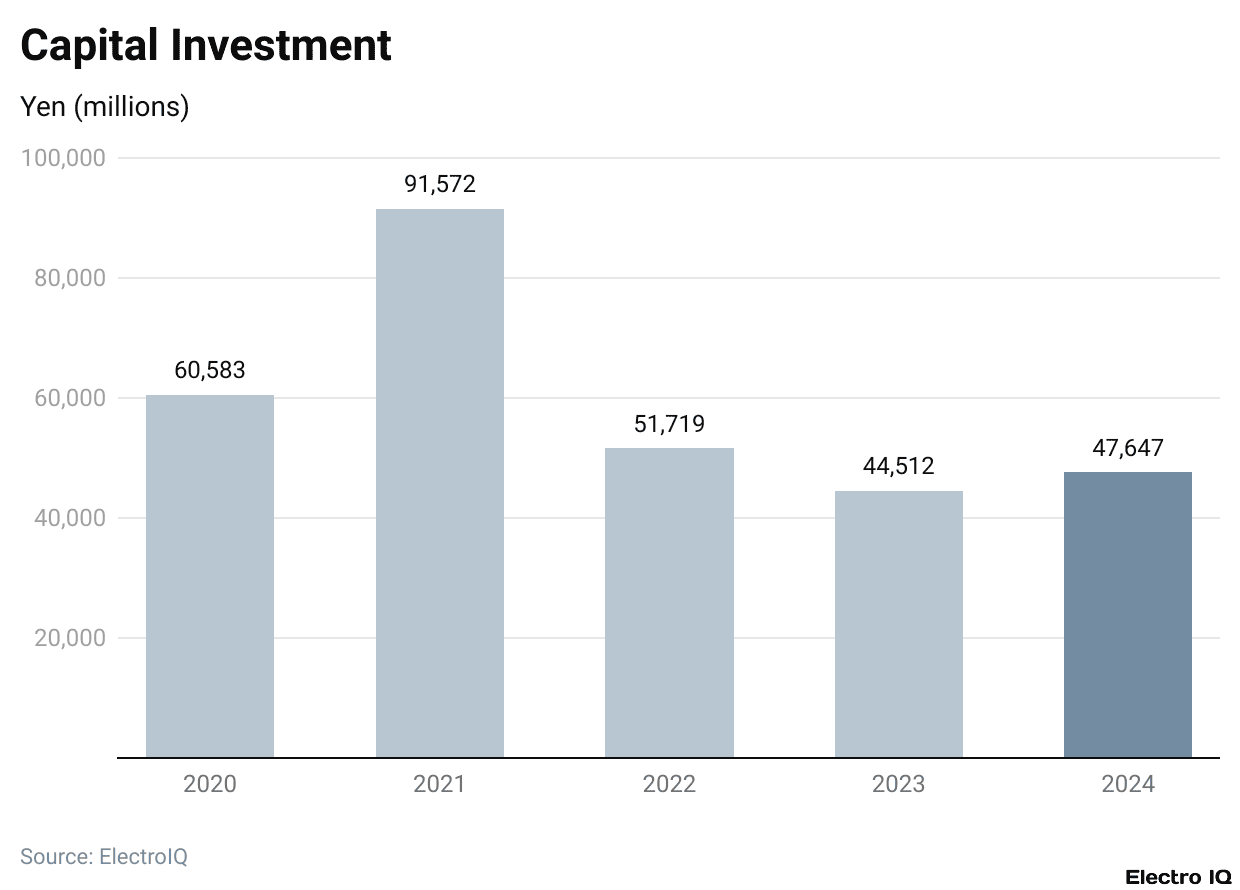
- In 2020, capital investment was USD 60,583.
- In 2021, capital investment rose significantly to USD 91,572, the highest figure during the five years.
- In 2022, capital investment dropped to USD 51,719, representing a 43.5% decrease compared to 2021.
- In 2023, investment further declined to USD 44,512, showing an additional drop of 14% compared to 2022.
- In 2024, capital investment rebounded slightly to USD 47,647, reflecting a 7% growth compared to 2023, but still far lower than the record levels of 2021.
- The data reveals a trend of fluctuations in capital investment, with one strong peak in 2021, followed by a decline and a minor recovery in 2024.
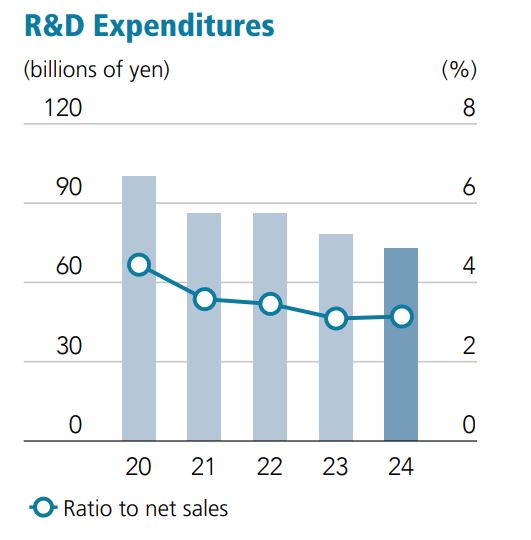
Sharp R&D Expenditures
 (Source: global.sharp)
- In 2020, Sharp expended USD 100.59 billion on research and development, marking the peak expenditure for the last five years.
- In 2021, Sharp’s R&D spending dropped significantly to USD 86.79 billion, reflecting a 13.7% decline compared to 2020.
- In 2022, R&D spending continued to decrease, falling to USD 86.29 billion, a 0.6% reduction from the previous year.
- The largest decrease occurred in 2023, with R&D spending declining to USD 78.71 billion, an 8.8% drop from 2022.
- In 2024, Sharp further reduced its R&D budget to USD 73.02 billion, representing a 7.2% decline from 2023 and a 27.4% total decline since 2020.
- The steady reduction in R&D spending may indicate a shift in Sharp’s strategic direction, potentially focusing more on maximizing existing technologies rather than developing new ones.
- The income per share started at 22.47 yen in 2020 and increased steadily to 121.14 yen in 2022. However, there was a drastic decline in 2023, with a loss of (-407.31 yen), and a negative value of (-230.99 yen) was recorded in 2024.
- Cash dividends per share increased from 18.00 yen in 2020 to 40.00 yen in 2022. No dividends were issued in 2023 and 2024, presumably due to the company’s financial challenges.
- Net assets per share increased from 419.54 yen in 2020 to 743.70 yen in 2022. However, there was a sharp decline to 321.05 yen in 2023 and further decreased to 219.35 yen in 2024, indicating a decrease in the company’s net worth.
- Return on Equity (ROE) was positive from 2020 to 2022, peaking at 18.4% in 2022. In 2023, ROE turned negative with (-78.7%) and worsened further to (-85.5%) in 2024, reflecting substantial losses.
- The outstanding common share count increased from 531,307 thousand shares in 2020 to 649,301 thousand shares in 2024, suggesting the issuance of additional shares, likely for fundraising.
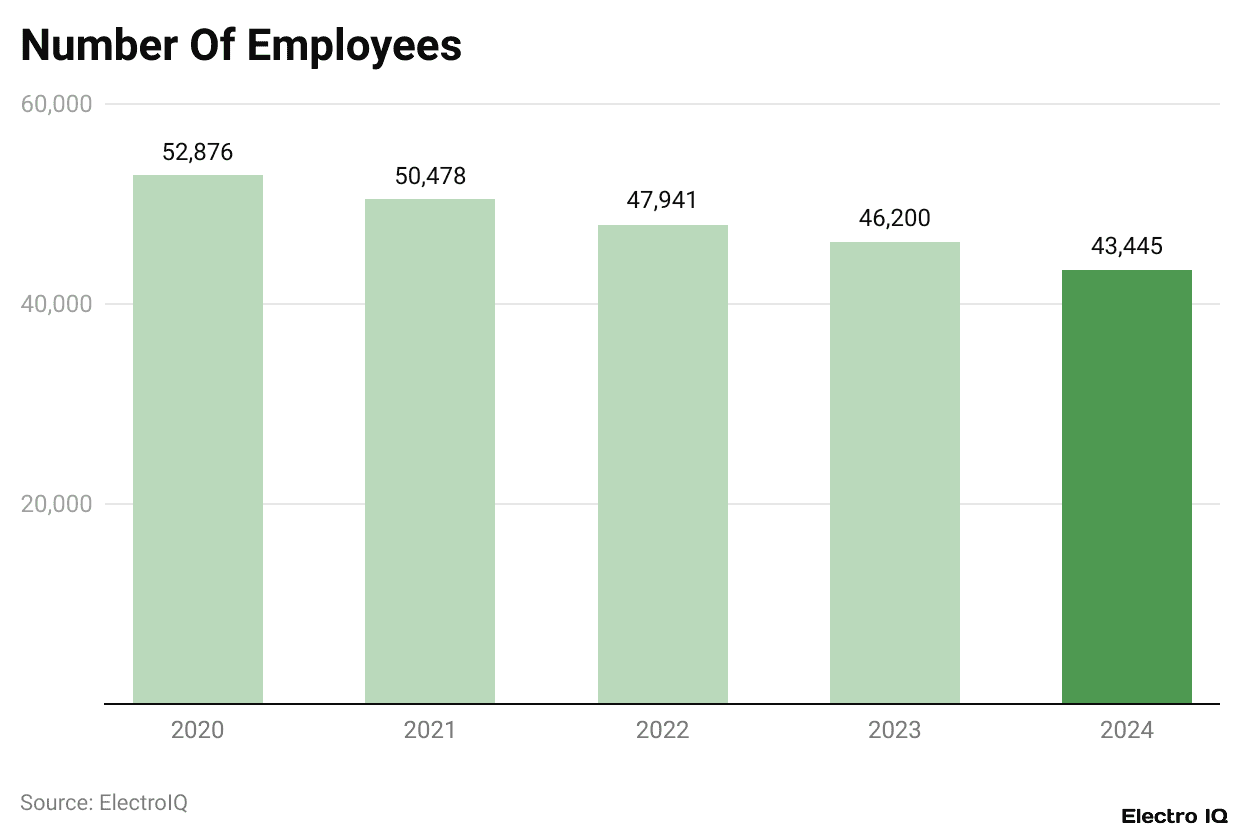
Sharp Number Of Employees
 (Reference: global.sharp)
- Sharp Corporation Statistics theorise that the decline in employees at Sharp Corporation is systematic and continuous, going from the year 2020 to 2024.
- The employees initially numbered 52,876 in the year 2020, but they started to decrease slowly every year until they reached 43,445 by 2024.
- That is about a 17.8% decline over 5 years, and it can allude to restructuring, cost aversion, or some switch in business approach.
- Given that the ratio of disabled employees is stated to have remained tightly bound around 2.43%-2.46% for the years 2020-2023, one could argue that there might have been a focus on inclusive hiring practices.
- In 2024, this rate increased slightly to 2.58%, suggesting that Sharp still might care about diversity and inclusion in the midst of workforce reductions.
- This hints at Sharp’s desire to sustain or perhaps strengthen its African credibilities, diversity, and inclusion approach while contemplating shrinking its workforce.
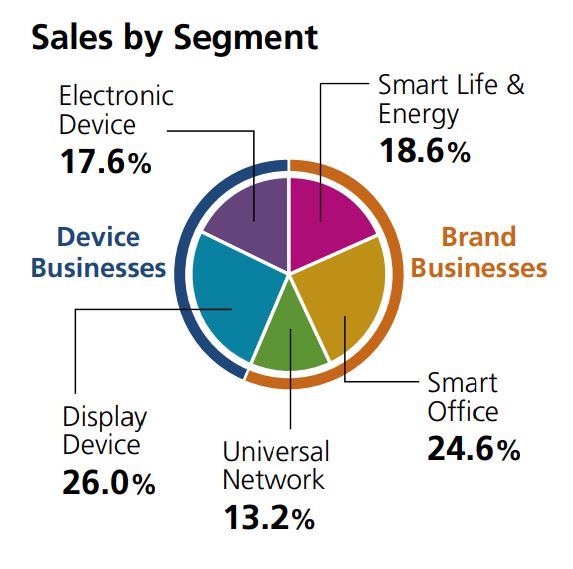
Sales By Segment
 (Source: global.sharp)
- In 2024, Sharp’s earnings are split across different segments, each contributing more or less to the total revenue of the company.
- The Electronic Device segment contributes 17.6% of total sales, indicating steady demand for components such as sensors and semiconductors.
- The Smart Life and Energy segment, which encompasses home appliances and energy solutions, contributes 18.6% to sales and is propelled by growing consumer interest in smart home technologies and renewable energy products.
- The Display Device segment weighs in with an even larger 26.0% share, further demonstrating Sharp’s strength in producing screens for smartphones, TVs, and other digital displays.
- Following closely is the Universal Network segment, accounting for 13.2%, pertaining to diverse networking and communication solutions that assure connectivity in modern times.
- Lastly, the Smart Office segment represents 24.6% of sales, thereby illustrating Sharp’s expansion into business solutions, such as office automation, printers, and digital workplace technologies.
- These numbers show that the company has diversified sources of revenue and strong positioning in varied industries.
Sharp Cash Flows Data
- Sharp Corporation Statistics reveal that Sharp Corporation’s cash and cash equivalents arrived at ¥219,128 million at the end of the fiscal year, an increase from the previous year of ¥12,515 million.
- Cash flow from operating activities recorded a stunning increase of ¥109,749 million, amounting to ¥124,495 million as compared to just ¥14,746 million in the previous year.
- Major contributors were ¥41,628 million from changes in trade payables and ¥15,243 million from changes in accounts receivable-trade and contract assets.
- Loss before income taxes was significant at ¥137,563 million, greatly burdened by an impairment charge of a non-cash nature amounting to ¥122,332 million.
- Investing cash flow improved by ¥51,843 million from an outflow of ¥40,967 million in the prior year to an inflow of ¥10,875 million this year.
- Cash flow from financing constituted an outflow of ¥149,668 million, thereby up from ¥18,483 million in the previous year by ¥131,184 million.
- This outflow largely depended on the repayment of long-term borrowings as a result of cash generated through its operating activities and withdrawals from time deposits, resulting in a decreasing trend of interest-bearing debt.
Conclusion
Sharp Corporation Statistics are expected to grow in a mixed way, with some challenges and opportunities. The very low statistics reflect the rise of the digital economy and the expansion of renewable energy investments.
Knowledge of these numbers would help individuals, companies, and governments navigate the complexity of the year ahead, especially regarding possible directions for global economies, industries, and society in the years to come.