Social Media For Business Statistics By Business And Facts (2025)
Updated · May 07, 2026


Table of Contents
- Introduction
- Editor’s Choice
- Leading Social Media Platforms For Businesses
- Social Media For Business Statistics By Age And Gender Demographics
- Social Media Advertising Statistics For Business
- Total Time Spent By Users On Social Media Applications
- Facebook Engagement Rate Statistics
- Instagram Engagement Rate Statistics
- Most Popular Social Media Platforms Statistics By Generation
- Business Marketing Statistics By Facebook
- Benefits of Social Media For Businesses
- Reasons For Using Social Media For Businesses
- Conclusion
Introduction
Social Media for Business Statistics: In recent years, social media has become a powerful tool for global businesses. Whether it’s a small local business or a large brand, social media platforms help gain customers, build trust, and grow your online presence. Almost every Social media platform, such as Facebook, Instagram, WhatsApp, and LinkedIn, has billions of active users. Thus, businesses have an unparalleled opportunity to promote their products, share updates, and engage with their audience in real-time.
This article examines several statistical analyses that demonstrate how these social platforms are enabling businesses to succeed and remain competitive in a rapidly evolving digital market.
Editor’s Choice
- The Cropink report further states that around 96% of small businesses are now using social media for marketing purposes.
- Around 83% of companies report that the primary advantage of using social media is improved brand visibility.
- In the United States, money spent on social media ads went up by 140% between 2019 and 2024.
- Additionally, approximately 74% of people find social media ads annoying.
- According to Smart Insights, as of February 2025, approximately 63.9% of the global population is a social media user, with a daily average usage of 2 hours and 21 minutes.
- Word Stream report states that more than 70% of happy customers on social media suggest the business to their friends.
- On average, people click 12 Facebook ads monthly, and around 81% use Instagram to explore products, while 80% of Twitter users feel more positive about a business.
- Four out of five LinkedIn users influence decisions; in contrast, TikTok keeps 46% fully engaged.
Leading Social Media Platforms For Businesses
(Reference: strapiapp.com)
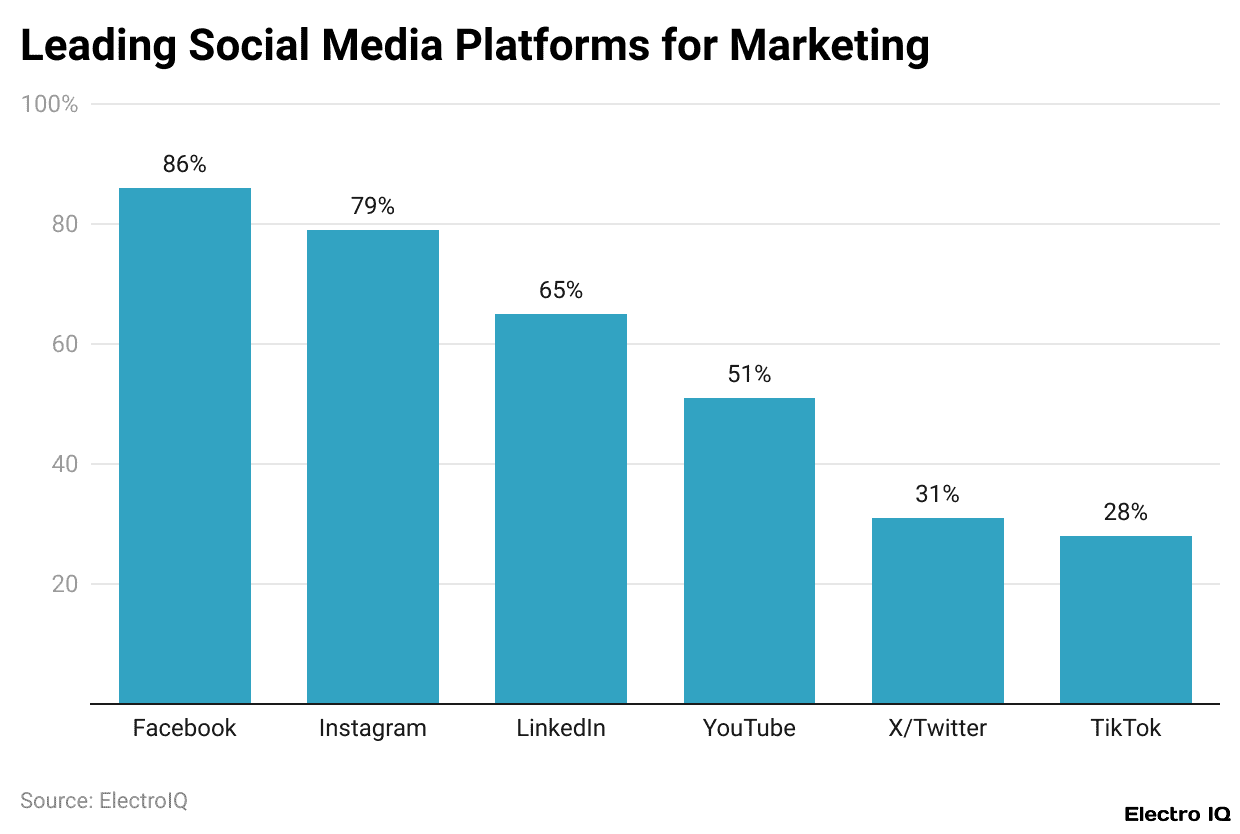
- The above graphical analysis states that around 86% of marketers use Facebook for marketing their businesses in 2024.
- Meanwhile, 79% listed Instagram, and 65% mentioned LinkedIn.
- Furthermore, other platform shares are followed by YouTube (51%), X/Twitter (31%), and TikTok (28%).
Social Media For Business Statistics By Age And Gender Demographics
|
Social Platform
|
16 to 24 years | 25 to 34 years | 35 to 44 years | 45 to 54 years | 55 to 64 years | |||||
| Male | Female | Male | Female | Male | Female | Male | Female | Male | Female | |
| 26.6% | 24.8% | 18.4% | 20.8% | 11.7% | 16% | 9.40% | 13.9% | 6.1% | 10.2% | |
| 14.1% | 12.7% | 14.7% | 14.3% | 17.3% | 15.4% | 19.50% | 17.3% | 21.9% | 21.1% | |
| 7.8% | 5.9% | 13.5% | 10.6% | 14.7% | 13.2% | 16.40% | 14.9% | 17.5% | 17.1% | |
| 8.2% | 8.2% | 11.8% | 11.7% | 16% | 15.5% | 14.40% | 13.6% | 14.4% | 12.0% | |
| Tiktok | 9.6% | 15.5% | 7.1% | 11.3% | 5.7% | 7.8% | 5.30% | 6.9% | 4.3% | 5% |
| Douyin | 6.5% | 6.6% | 8.5% | 8.1% | 8.2% | 9.8% | 6.80% | 6.4% | 6.6% | 5.4% |
| X | 4.2% | 3.1% | 4.6% | 2.1% | 4% | 1.8% | 3.80% | 1.6% | 3.3% | 1.7% |
By Ad Audience Users
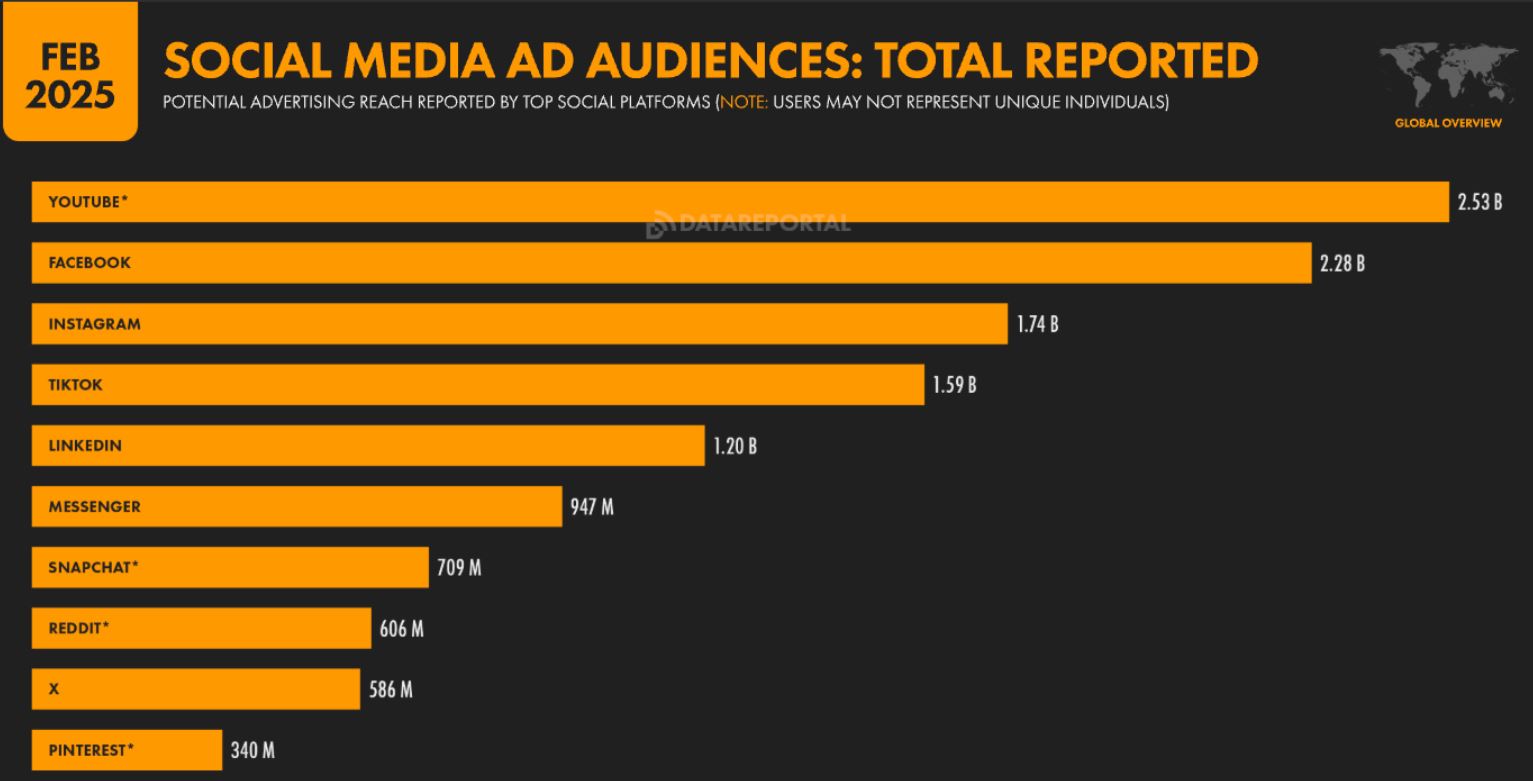
(Source: smartinsights.com)
- As of February 2025, YouTube had the largest social media ad audience, with 2.35 billion users, followed by Facebook, which had 2.28 billion users.
- For businesses, other platforms’ social media ad audiences at the same time are Instagram (1.74 billion), TikTok (1.59 billion), LinkedIn (1.20 billion), Messenger (947 million), Snapchat (709 million), Reddit (606 million), X (586 million), and Pinterest (340 million).
Social Media Advertising Statistics For Business
- According to the Cropink report of 2024, global social media advertising has already spent over USD 234.14 billion, a 140% increase in the last five years.
- By the end of 2029, social media ad spending is expected to reach around USD 345 billion.
- In contrast, around 48% of social media users have purchased after seeing an ad, followed by millennials (53%) and women (56%).
- Nearly 78% of adults over 35 believe there are far too many ads on social media platforms, and 74% of people are annoyed.
- 63% complain that they keep seeing the same ads again and again.
- For more than 56% of users, seeing diversity in advertising is important.
- More than 44% of users feel the ads they see don’t match their interests or needs.
- About 31% of top-performing ad campaigns used emotional content, while only 16% used logical or fact-based messaging.
Total Time Spent By Users On Social Media Applications
| Platforms | Average time per User |
| TikTok | 34h 56m |
| YouTube | 27h 10m |
| 17h 17m | |
| 16h 13m | |
| 16h 13m | |
| Line | 6h 57m |
| Telegram | 4h 12m |
| Messenger | 3h 33m |
| Snapchat | 3h 20m |
| Discord | 3h 06m |
| 2h 59m | |
| 1h 31m | |
| 48m | |
| Threads | 39m |
Facebook Engagement Rate Statistics
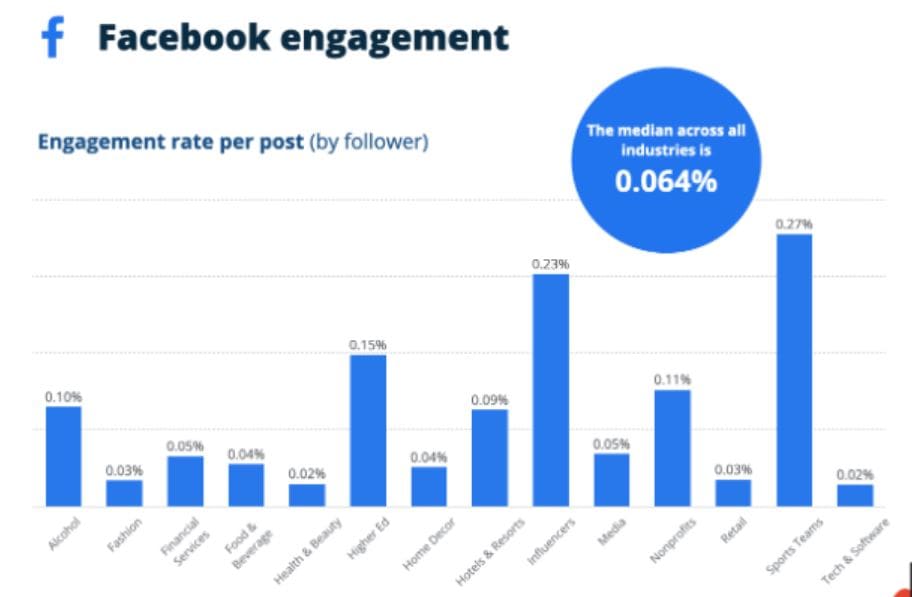
(Source: smartinsights.com)
- Facebook’s median engagement rate per post across all industries is 0.064%.
- Meanwhile, the top performers on Facebook, with the highest engagement rates per post, are sports teams (0.27%), influencers (0.23%), and higher education institutions (0.15%).
- On the other hand, the lowest engagement rates are observed in the tech and software sector (0.02%), the health and beauty sector (0.2%), and the fashion, retail, and financial services sector (0.03%).
- Others are followed by media (0.11%), alcohol (0.10%), hotels and resorts (0.09%), and nonprofits (0.05%).
Instagram Engagement Rate Statistics
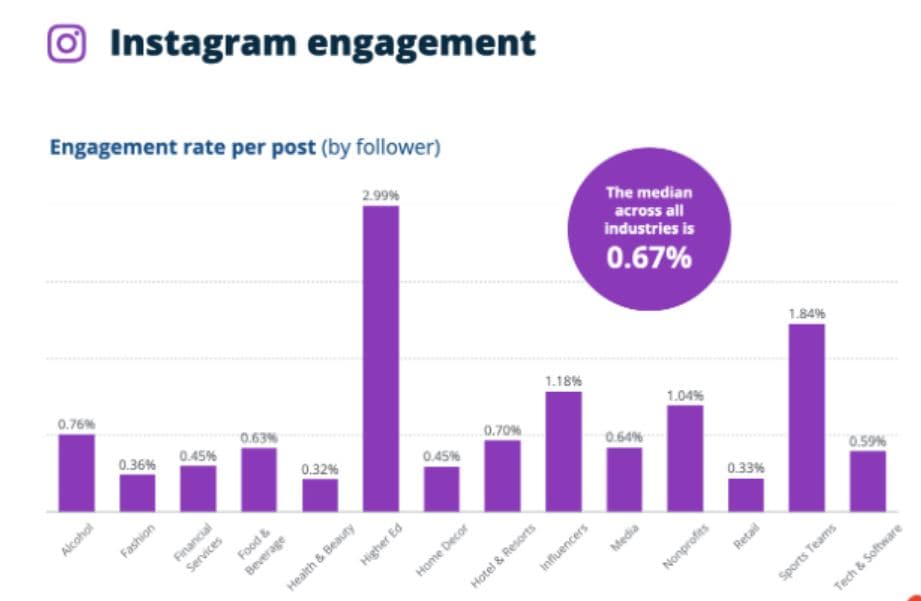
(Source: smartinsights.com)
- The above graphical analysis shows that Instagram’s median engagement rate per post across all industries is 0.067%.
- The highest engagement rates per post are in higher education (2.99%), sports teams (1.84%), influencers (1.18%), and media (1.04%).
- Additionally, the lowest engagement rates are observed in the health and beauty (0.32%), retail (0.33%), and fashion (0.36%) sectors.
- Other notable rates include alcohol (0.76%), food and beverage (0.63%), tech and software (0.59%), financial services (0.45%), and nonprofits (0.64%).
Most Popular Social Media Platforms Statistics By Generation
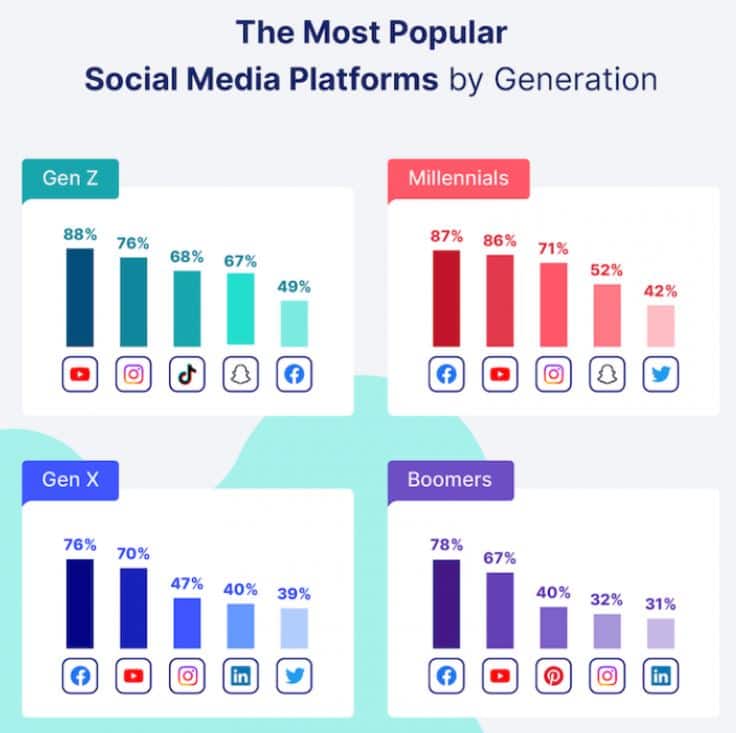
(Source: cloudfront.net)
- As of 2025, around 88% of Gen Z are using YouTube to market their businesses.
- Meanwhile, Facebook is used by 87% of millennials, 76% of GenX, and 78% of Boomers.
Other social media platforms shared by the generation are listed below:
| Platforms | Gen Z | Millennials | Gen X | Boomers |
| YouTube | 88% | 86% | 70% | 67% |
| 49% | 87% | 76% | 78% | |
| 76% | 71% | 47% | 32% | |
| TiKTok | 68% | – | – | – |
| Snapchat | 67% | 52% | – | – |
| 49% | 42% | 39% | – | |
| – | – | 40% | 32% |
Business Marketing Statistics By Facebook
- According to Slick Text’s 2025 report analysis, Facebook has more than 3 million active users.
- In the U.S., more than 80% of people have Facebook accounts.
- One out of three adults claimed that they received news from Facebook.
- Meanwhile, every month, Facebook users spend around 19.6 hours on the platform, with an average visit lasting approximately 30 minutes.
- Facebook accounts for approximately 25% of all ad spending, placing it just behind Google, which holds 28%, and ahead of Amazon, which accounts for 10%.
- Facebook Live videos get the most attention, with an engagement rate of 26%.
- Every week, two out of three users check out local business pages.
- On average, Facebook users click on around eight ads each month.
- Ads or posts on Facebook can raise conversion rates by almost 2.85 times.
- Facebook Live videos get the most attention, with an engagement rate of 26%.
- In comparison, regular Facebook posts have engagement just below 4%, and organic reach is slightly above 5%.
- Facebook accounts for approximately 25% of all ad spending, placing it just behind Google, which holds 28%, and ahead of Amazon, which accounts for 10%.
- More than 98% of Facebook users open the app on their phones, making it a mobile-first platform.
- It’s also the third most-downloaded app in the world.
By YouTube
- According to Status Brew reports, YouTube has the second-largest total active user base on social media, with over 2.5 billion users, followed by Indian users at 476 million as of July 2024.
- YouTube Premium and YouTube Music together have over 100 million paid subscribers.
- On average, people spend 19 minutes daily watching videos.
- Globally, people watch over 1 billion hours of YouTube content daily on their TVs.
- Also, more than 500 hours of video content are uploaded every minute.
- Nearly 46% of people who use the internet visit YouTube at least once a month, while YouTube reaches almost 31% of the world’s population.
- In terms of gender, 54.3% of its users are men, while 45.7% are women. On average, users spend about 49 minutes per visit.
By WhatsApp
- Status Brew Insights further states that the global monthly users of WhatsApp will account for 2.30 billion.
- As of today, WhatsApp is considered the second most preferred platform for businesses, used by 24.7% of people (approximately 1 in 4).
- Per month, the total number of WhatsApp Messenger downloads is more than 45 million, while WhatsApp Business secured 23.67 million downloads.
- In Q2 2024, the United States had the highest number of WhatsApp downloads on iPhones, with 5.18 million installs.
- Besides, approximately 1 in 4 people (24.7%) worldwide now use WhatsApp.
- Every day, WhatsApp sends nearly 1 billion messages to its users.
- On average, a WhatsApp user opens the app around 929.9 times each month.
By LinkedIn
- Globally, LinkedIn has fewer users, with about 875 million people.
- In the U.S., approximately one in three people use LinkedIn and earn over USD 75,000 each year.
- The largest user group on this platform is between 25 and 34 years old, accounting for 60% of users.
- Around 92% of Fortune 500 companies are actively using LinkedIn.
- For B2B marketers, 97% use LinkedIn and 82% say it’s their most effective tool.
- Complete LinkedIn profiles get about 30% more views, and adding a link in posts can increase engagement by 45%.
- LinkedIn posts perform best when they include eight images, and regular posting at least once a week helps maintain high visibility.
- Marketers often post 4 to 6 times a week.
By Instagram
- The Slick Text report further states that Instagram currently has approximately 2 billion active users and is ranked as the 4th most used platform for business.
- Daily, the average U.S. person spends around 30 minutes on Instagram.
- Instagram has a large advertising reach, with nearly 1 billion users, representing 1/3rd of internet users.
- About 17 stories per month are shared on this platform by most brands.
- Moreover, Meta found that Instagram is the top-rated platform for users interacting with brands.
- Business accounts on Instagram grow their followers by only 1% every month.
- On average, the engagement rate of brands that post on Instagram accounts for 0.54%.
- Approximately one in three users is likely to purchase through the platform, and 15% of American buyers initiate their shopping journey on Instagram.
- Nearly 98% of marketers prefer Instagram for influencer campaigns, and almost 50% more than those who use Facebook.
- Reels play a crucial role in keeping users engaged, with 91% of people watching videos every week.
By TikTok
- In 2024, people spend around 95 minutes a day on TikTok, and about 1 in 3 users log in daily to the application.
- Around 50% of TikTok users are aged 18 to 34 years during the same period.
- Meanwhile, in 2022, TikTok was the most downloaded app globally, with the highest engagement rate of 6%.
- But now, every year, TikTok’s engagement rate is dropping by 28%.
- TikTok is currently used by only 18% of marketers, while 55% of users have purchased after seeing ads on the platform.
- TikTok ads have a huge reach with 19% of all internet users globally.
- Ads that share their message in the first 3 seconds perform best.
- As of 2025, influencers perform even better with TikTok, with 15% engagement, and in the U.S., this rate can increase to 18%.
By Twitter
- In 2025, Twitter had nearly 400 million users globally.
- 90% of the tweets in the U.S. were created by only 10% of users.
- Most users are under 30 and care about social issues, with 77% wanting brands to take a stance, according to reports from SlickText.com.
- Approximately 50% of Twitter users go there for news and entertainment, while 33% follow brands and businesses.
- Interestingly, Twitter ads are watched 26% higher than others.
- Around 52% of people check Twitter daily, 84% weekly, and 96% at least once a month.
- Every day, U.S. adults spend about 6 minutes on Twitter on average.
- Male Twitter users account for a higher share of 70%.
- B2B marketers use this platform by 80%.
- The platform claims a 40% better ROI compared to others.
By Snapchat
- According to statusbrew.com, reports indicate that as of now, Snapchat has more than 850 million total monthly active users, while 432 million users make daily logins.
- Meanwhile, in Q3 of 2024, daily active users of the platform were 4.43 million, up by 9% YoY.
- In the same period, more than 1 billion snaps were shared publicly every month.
- Additionally, the total number of subscribers has surpassed 12 million.
- Currently, 89% of Snapchat users are also using Instagram.
- As of 2025, total Snapchat time spent has increased by 25% from last year.
- During the Paris 2024 Games, more than 225 million Snapchatters engaged with Olympic-related AR experiences.
Benefits of Social Media For Businesses
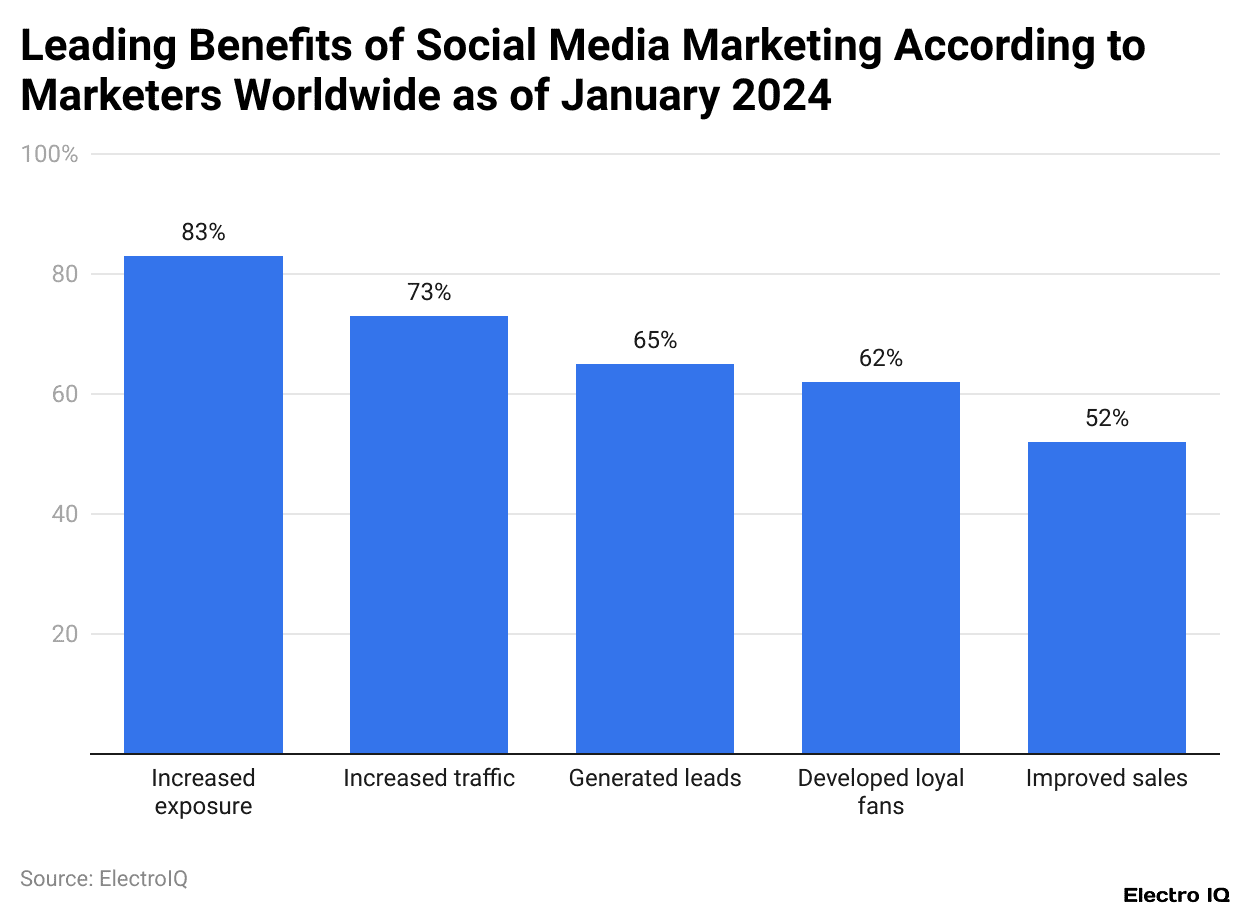
(Reference: statista.com)
- According to the 2024 Statista report, around 83% of respondents stated that social media marketing helped them gain more exposure.
- Approximately 73% mentioned that it brought more traffic, and 65% reported that it helped them generate new leads.
- Others are followed by the development of loyal fans (62%) and improved sales (52%).
Reasons For Using Social Media For Businesses
| Profile Optimization | Accurate, complete, active, links to website, and has CTA |
| Posting | Useful, entertaining, relevant posts, photos, videos, lives, and stories |
| Engaging | Like, share, comment, and follow customers, followers, and influencers. |
| Advertising | Paid methods of reaching targeted audiences. |
| Measuring | Use platform and website analytics to see what’s working. |
Conclusion
After completing the article on social media for business statistics, it can be concluded that Social media has become an essential tool for businesses of all sizes. Platforms like Facebook, Instagram, WhatsApp, LinkedIn, and Twitter provide direct and powerful ways to connect with customers, while building brand awareness, driving sales, and maintaining visibility and relevance.
The data collected from the various insights above will guide you effectively in understanding the market, usage, and benefits of social media in businesses.
FAQ.
Businesses should first identify who they want to connect with, including their age, gender, and interests, and then choose the social media platforms that those individuals use the most.
The main rules of social media for business are authenticity and transparency.
Globally, more than 90% of businesses utilise social media platforms for connecting with customers, promoting products, and establishing brands.

Tajammul Pangarkar is the co-founder of a PR firm and the Chief Technology Officer at Prudour Research Firm. With a Bachelor of Engineering in Information Technology from Shivaji University, Tajammul brings over ten years of expertise in digital marketing to his roles. He excels at gathering and analyzing data, producing detailed statistics on various trending topics that help shape industry perspectives. Tajammul's deep-seated experience in mobile technology and industry research often shines through in his insightful analyses. He is keen on decoding tech trends, examining mobile applications, and enhancing general tech awareness. His writings frequently appear in numerous industry-specific magazines and forums, where he shares his knowledge and insights. When he's not immersed in technology, Tajammul enjoys playing table tennis. This hobby provides him with a refreshing break and allows him to engage in something he loves outside of his professional life. Whether he's analyzing data or serving a fast ball, Tajammul demonstrates dedication and passion in every endeavor.