Omnichannel Statistics By Revenue, Region And Facts (2025)
Updated · May 05, 2026

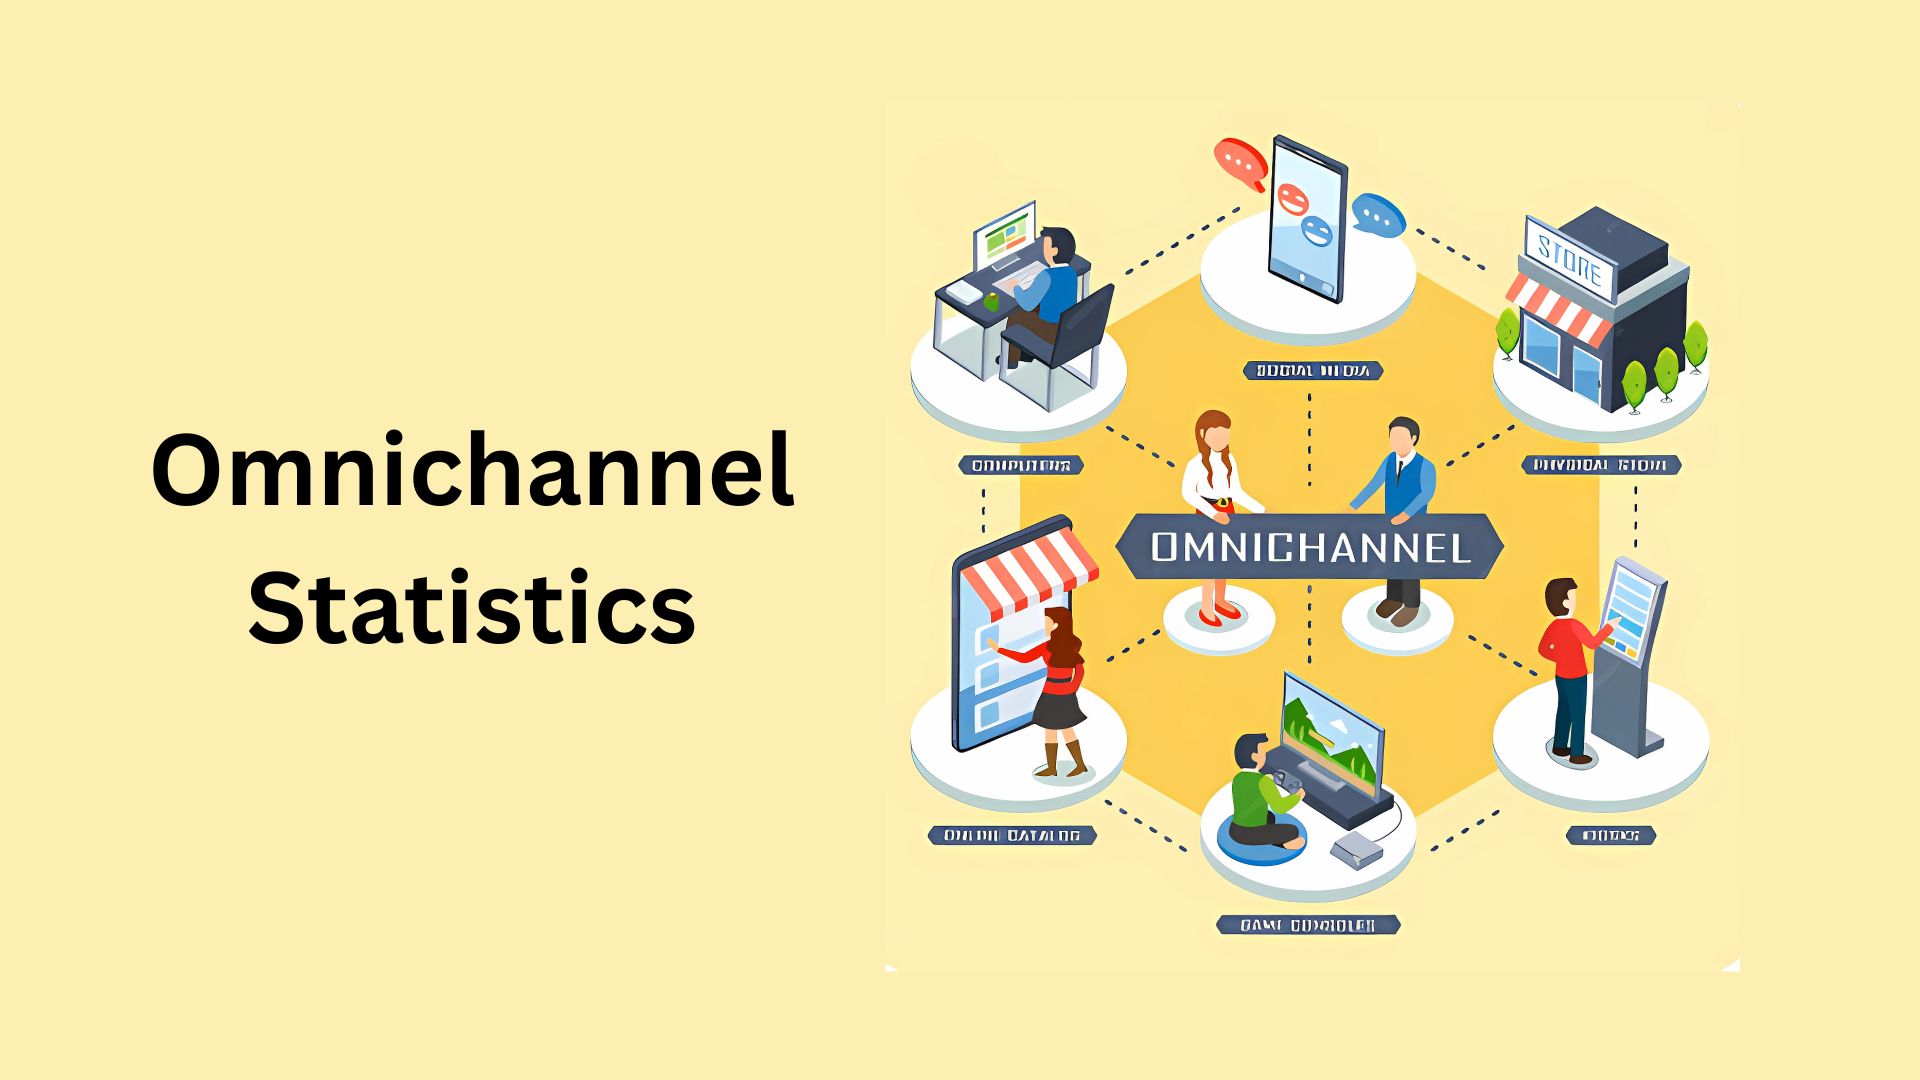
Table of Contents
- Introduction
- Editor’s Choice
- General Omnichannel Statistics
- Omnichannel Customer Behavior Statistics
- Boosting Revenue with Omnichannel Marketing Statistics
- Omnichannel Customer Service Statistics
- Omnichannel Retail Platform Statistics
- Channels Making Purchases Statistics from Retailers’ Stores
- From Retailer’s
- Omnichannel Social Commerce Statistics
- Mobile Omnichannel Statistics
- E-commerce Omnichannel Statistics
- Omnichannel Statistics by Region
- Benefits of Implementing an Omnichannel Strategy
- Future of Omnichannel Statistics
- Conclusion
Introduction
Omnichannel Statistics: As the world’s economy continues to grow digitally, businesses are being encouraged to adopt seamless and integrated shopping experiences across multiple platforms, in line with rapidly evolving consumer expectations, to enhance customer satisfaction and loyalty.
“Omnis” is a Latin word that means “every/all”, which suggests the integration of all physical channels (offline) and digital channels (online) to offer a unified customer experience. In recent years, the majority of businesses have adopted omnichannel strategies to achieve better results, including increased repeat customers, higher sales, and longer-lasting customer relationships.
This article presents several statistical analyses from different perspectives that will help you understand the topic more effectively.
Editor’s Choice
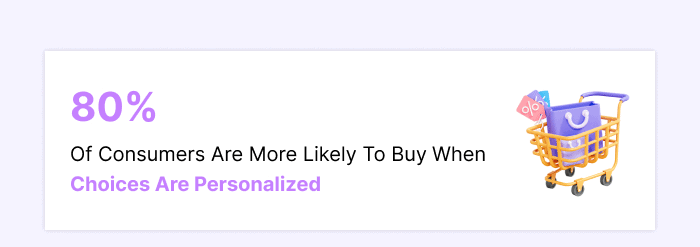
- The reports of Wiser Notify state that 80% of global people are more likely to buy online products through omnichannel platforms that offer personal experiences.
- On these platforms, the purchasing rate of customers has increased by 250%, and the order value has increased by 13%, as compared to single channels.
- Every year, businesses with omnichannel strategies generate 91% more customers than other retail businesses.
- The Aberdeen Group found that businesses employing strong omnichannel strategies retain 89% of customers, compared to 33% of those with weak engagement.
- Businesses employing omnichannel strategies experience a 9.5% annual revenue growth, whereas those without it grow by only about 3.4%.
- In comparison, only 7% shop only online, while 20% prefer shopping only at physical stores.
- Firework report analysis further states that Shoppers who use more than one channel are 1.7 times more likely to buy from the same brand again.
- According to Magenest reports, the omnichannel retail market in North America was valued at USD 2.1 trillion in 2024, accounting for a 35% share of the market.
- According to Firework, the annual revenue of brands that have implemented omnichannel strategies has increased by 9.5%, compared to 3.4% for those with weak strategies.
General Omnichannel Statistics
- 87% of shop owners believe it’s very important to connect with customers through various channels.
- Moreover, before buying any online products, around 74% of people use social media.
- As of 2025,
- Approximately 54% of people prefer it when brands respond quickly, and another 54% prefer using messaging apps to reach businesses.
- Almost 70% of people trust and buy products, where CEO’s mostly remain active on social media.
- The sales of omnichannel marketing have increased by 287% in 2025.
- The Clerk.io report states that multichannel shopping (like online, in-store, and mobile shopping) is used by 73% of shoppers.
- In online shopping, omnichannel customers spend 10%, while 4% is spent on in-store shopping.
- According to Google reports, omnichannel shoppers captured a 30% higher lifetime value.
- Around 85% of people who shop online begin their buying process on one device but complete it on another.
Omnichannel Customer Behavior Statistics
- According to reports from wisernotify.com, the purchasing decisions of 74% of shoppers are influenced by social networks.
 (Source: wisernotify.com)
- Meanwhile, 80% of people were willing to buy something when they got personalised product options in 2024.
- Omnichannel Statistics also show that on social media, 31% of people search for new products, and 78% say brand posts have a strong influence on their buying decisions.
- HubSpot further details that social media referrals are used by 71% or more of online purchasers for making online purchases.
- After experiencing shopping through multiple connected channels, nearly 23% of shoppers were willing to make a repeat purchase.
- More than 60% of buyers check online before visiting a website or store to make a purchase.
Boosting Revenue with Omnichannel Marketing Statistics
- According to Firework, the annual revenue of brands that have implemented omnichannel strategies has increased by 9.5%, compared to 3.4% for those with weak strategies.
- Marketing campaigns that utilise more than two or three channels have achieved a 287% higher purchase rate.
- The average order value has also increased by 13% after implementing Omnichannel strategies.
- Approximately 50% of shoppers prefer using the Buy Online, Pick Up In-Store (BOPIS) option, and about 67% of them also tend to purchase more items when picking up their orders.
- Around 70% of marketers say that using omnichannel marketing helps them achieve significantly better returns on their investment.
- B2B companies that utilise omnichannel strategies generate approximately 11% more revenue each year compared to those that do not.
Omnichannel Customer Service Statistics
- 88% of customers claimed that both the products and the experience provided by the company are important to them.
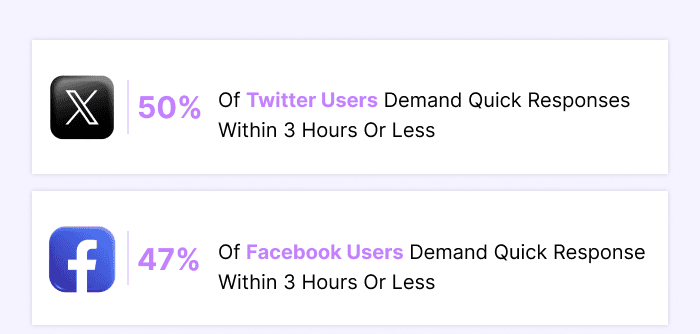
- Wisernotify also states that brands that responded quickly are mostly favoured by 54% of customers in 2025.
- When it comes to a question or complaint, most people expect a reply within three hours.
 (Source: wisernotify.com)
- Around 50% of Twitter and 47% of Facebook users always want a reply within 3 hours or less.
- 54% of people like using social media when they need help or services from a company.
- Approximately 65% of customers worldwide want businesses to adapt to their changing needs and preferences.
- While 71% of customers want a consistent experience across all online platforms, only 29% receive it.
- Waiting too long to reach a representative can frustrate customers, and 60% of them leave a business.
Omnichannel Retail Platform Statistics
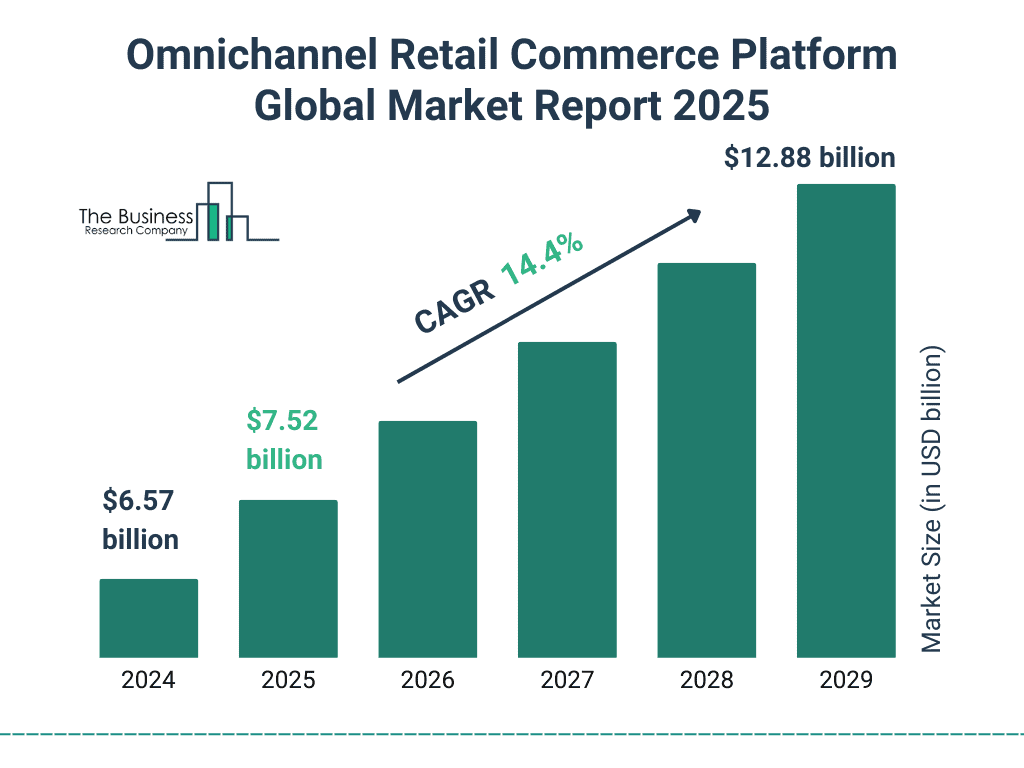
- In 2024, the omnichannel retail commerce platform market size was USD 6.57 billion.
- Meanwhile, it is estimated to increase to USD 7.52 billion by the end of 2025 and USD 12.88 billion by the end of 2029.
- The market is expected to grow at a CAGR of 14.4% from 2025 to 2029.
Channels Making Purchases Statistics from Retailers’ Stores
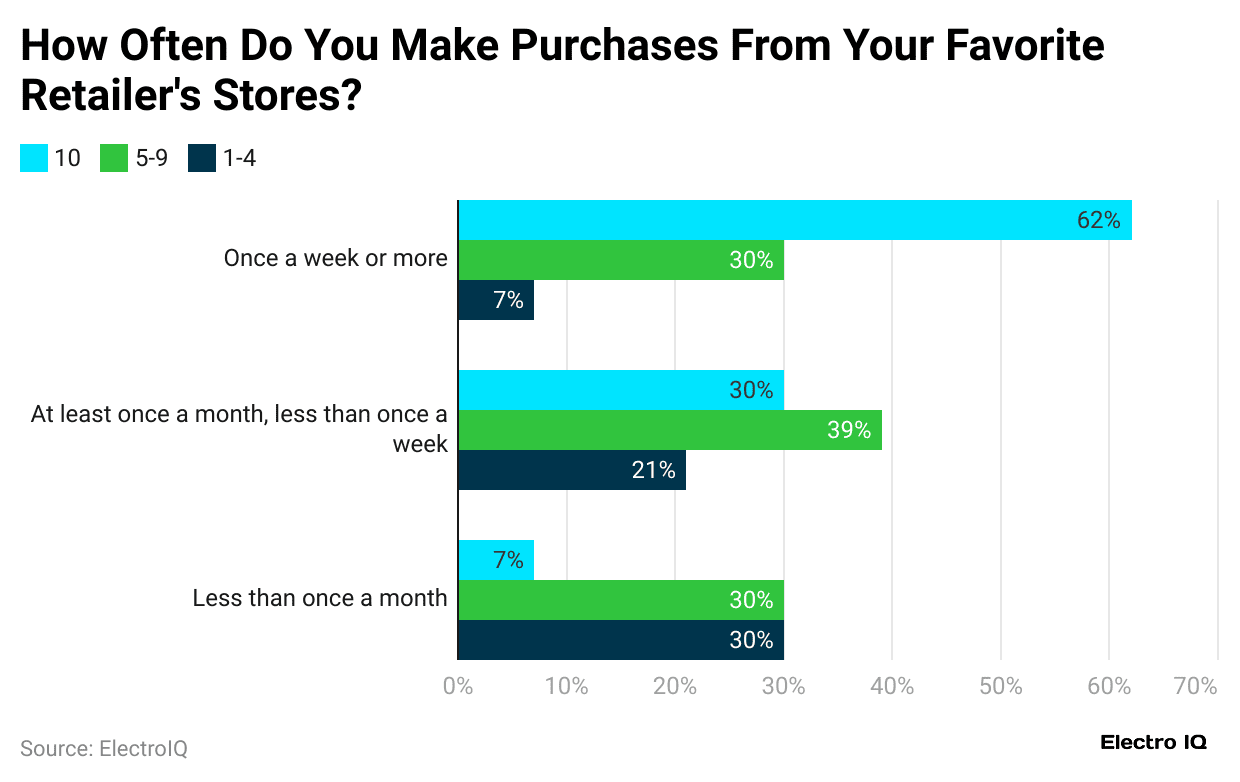 (Reference: improvado.io)
- The above graph indicates that individuals using more than 10 channels are the most frequent shoppers, with 62% of them purchasing at least once a week or more.
- Shoppers using 5 to 9 channels also show strong engagement, with 41% shopping weekly and 39% shopping at least once a month.
- Those using only 1 to 4 channels shop less frequently, with only 40% buying weekly, and 30% shopping less than once a month.
From Retailer’s
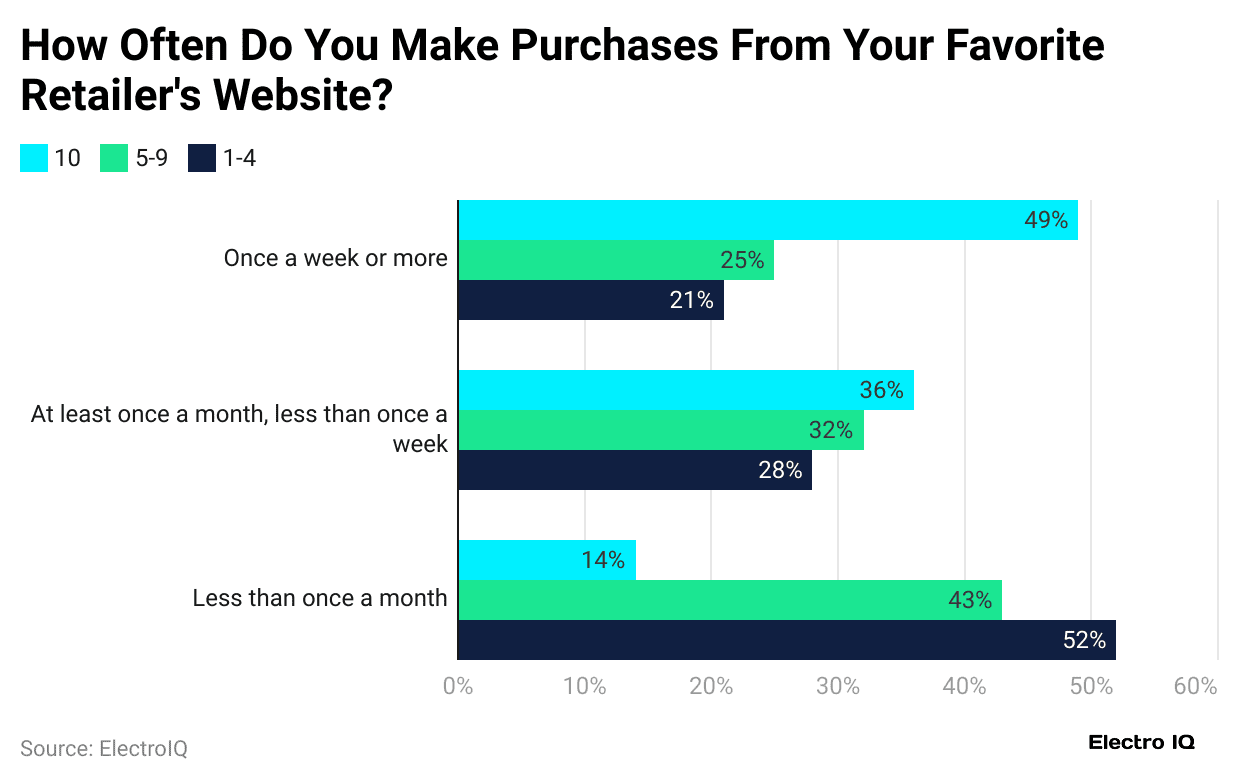 (Reference: improvado.io)
- Around 49% of people using 10 or more channels shop on the website once a week or more, as they are the most regular online buyers.
- In contrast, people using 5 to 9 channels are 25% weekly shoppers, while 43% shop less than once a month.
- Shoppers using only 1 to 4 channels are the least active, with just 21% weekly purchases, and 52% shop less than once a month.
Omnichannel Social Commerce Statistics
- The social commerce market is projected to reach approximately USD 2.1 trillion by 2025 and USD 2.9 trillion by the end of 2026.
- 59% of social commerce users prefer to buy from a small business.
- While browsing through social commerce platforms, around 44% of shoppers are open to buying from unknown brands.
- The UK leads retail commerce, making up 35.9% of all total retail sales revenue.
- According to the reports of Contact Pigeon, over 50% of sellers say audience targeting is the biggest benefit of social selling.
- 60% of Gen Z and 56% of millennials use social media to shop during holidays.
Mobile Omnichannel Statistics
- As of 2024, when shopping in stores, approximately 84% of people use their mobile phones to assist them in making decisions.
- Checking phones in-store has become a regular part of the shopping experience, claimed by 71% of smartphone users.
- One out of every three shoppers prefers looking up information on their phone instead of asking store staff for assistance.
- Around 51% say using their phones saves time, and 44% believe it helps them spend less money.
E-commerce Omnichannel Statistics
- According to reports from Fit Small Business, the United States’ market valuation reached approximately USD 1.119 trillion in 2023, representing a 7.6% growth rate from 2022 to 2023.
- By the end of 2033, around 64% of spending will be conducted online.
- Insider Intelligence predicts that the e-commerce rate may drop to 14.7% by 2026, as more people return to in-store shopping.
- As of 2024, only 23% of people had returned clothing, making it the most returned item.
- Approximately 34% of shoppers make online purchases at least once a week.
- Instead of browsing, 45% of online shoppers go straight to a search page to find products.
- Globally, 66% of people now want their orders delivered within two days.
Omnichannel Statistics by Region
- According to Magenest reports, the omnichannel retail market in North America was valued at USD 2.1 trillion in 2024, accounting for a 35% share of the market.
Other regions’ market size is as follows:
| Country | Market Size (USD) |
| Europe |
1.7 trillion |
|
Asia-Pacific |
1.5 trillion |
| Latin America |
400 billion |
|
Middle East & Africa |
200 billion |
 (Source: magenest.com)
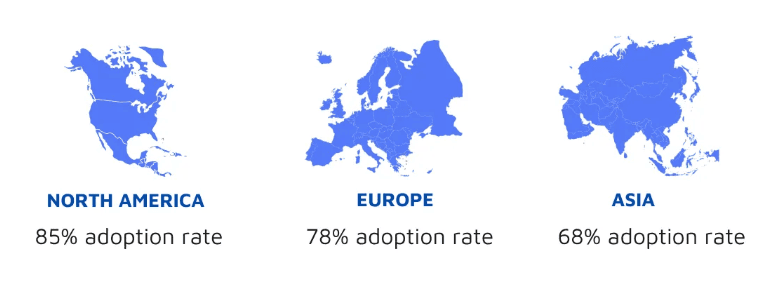
- As of 2024, approximately 85% of North American retailers employ omnichannel strategies, driving global adoption efforts.
- In Europe, 78% of retailers use omnichannel strategies, while in Asia, about 68% have adopted similar approaches.
Benefits of Implementing an Omnichannel Strategy
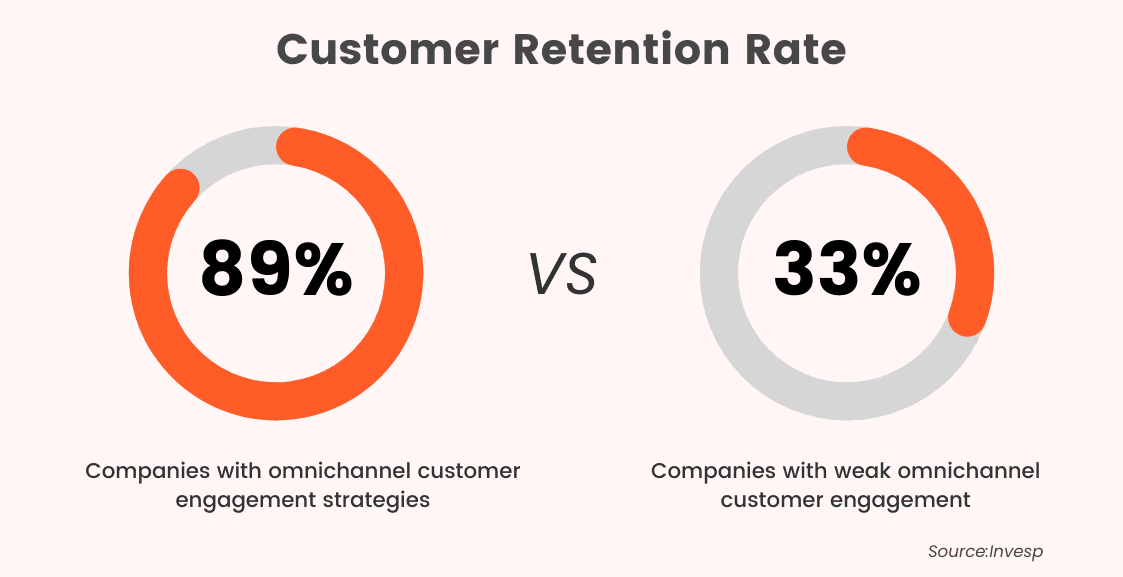 (Source: website-files.com)
- The above image elaborates that omnichannel customer engagement strategies are implemented by 89% of companies.
- Meanwhile, 33% of companies have omnichannel customer engagement.
- From customers to physical stores, Omnichannel strategies help bring in 80% more visits.
- The customer retention rates from year to year have increased by 91% in companies with strong omnichannel customer engagement.
- An omnichannel strategy is considered critical for business success by 90% of retail leaders.
Future of Omnichannel Statistics
- As of 2024, mobile optimisation is essential for omnichannel success, as 40% of all e-commerce sales are generated from mobile devices, according to Firework reports.
- Omnichannel strategies are crucial for future growth, as mentioned by 87% of retailers; only 8% feel they’ve done it perfectly so far.
- Around 60% of retailers plan to incorporate AI into their omnichannel strategies to provide customers with real-time, personalised service.
- Nine out of ten retailers plan to invest in omnichannel tools to enhance the customer shopping experience.
- By 2025, 80% of retailers plan to offer “Buy Online, Pick Up In Store” (BOPIS) to meet the rising demand for flexible shopping options.
- Additionally, 50% of all B2C companies are expected to incorporate virtual reality (VR) into their omnichannel strategies.
Conclusion
After completing the article on Omnichannel Statistics, it can be concluded that in today’s retail and digital landscape, omnichannel strategies have become essential. Consumers today use multiple platforms, including websites, apps, physical stores, and social media, to achieve a seamless and connected shopping experience. Businesses that are linked with omnichannel solutions help in gaining higher sales, stronger customer loyalty, and better long-term growth.
The above analyses will help you gain a better understanding of the article.
Sources
FAQ.
Customer experience, Context, Content, and Collaboration are the 4Cs of omnichannel.
Data, integration, messaging, and optimisation are the four pillars of omnichannel.
The top three disadvantages are high coordination requirements, the need for technology integration, and the cost of managing multiple channels efficiently.
An omnichannel strategy provides seamless and consistent customer experiences across all channels, including online, in-store, mobile, and social media.
Build a strong omnichannel strategy by unifying data, synchronising all channels, aligning communication, and continually improving through performance tracking.

Maitrayee Dey has a background in Electrical Engineering and has worked in various technical roles before transitioning to writing. Specializing in technology and Artificial Intelligence, she has served as an Academic Research Analyst and Freelance Writer, particularly focusing on education and healthcare in Australia. Maitrayee's lifelong passions for writing and painting led her to pursue a full-time writing career. She is also the creator of a cooking YouTube channel, where she shares her culinary adventures. At Smartphone Thoughts, Maitrayee brings her expertise in technology to provide in-depth smartphone reviews and app-related statistics, making complex topics easy to understand for all readers.


