Yelp Statistics By Revenue, Country, User, Demographics And Facts (2025)
Updated · Jun 02, 2026


Table of Contents
- Introduction
- Editor’s Choice
- Yelp Financial Report
- Yelp’s Revenue Statistics by Country
- Yelp Reviewed Businesses Statistics by Category
- Yelp App Usage Statistics
- Distribution Statistics by Review Star Ratings
- By Average Business Ratings
- Yelp User Statistics
- Yelp’s Demographic Statistics
- Yelp’s Impact on Local Businesses
- ChatGPT’s Website Traffic Statistics
- By Country
- By User Demographics
- By Device
- By Marketing Channels Distribution
- By Social Media
- New Releases of Yelp Statistics
- Conclusion
Introduction
Yelp Statistics: Yelp Inc. is an American company that runs the Yelp.com website and mobile app, where people can post and read reviews about local businesses. The company also offers Yelp Guest Manager, which helps in booking tables at restaurants. Yelp’s headquarters are located at 350 Mission Street, San Francisco, California, U.S., and were founded in October 2004 by Russel Simmons and Jeremy Stoppelman. Yelp has grown into one of the most trusted platforms for user-written business reviews and ratings.
This article explores the latest statistical analysis of Yelp, including usage trends, financial performance, star ratings, market share, and more, which will guide you in understanding how the platform continues to shape consumer choices and business visibility in recent years.
Editor’s Choice
- According to the reports of Yelp Newsroom, in Q1 of 2025, the net revenue accounted for by Yelp was around USD 359 million.
- In the same duration, Yelp has around 517K paying advertising locations.
- As of 2024, approximately 29 million unique devices used the Yelp app each month on average.
- Yelp recorded a total of 308 million cumulative reviews by December 31, 2024.
- Based on category, Yelp’s advertising revenue shares are categorized as 68% (services) and 32% (restaurants, retail & others).
- Based on the Yelp review distribution, it is followed by recommended (75%), not recommended (16%), and removed (9%).
- Wikipedia suggested that in 2024, the total number of Yelp’s employees was around 5,116.
- Yelp claimed 50% of its users live in households that earn over USD 100,000 a year.
- Yelp Statistics also shows that people aged 55 years or older secured the highest U.S. users, holding a share of 41%.
- Wall Street Zen further depicts that as of August 9, 2024, Yelp had more than 287 million reviews.
- March 2025, Yelp’s revenue in the United States was USD 356.1 million, holding a share of 99.34%
- Traffic insights from TipRanks show that as of February 2025, Yelp got around 133.7 million visits, and about 52% of those came from desktop users, roughly 69.4 million.
Yelp Financial Report
 (Source: q4cdn.com)
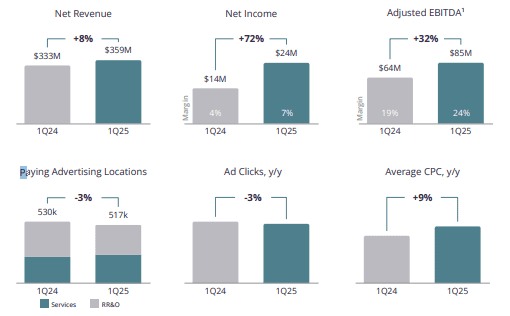
- In the first quarter of 2025, the net revenue accounted for by Yelp was USD 359 million, up 8% from the Q1 of 2024, resulting in USD 333 million.
Yelp’s Quarterly revenue segmentation is stated in the table below:
| Types (USD million) | Q1, 2025 | Q4, 2024 | Q3, 2024 | Q2, 2024 | Q1, 2024 |
| Service | 232 | 225 | 228 | 223 |
230 |
|
RR&O |
110 | 121 | 116 | 118 |
114 |
- In the same period, the net income was USD 24 million or USD 0.36 per diluted share, compared to net income of USD 14 million, or USD 0.20 per diluted share, in Q1 2024.
- Adjusted EBITDA was USD 85 million, an increase of 32%, compared to the first quarter of 2024, resulting in USD 64 million.
- Cash provided by operating activities was USD 98 million in Q1 of 2025.
- Yelp repurchased approximately 1.7 million shares at an aggregate cost of USD 62.5 million.
Yelp’s share in Ad clicks and Average CPC are mentioned in the table below:
| 1Q24 | 2Q24 | 3Q24 | 4Q24 | 1Q25 | |
| Ad Clicks | 8% | 9% | 2% | 5% |
-3% |
|
Average CPC |
-1% | -1% | 3% | 0% |
9% |
Yelp’s Revenue Statistics by Country
- March 2025, Yelp’s revenue in the United States was USD 356.1 million, holding a share of 99.34%
- and other non-U.S. countries secure USD 2.37 million revenue (0.66% share)
Other quarterly revenue analyses are stated below:
| Country | Dec 2024 | Sep 2024 | Mar 2024 |
| United States | USD 713.7 million | USD 357 million |
USD 330.1 million |
|
Others |
USD 5.23 million | USD 2.69 million |
USD 2.62 million |
Yelp Reviewed Businesses Statistics by Category
 (Reference: yelp-press.com)
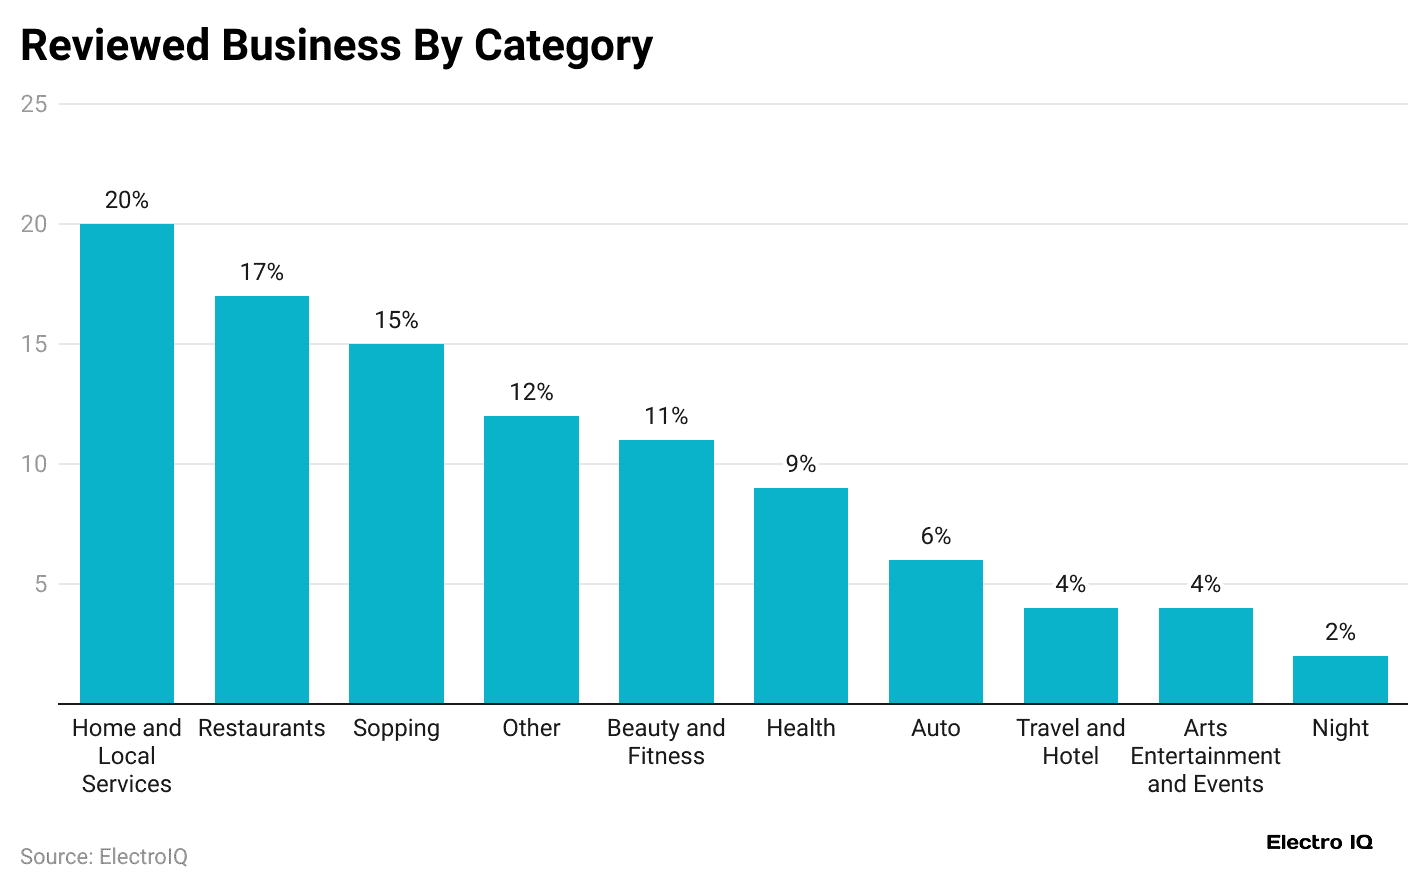
- The above graph states that most Yelp reviews are about home services (20%), restaurants (17%), and shopping (15%).
- Furthermore, other reviews by business category shares are followed by Beauty & Fitness (11%), Health (9%), Auto (6%), Travel & Hotel (4%), Arts, Entertainment & Events (4%), Nightlife (2%), and others (12%).
Yelp App Usage Statistics
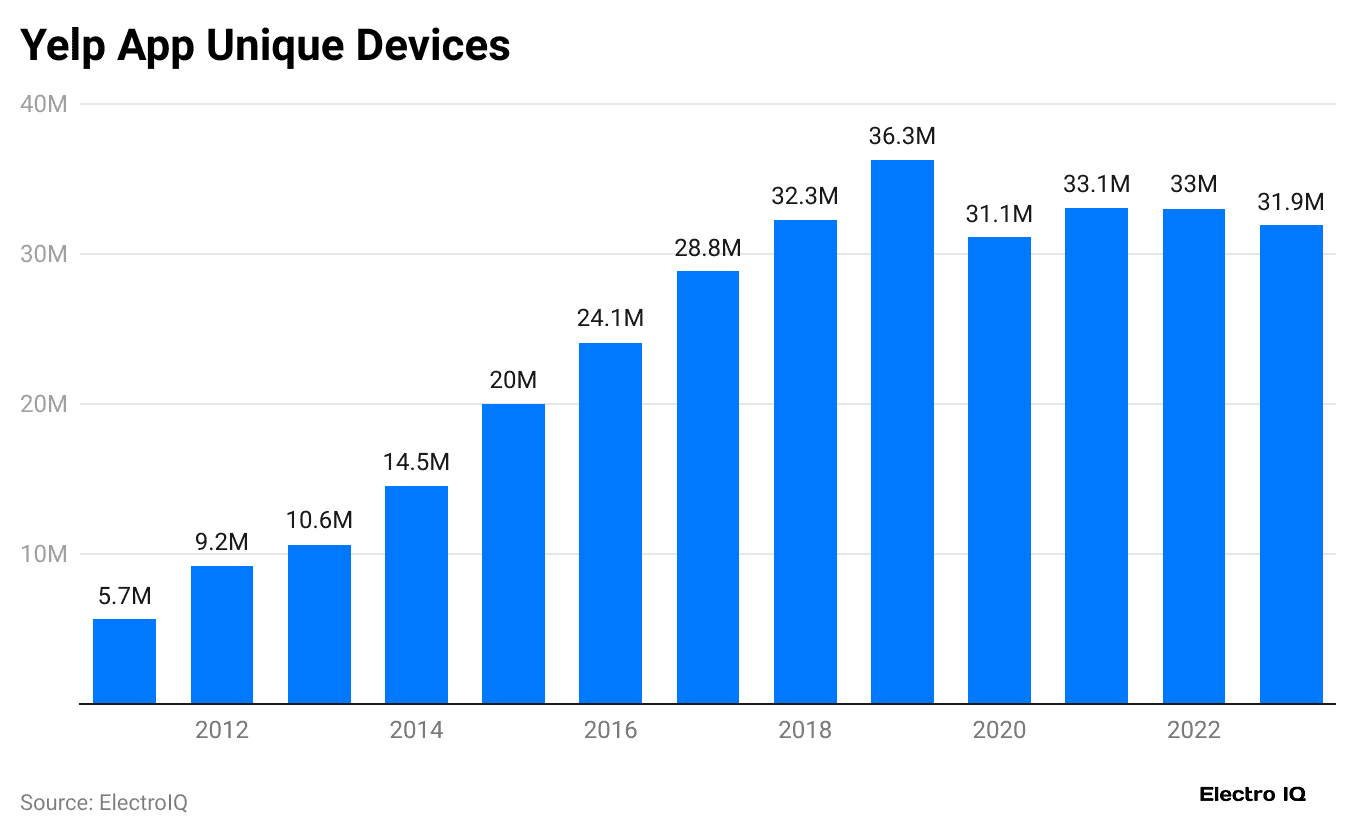
- The above graph shows that in 2023, about 31.9 million devices used the Yelp app each month, which is a drop from 33 million in 2022.
- Besides, Yelp Inc. shows that in 2024, Yelp averaged 28.6 million monthly unique mobile devices.
- Reddit.com also depicts that in Q1 2025 data, Yelp confirmed 29 million unique mobile devices use its app each month.
Distribution Statistics by Review Star Ratings
- Over half of Yelp reviews (54%) are 5-star ratings, showing mostly positive experiences.
The other ratings are detailed below:
| Star Rating | Review Share |
| ⭐⭐⭐⭐ |
18% |
|
⭐⭐⭐ |
15% |
| ⭐⭐ |
7% |
|
⭐ |
6% |
By Average Business Ratings
- As of December 31, 2024, most U.S. businesses on Yelp have strong average ratings, with 38% holding 4 stars.
The table below shows the other star ratings:
| Star Rating | Business Share |
| ⭐⭐⭐⭐⭐ |
16% |
|
⭐⭐⭐ |
26% |
| ⭐⭐ |
16% |
|
⭐ |
5% |
Yelp User Statistics
- According to Digital Web Solutions, Yelp gets at least 178 million unique visitors every month through its website and mobile app.
- The platform also has around 32 million regular mobile app users.
- Yelp now has about 287 million total reviews.
- Nearly 45% of people check Yelp reviews before visiting a business.
- Interestingly, 54% of Yelp users earn over USD 100,000 a year.
- Customers on Yelp also show more interest in women-owned beauty businesses (up 9.1%) and home service providers (up 14.3%), making these two categories especially popular.
Yelp’s Demographic Statistics
 (Reference: yelp-press.com)
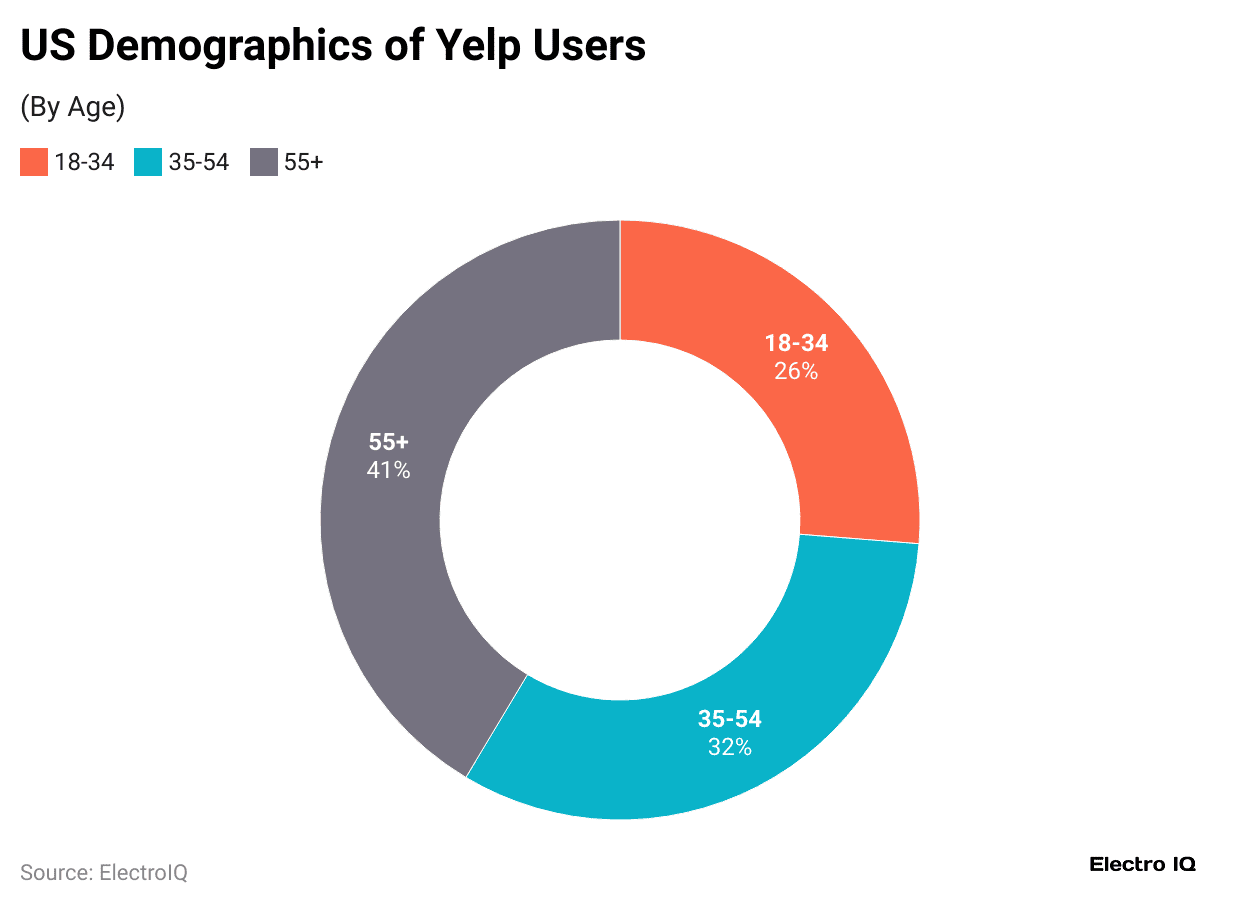
- The above pie chart elaborates that as of March 2025, people aged 55 years or older secured the highest U.S. Yelp users, holding a share of 41%.
- In contrast, other Yelp users share by age group are followed by 32% (35 to 54 years) and 26% (18 to 34 years).
- In the same duration, 60% of the U.S. Yelp users have completed their college degrees.
- Moreover, 26% of users don’t have any college degree, and 14% share came from graduate school.
- Based on income, American Yelp users earned more than USD 10,000, which made up a share of 54%.
- Besides, 24% of users earned between USD 60K and USD 99K, and 23% earned (USD 0 to USD 59K).
Yelp’s Impact on Local Businesses
 (Source: digitalwebsolutions.com)
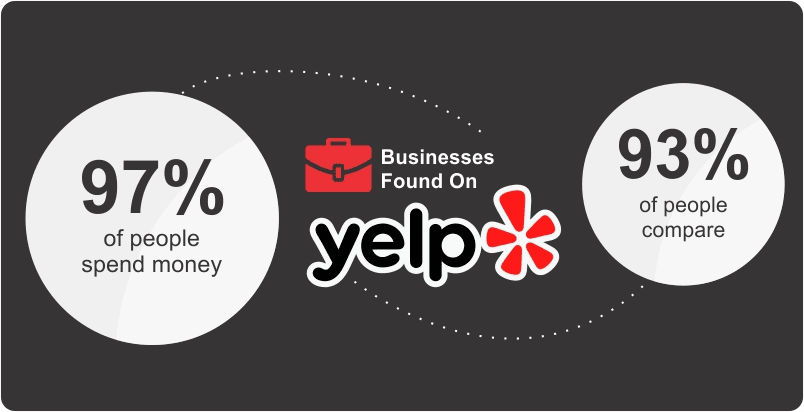
- As of 2025, about 97% of users buy from businesses they find on Yelp, and 93% compare options there before purchasing.
- Businesses with negative reviews on their Yelp listing are avoided by 92% of people.
- Besides, 94% of customers said that reading positive Yelp reviews made them loyal to that business and more likely to prefer it first.
- Meanwhile, businesses with 1 to 5 reviews that include at least 10 photos can get up to 200% more views than those with the same number of reviews but no photos.
- Around 48% of Yelp users belong to high-income households, 34% come from middle-income groups, and only 18% are from lower-income homes.
ChatGPT’s Website Traffic Statistics
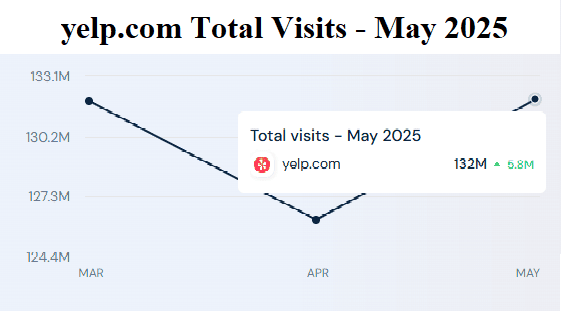
- As of May 2025, the total number of visits to yelp.com was approximately 132 million, representing a 4.59% increase from the previous month.
- The website’s bounce rate was 48.66 in the same period.
- Meanwhile, the average number of pages per visit was 4.82, and the average visit duration was 2 minutes and 26 seconds.
- Globally, Yelp’s website ranked #235, in the United States (#58), and category-wise #1.
By Country
 (Reference: similarweb.com)
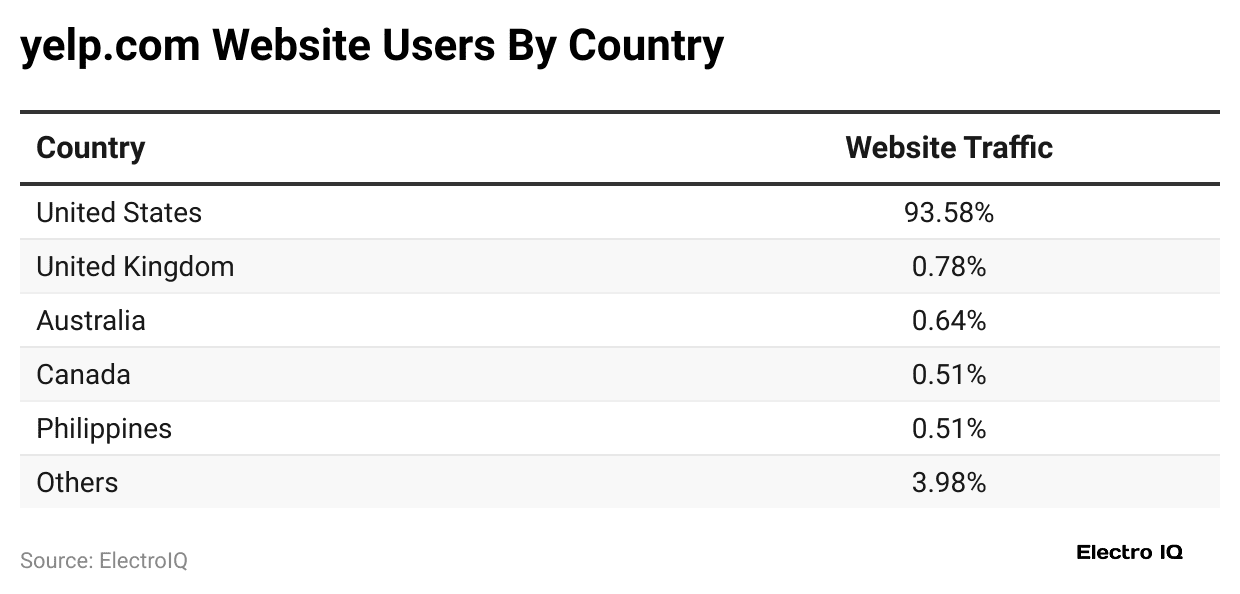
- The United States of America accounted for the highest share on Yelp.com, at 93.58%, in May 2025, representing a 5.81% increase from the previous month.
- The following are the top five countries by website traffic share: the United Kingdom: 0.78% (+0.74%), Australia: 0.64% (+2.66%), Canada: 0.51% (+4.37%), and the Philippines: 0.51% (+10.18%)
- The rest of the countries captured a share of 3.98% Yelp’s web traffic.
By User Demographics
 (Source: similarweb.com)
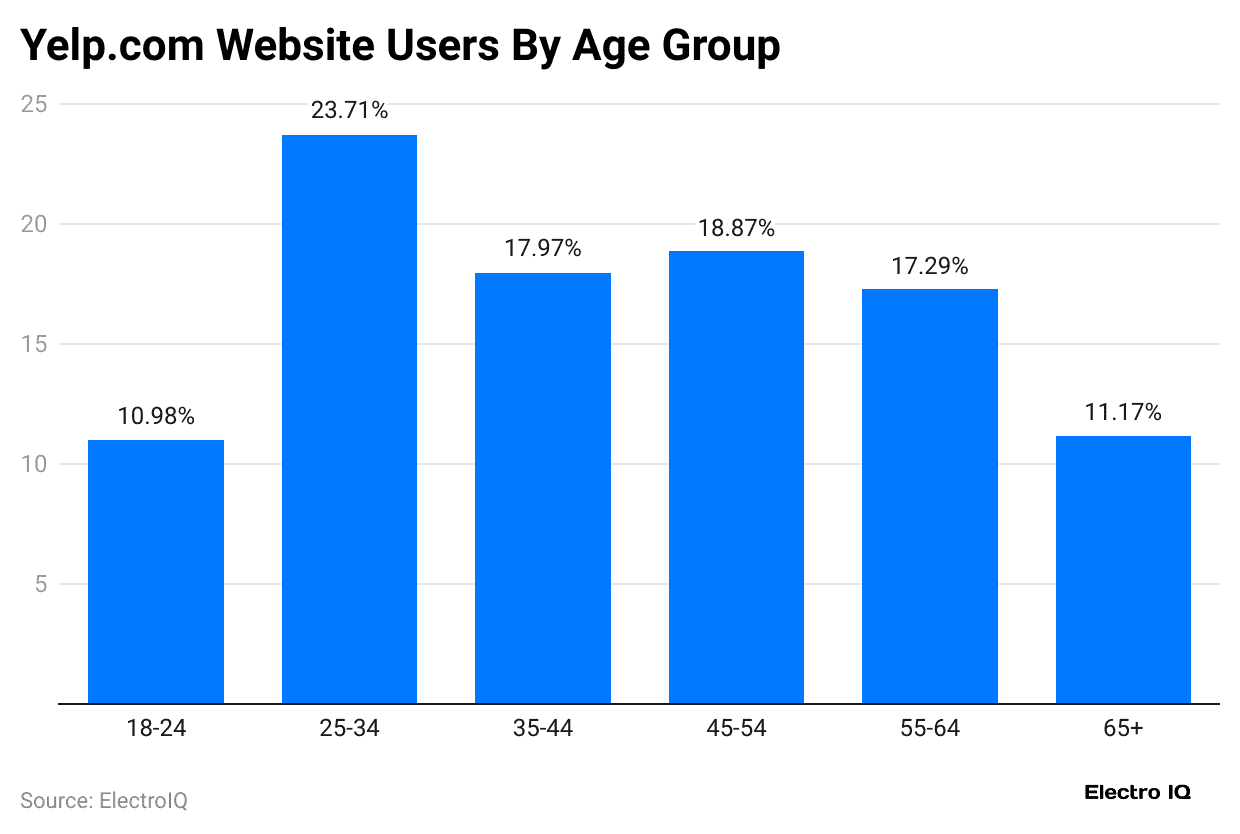
- In the same period, the total number of Yelp’s website users aged 25 to 34 years accounted for the highest share, at 23.71%, followed by those aged 45 to 54 years at 18.87%.
- Furthermore, the age distribution of other users is as follows: 35-44 years (17.97%), 55-64 years (17.29%), 65 years and older (11.17%), and 18-24 years (10.98%).
- Based on gender, approximately 53.84% of Yelp users were female, and 46.16% were male.
By Device
 (Source: semrush.com)
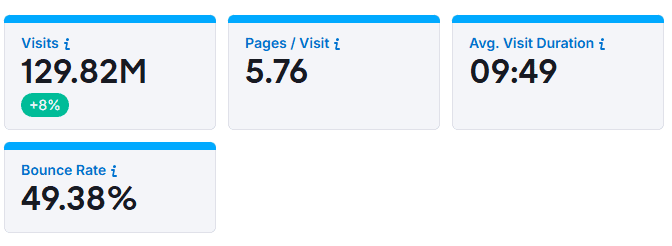
- As of May 2025, the Yelp website received 129.82 million visits, with the bounce rate accounting for 49.38%
- The average visit duration was 09 minutes and 49 seconds, and the average number of pages per visit was 5.76.
- Most people who visit Yelp.com use desktop computers, accounting for approximately 45.82% of the traffic, followed by 54.18% of users on their mobile phones.
| Country | Visitor’s Share | All devices (Millions) | Desktop | Mobile |
| United States | 85.12% | 110.5 | 44.51% |
55.49% |
|
United Kingdom |
2.88% | 3.74 | 70.76% | 29.24% |
| Australia | 1.43% | 1.85 | 49.61% |
50.39% |
|
Germany |
1.3% | 1.69 | 53.88% | 46.12% |
| Canada | 0.85% | 1.1 | 63.68% |
36.32% |
By Marketing Channels Distribution
 (Reference: similarweb.com)
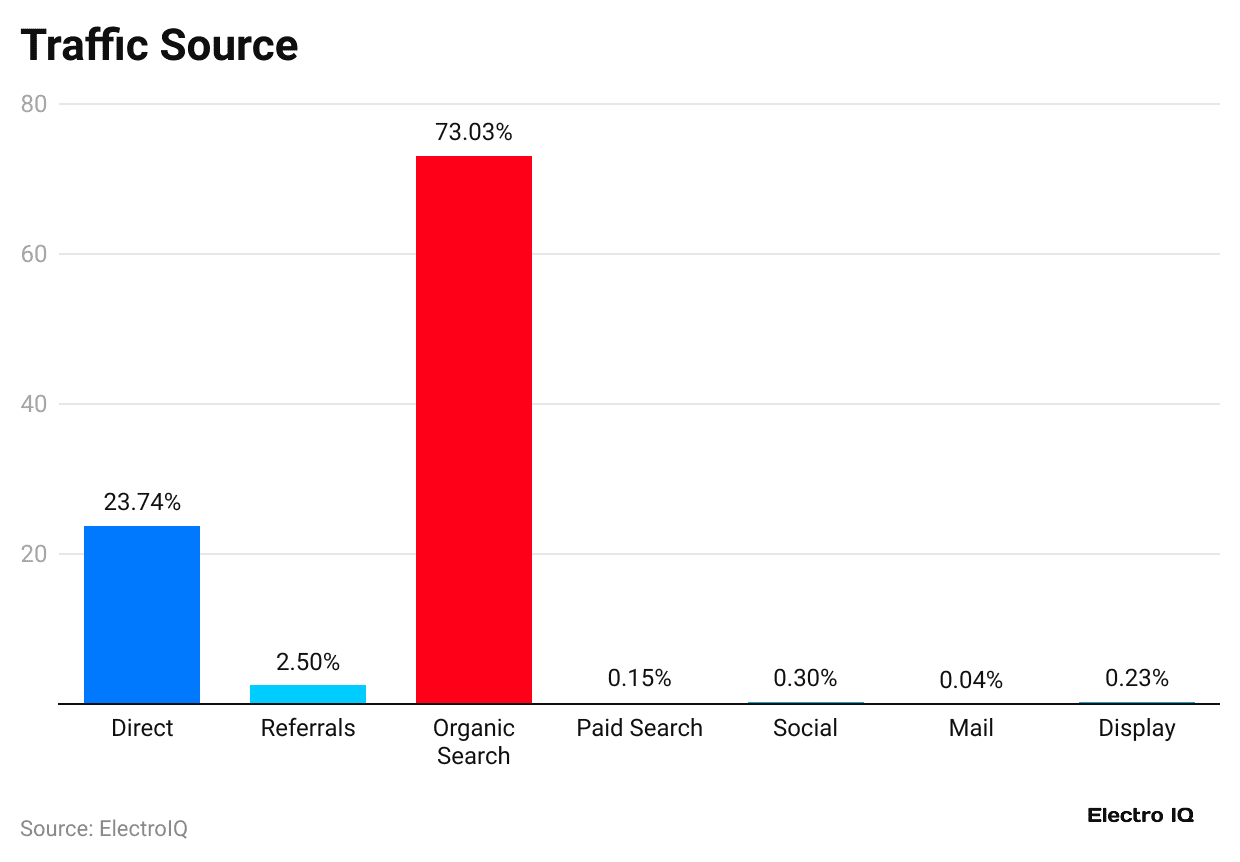
- As of May 2025, the top traffic sources for the Yelp website were organic search with a traffic share of 73.03%, followed by direct search (23.74%).
- Moreover, other marketing channel distributions are followed by referrals (2.5%), paid search (0.15%), social (0.3%), mail (0.04%), and display (0.23%).
By Social Media
 (Source: similarweb.com)
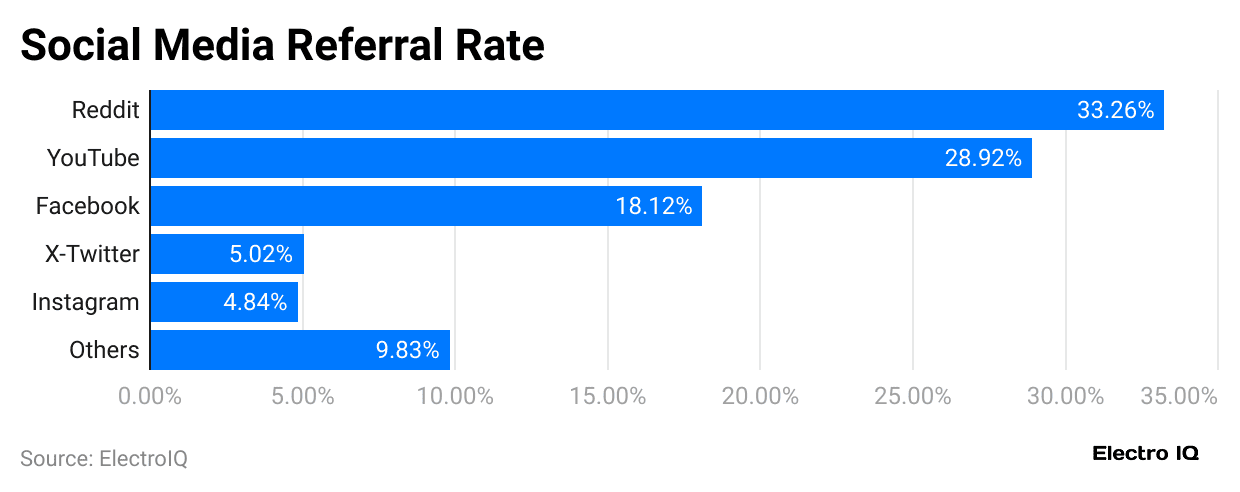
- At the same time, the social network traffic accounted for by Yelp.com remained the highest on Reddit, holding shares of 33.26%, followed by YouTube with a share of 28.92%.
- Other social media traffic sources include Facebook (18.12%), X-twitter (5.02%), Instagram (4.84%), and others (9.83%).
New Releases of Yelp Statistics
| Year | Specifications |
| 2023 |
Yelp Guaranteed, AI-enhanced search, and video in reviews |
|
January, 2024 |
A new visual home feed and search experience, AI-powered business summaries, and review Recognitions |
| April, 2024 |
AI-powered Yelp Assistant and Yelp Fusion AI API for third-party partners |
|
July, 2024 |
Request a Quote for Brands with Leads API |
| November, 2024 |
Auto services platform RepairPal |
|
December, 2024 |
Review insights, an enhanced business discovery, and AI-powered smart selection for advertisers |
| April, 2025 |
Photo recognition for Yelp Assistant and enhancements to Yelp Guest Manager |
Conclusion
This article on Yelp Statistics concludes that Yelp continues to be a powerful force in shaping how people discover and interact with local businesses. With hundreds of millions of reviews, millions of monthly visitors, and strong engagement from high-income users, the platform has remained highly relevant in recent years. Lots of businesses benefit from Yelp’s trusted user feedback, while consumers rely on its reviews to make informed choices.
As digital discovery becomes more personalised and review-driven, Yelp’s role in connecting users to reliable, quality businesses will only grow stronger.
FAQ.
Yelp is free for users, but businesses can pay for ads and premium listing features.
It offers a public API that lets developers access business data, reviews, and ratings.
Log in to Yelp for Business, go to “Billing,” then select “Cancel Ad Program” to stop ads.
Yelp is best for finding trusted local businesses through user reviews, ratings, and detailed recommendations.
Google Business Profile is the best Yelp alternative, offering wider reach and integrated search visibility.

Maitrayee Dey has a background in Electrical Engineering and has worked in various technical roles before transitioning to writing. Specializing in technology and Artificial Intelligence, she has served as an Academic Research Analyst and Freelance Writer, particularly focusing on education and healthcare in Australia. Maitrayee's lifelong passions for writing and painting led her to pursue a full-time writing career. She is also the creator of a cooking YouTube channel, where she shares her culinary adventures. At Smartphone Thoughts, Maitrayee brings her expertise in technology to provide in-depth smartphone reviews and app-related statistics, making complex topics easy to understand for all readers.


