Epson Statistics By Revenue, Market Share, Assets and Facts (2025)
Updated · Nov 10, 2025

Table of Contents
- Introduction
- Editor’s Choice
- About Epson
- History of Epson
- Facts About Epson
- Epson Businesses Analyses
- Epson Market Statistics
- Epson’s Revenue by Segments
- Epson’s Revenue By Region
- Epson Statistics By Assets
- By Inventories
- By Cash Flows
- By Shareholder Returns
- By Management Indicators
- Financial Statement of Epson
- Top Epson Products and Prices
- Conclusion
Introduction
Epson Statistics: Epson is a well-known Japanese company that manufactures printers, projectors, scanners, and factory automation equipment. It started in 1942 and is based in Suwa, Nagano. Over the years, Epson has grown into one of the largest makers of imaging and printing devices. Today, the company also produces smart glasses, robots and greener printing solutions. Epson works to reduce waste and utilise cleaner technology while helping people and businesses transition to digital tools. Its focus on eco-friendly innovation keeps it active in homes, offices and industrial sites across the world.
This article on Epson statistics includes several current analyses from different insights that cover its market performance, regional revenue trends, product shipments, sustainability achievements, and technological advancements shaping its future in the global electronics and imaging industry.
Editor’s Choice
- According to Epson’s official website, in 2024, the company reported revenue of ¥1,362.9 billion (approximately USD 8.88 billion) and business profit of ¥89.5 billion (USD 583 million).
- For the year ended March 2025, Epson’s highest revenue was accounted for by the Americas (about USD 2.93 billion).
- As of March 31, 2025, Epson had 75,352 consolidated employees and 12,792 at the parent company.
 (Source: enlyft.com)
- According to the chart, 13,466 companies use Epson, giving the brand an estimated 33.82% market share in the printers category.
- A report published by Enlyft, based on industry, indicates that the majority of Epson customers come from the Information Technology and Services sector, accounting for approximately 13%.
- Printing, Computer Software, and higher education each account for approximately 6%.
- Most Epson customers are located in the United States (52%), while approximately 7% are based in the United Kingdom.
- Among companies using Epson, 33% are small (less than 50 employees), 39% are mid-sized, and 28% are large enterprises with more than 1,000 employees.
- Among companies that use Epson, 56% are small companies with revenue of less than USD 50 million.
- Large enterprises make up 27% (over USD 1 billion), while medium-sized firms account for 10%.
About Epson
| Metrics | Details |
|
Company |
Seiko Epson Corporation |
| Headquarters |
Main offices in Owa, Suwa, Nagano City, Nagano Prefecture, Japan; corporate registration in Shinjuku, Tokyo |
|
Founded |
May 18, 1942 (Originally as Daiwa Kogyo, Ltd.) |
| Type |
Public company, listed in Tokyo (TYO: 6724) |
|
Industry |
Electronics |
| Founder |
Hisao Yamazaki |
|
Key leaders |
Minoru Usui (Chairman & Director) Yasunori Ogawa (President, CEO & Representative Director) |
|
Products |
Printers, personal computers, robots, projectors, watches, smart glasses, semiconductors |
|
Employees |
75,352 (as of March 31, 2025) |
| Division/brand |
Orient Watch |
|
Website |
corporate.epso. |
History of Epson
- 1942: Daiwa Kogyo Ltd. is founded in Suwa, Nagano, laying the foundation for what later becomes Seiko Epson.
- 1959: The Suwa Plant becomes Suwa Seikosha Co., Ltd., a forerunner of Seiko Epson.
- 1961: Shinshu Seiki Co., Ltd. is established as a precision-parts subsidiary.
- 1968: The EP-101 electronic mini-printer launches and becomes the origin of Epson’s printer business. The later brand name “Epson” is derived as the “son” of EP.
- 1975: The Epson brand is formally established for next-generation printers based on EP-101. Epson America, Inc. is created to expand overseas sales.
- 1979: TP-80, the company’s first dot-matrix printer, drives growth in computer printing.
- 1980: MX-80 serial dot-matrix printer debuts and becomes a global best-seller in its class.
- 1982: Shinshu Seiki changes its corporate name to Epson Corporation and introduces the HX-20, recognized as the first notebook-sized handheld computer.
- 1984: SQ-2000 becomes Epson’s first commercial inkjet printer, marking the company’s move into non-impact printing.
- 1985: Suwa Seikosha Co., Ltd. and Epson Corporation merge to form Seiko Epson Corporation.
- 1993: Micro Piezo inkjet technology debuts in the Epson Stylus 800, establishing Epson’s core printhead platform.
- 1994: Epson Stylus Color introduces 720 dpi color inkjet output, advancing desktop photo printing.
- 2003: Seiko Epson lists on the First Section of the Tokyo Stock Exchange.
- 2010: Launch of the first EcoTank high-capacity ink tank printers, initially in Indonesia, redefining low-cost, high-volume inkjet printing.
- 2011: EcoTank printers roll out in India, marking a major adoption market for the ink-tank platform.
Epson India - 2015: The EcoTank line is introduced in the United States as “Supertank” all-in-ones.
- 2024: Cumulative EcoTank sales surpass 100 million units worldwide.
- 2025: Seiko Epson reports revenue of ¥1,362.9 billion and a global workforce of 75,352 as of March 31.
Facts About Epson
- The name “Epson” came from “Electronic Printer’s Son,” a nod to the EP-101 mini-printer that started the printer line in 1968.
- The EP-101 evolved from Seiko’s printed-results timing system used at the 1964 Tokyo Olympics, linking the company’s watchmaking roots with printing.
- Epson went public in June 2003 by listing on the Tokyo Stock Exchange’s First Section.
- It has been part of the Nikkei Stock Average, a Japanese stock index, since 2017.
- In 2004, Epson launched the R-D1, the first digital rangefinder on the market, which supported Leica M lenses and, via an adapter, Leica M39 lenses.
- In 2006, a lower-cost R-D1S with identical hardware replaced it.
- Epson’s projector business has led the global market for 23 consecutive years, with about 49% share in projection technology cited for CY24Q2.
- EcoTank high-capacity ink tank printers debuted in 2010 in Indonesia and surpassed 100 million cumulative units by October 2024.
- PaperLab uses Dry Fiber Technology to recycle office paper on-site with a virtually dry process, producing up to 720 A4 sheets per hour.
- Epson introduced its first SCARA industrial robots in 1983 and is described as the world’s leading SCARA maker, marking 40 years in robotics in 2023.
- The installed base of Epson robots was reported at well over 85,000 worldwide by 2019, highlighting a long manufacturing footprint in automation.
- Headquarters are in Suwa, Nagano Prefecture, Japan, on the shore of Lake Suwa, reflecting the firm’s origins in precision timekeeping.
- The corporate lineage began in 1942 as Daiwa Kogyo, which later merged to form Seiko Epson; the EP-101’s success led to formal adoption of the Epson brand in 1975.
- The brand’s 50th anniversary is being celebrated in 2025, emphasizing a half-century of information-equipment innovation.
- The EP-101 is recognized by museums as the first compact electronic mini-printer, weighing about 2.5 kg and small enough for calculators of its era.
- Beyond printers and projectors, Epson also designs and manufactures timepieces and components within the broader Seiko family, including work on high-grade watch lines.
- In November 2011, it introduced smartglasses with the Moverio BT-100, the first consumer model featuring transparent optics.
- In September 2012, the Expression Premium XP-800 “Small-in-One” added wireless printing capabilities.
- By Q3 2012, its global share in printers, copiers, and MFPs was 15.20%.
- In September 2015, the ET-4550 let users refill separate tanks from bottles instead of cartridges.
- In 2016, Epson introduced the SureColor SC-P10000, a 44-inch large-format model that uses ten-color inks on media up to 44 inches wide.
- By 2025, Consumer Reports rated Epson’s all-in-one tank inkjets the best.
Epson Businesses Analyses
| Office & Home Printing | Commercial & Industrial Printing | Visual Communications | Manufacturing Solutions | Wearable Products | Microdevices |
|
|
|
|
|
|
Epson Market Statistics
- Epson reports that in 2024, it earned ¥1,362.9 billion in revenue (approximately USD 8.88 billion) and generated ¥89.5 billion in business profit (approximately USD 583 million).
- By March 31, 2025, the group employed a total of 75,352 people, including 12,792 at the parent company.
- The organisation consisted of 89 companies, with 21 based in Japan and 68 overseas.
- Approximately 83% of 2024 sales came from customers outside Japan.
 (Source: corporate.epson)
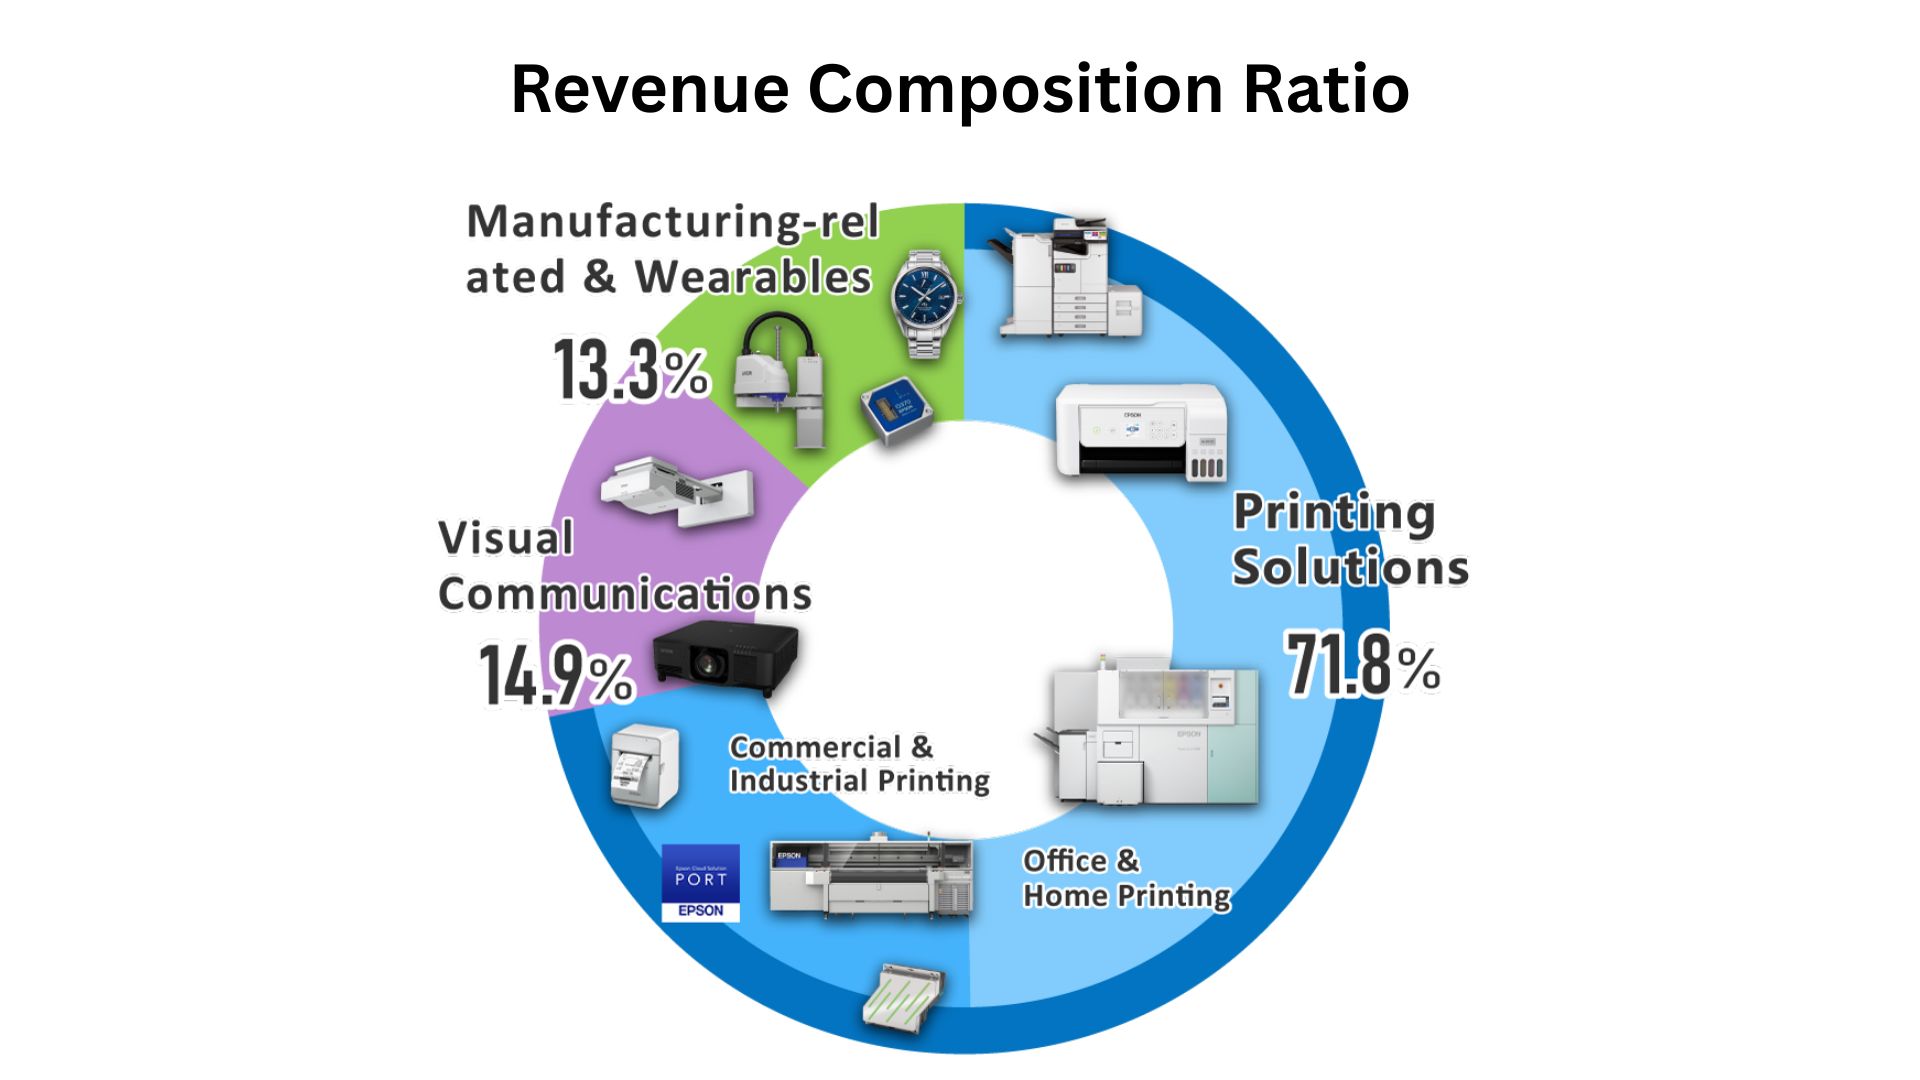
- In the fiscal year 2024, Epson’s Printing Solutions segment generated the highest revenue share, accounting for 71.8%.
- Meanwhile, Visual Communications contributed 14.9% with projectors and display technologies, while Manufacturing-related and Wearables accounted for 13.3%.
Epson’s Revenue by Segments
 (Reference: corporate.epson)
| Period (Ended Mar 2025) | Office & Home Printing | Commercial & Industrial Printing | Visual Communications | Manufacturing-related & Wearables | Corporate expenses & Others, Eliminations |
| (Millions of yen) | |||||
| Six months ended | 328,778 (USD 2,191.85 million) | 147,839 (USD 985.59 million) | 108,075 (USD 720.50 million) | 89,946 (USD 599.64 million) | -397 (USD -2.65) |
| Nine months ended | 512,925 (USD 3,419.50 million) | 218,974 (USD 1,459.83 million) | 159,071 (USD 1,060.47 million) | 134,171 (USD 894.47 million) | -1,258 (USD -8.39) |
| Year ended | 680,478 (USD 4,536.52 million) | 299,760 (USD 1,998.40 million) | 203,782 (USD 1,358.55 million) | 181,463 (USD 1,209.75 million) | -2,450 (USD -16.33) |
| Three months ended | 149,248 (USD 994.99 million) | 77,748 (USD 518.32 million) | 45,459 (USD 303.06 million) | 49,874 (USD 332.49 million) | -1,435 (USD -9.57) |
| Six months ended | 318,429 (USD 2,122.86 million) | 159,858 (USD 1,065.72 million) | 90,039 (USD 600.26 million) | 101,586 (USD 677.24 million) | -2,523 (USD -16.82) |
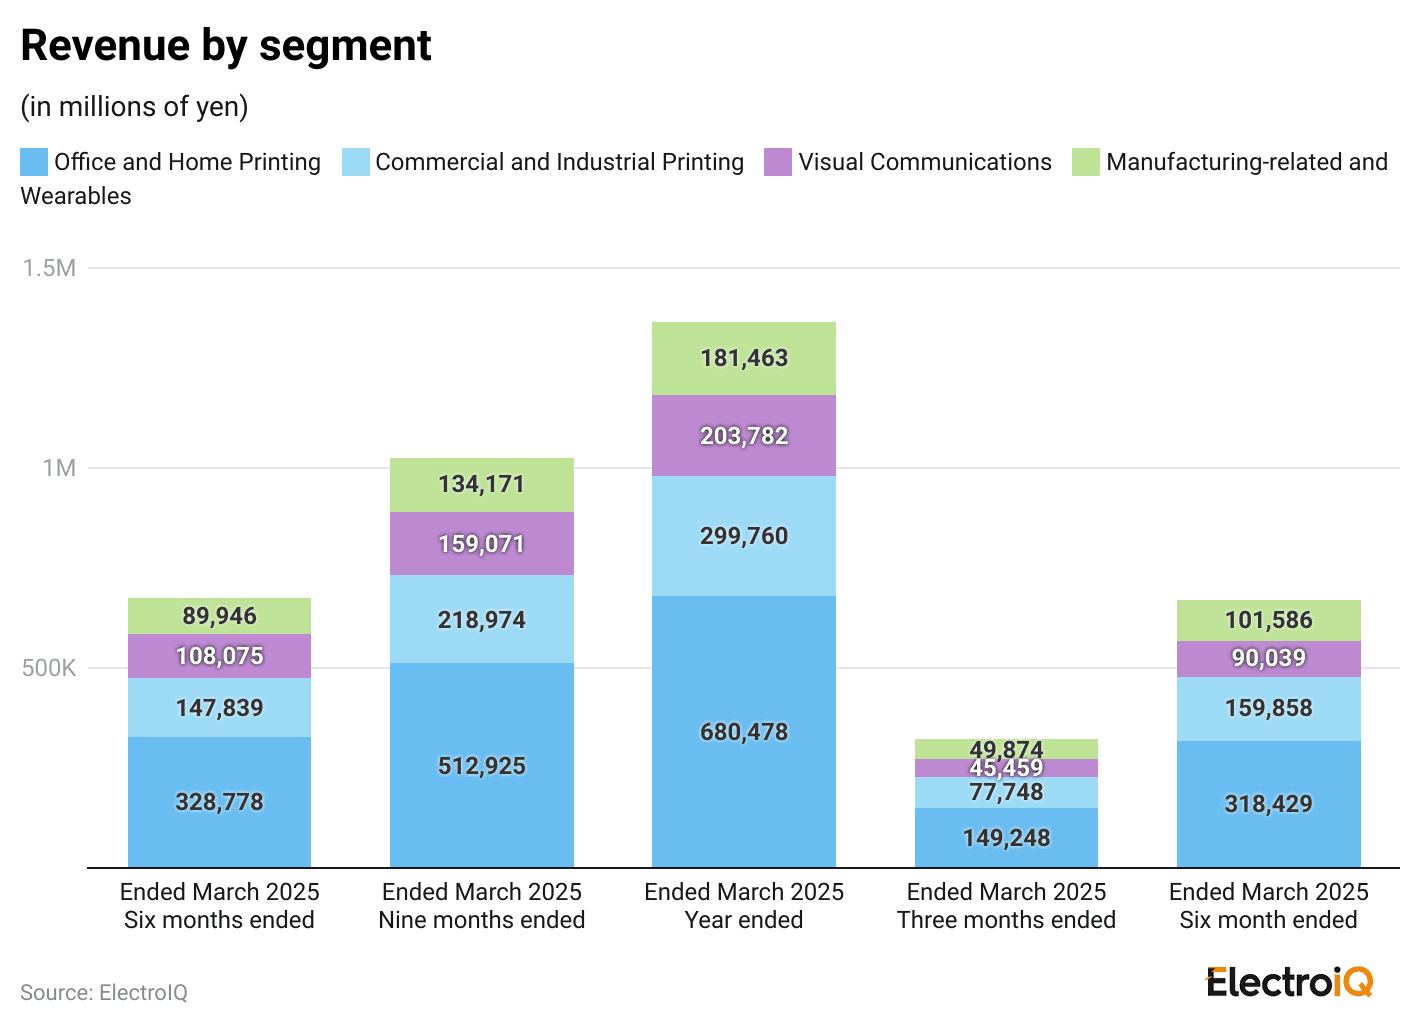
- Epson recorded ¥328,778 million (USD 2,191.85 million) from Office and Home Printing during the first six months ended March 2025. The Commercial and Industrial Printing segment generated ¥147,839 million (USD 985.59 million), while Visual Communications earned ¥108,075 million (USD 720.50 million). The Manufacturing-related and Wearables business contributed ¥89,946 million (USD 599.64 million), and corporate adjustments resulted in a loss of ¥397 million (USD -2.65 million).
- For the nine-month period, Office and Home Printing achieved ¥512,925 million (USD 3,419.50 million), followed by ¥218,974 million (USD 1,459.83 million) from Commercial and Industrial Printing. Visual Communications brought in ¥159,071 million (USD 1,060.47 million), and Manufacturing-related and Wearables added ¥134,171 million (USD 894.47 million). Corporate expenses recorded a reduction of ¥1,258 million (USD -8.39 million).
- Over the full fiscal year, Office and Home Printing remained the top contributor with ¥680,478 million (USD 4,536.52 million). Commercial and Industrial Printing delivered ¥299,760 million (USD 1,998.40 million), Visual Communications accounted for ¥203,782 million (USD 1,358.55 million), and Manufacturing-related and Wearables reached ¥181,463 million (USD 1,209.75 million). Corporate eliminations showed ¥-2,450 million (USD -16.33 million).
- During the three-month period, Office and Home Printing recorded ¥149,248 million (USD 994.99 million), with ¥77,748 million (USD 518.32 million) from Commercial and Industrial Printing, ¥45,459 million (USD 303.06 million) from Visual Communications, and ¥49,874 million (USD 332.49 million) from Manufacturing-related and Wearables. Corporate losses totaled ¥1,435 million (USD -9.57 million).
- In the following six-month period, Office and Home Printing generated ¥318,429 million (USD 2,122.86 million). The Commercial and Industrial Printing segment reported ¥159,858 million (USD 1,065.72 million), Visual Communications earned ¥90,039 million (USD 600.26 million), and Manufacturing-related and Wearables contributed ¥101,586 million (USD 677.24 million). Corporate expenses and eliminations accounted for ¥-2,523 million (USD -16.82 million).
Epson’s Revenue By Region
 (Reference: corporate.epson)
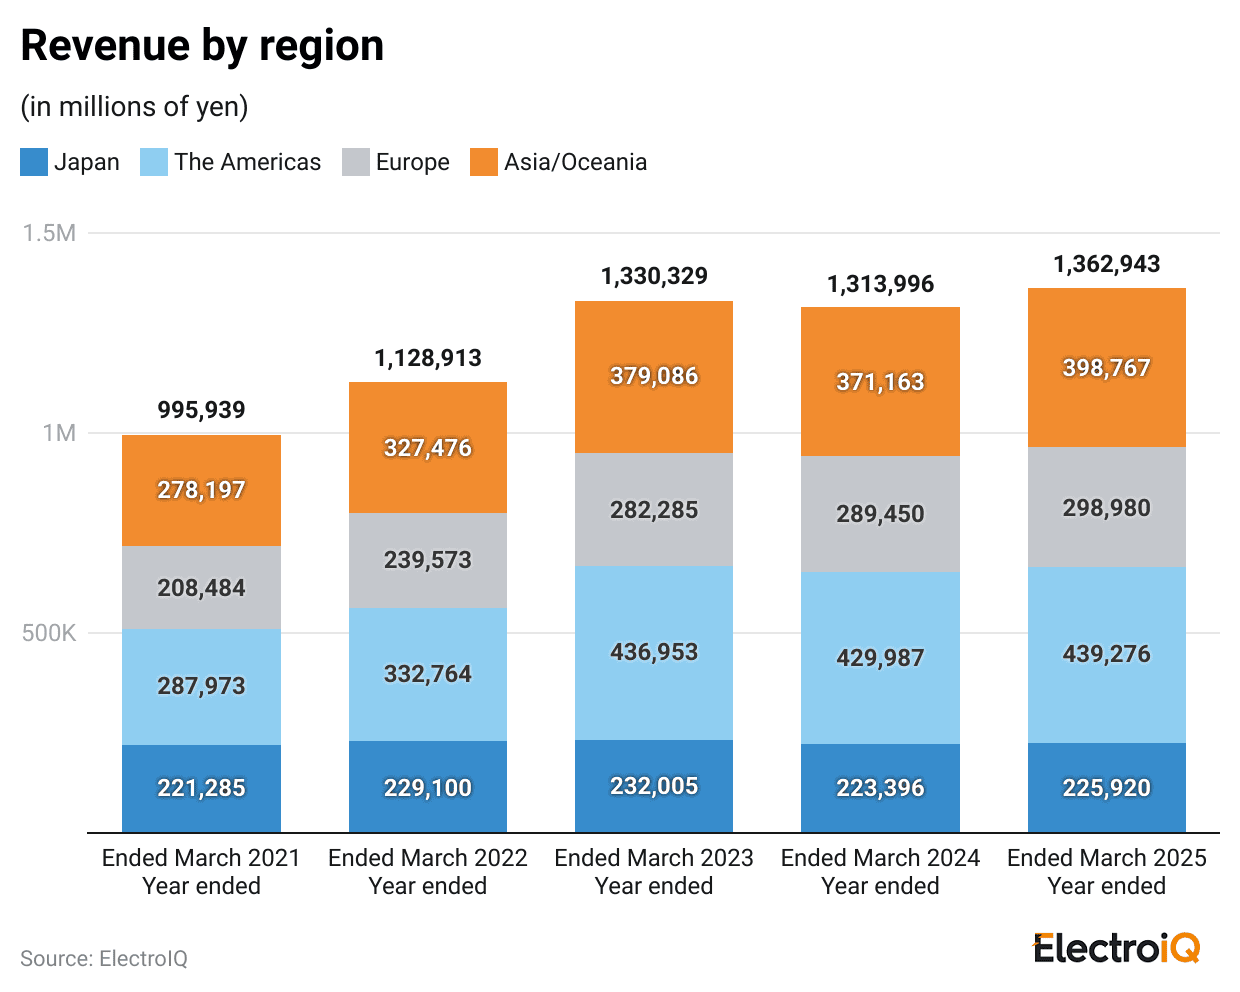
- For the year ended March 2024, Epson recorded its highest revenue in the Americas, which accounted for USD 2.87 billion.
- The revenue analysis of other regions follows Japan (USD 1.49 billion), Europe (USD 1.93 billion), and Asia/Oceania (USD 2.47 billion).
- For the year ended March 2025, Epson’s revenue segmentation by region is the Americas (USD 2.93 billion), Asia/Oceania (USD 2.66 billion), Europe (USD 1.99 billion), and Japan (USD 1.51 billion).
Epson Statistics By Assets
 (Source: corporate.epson)
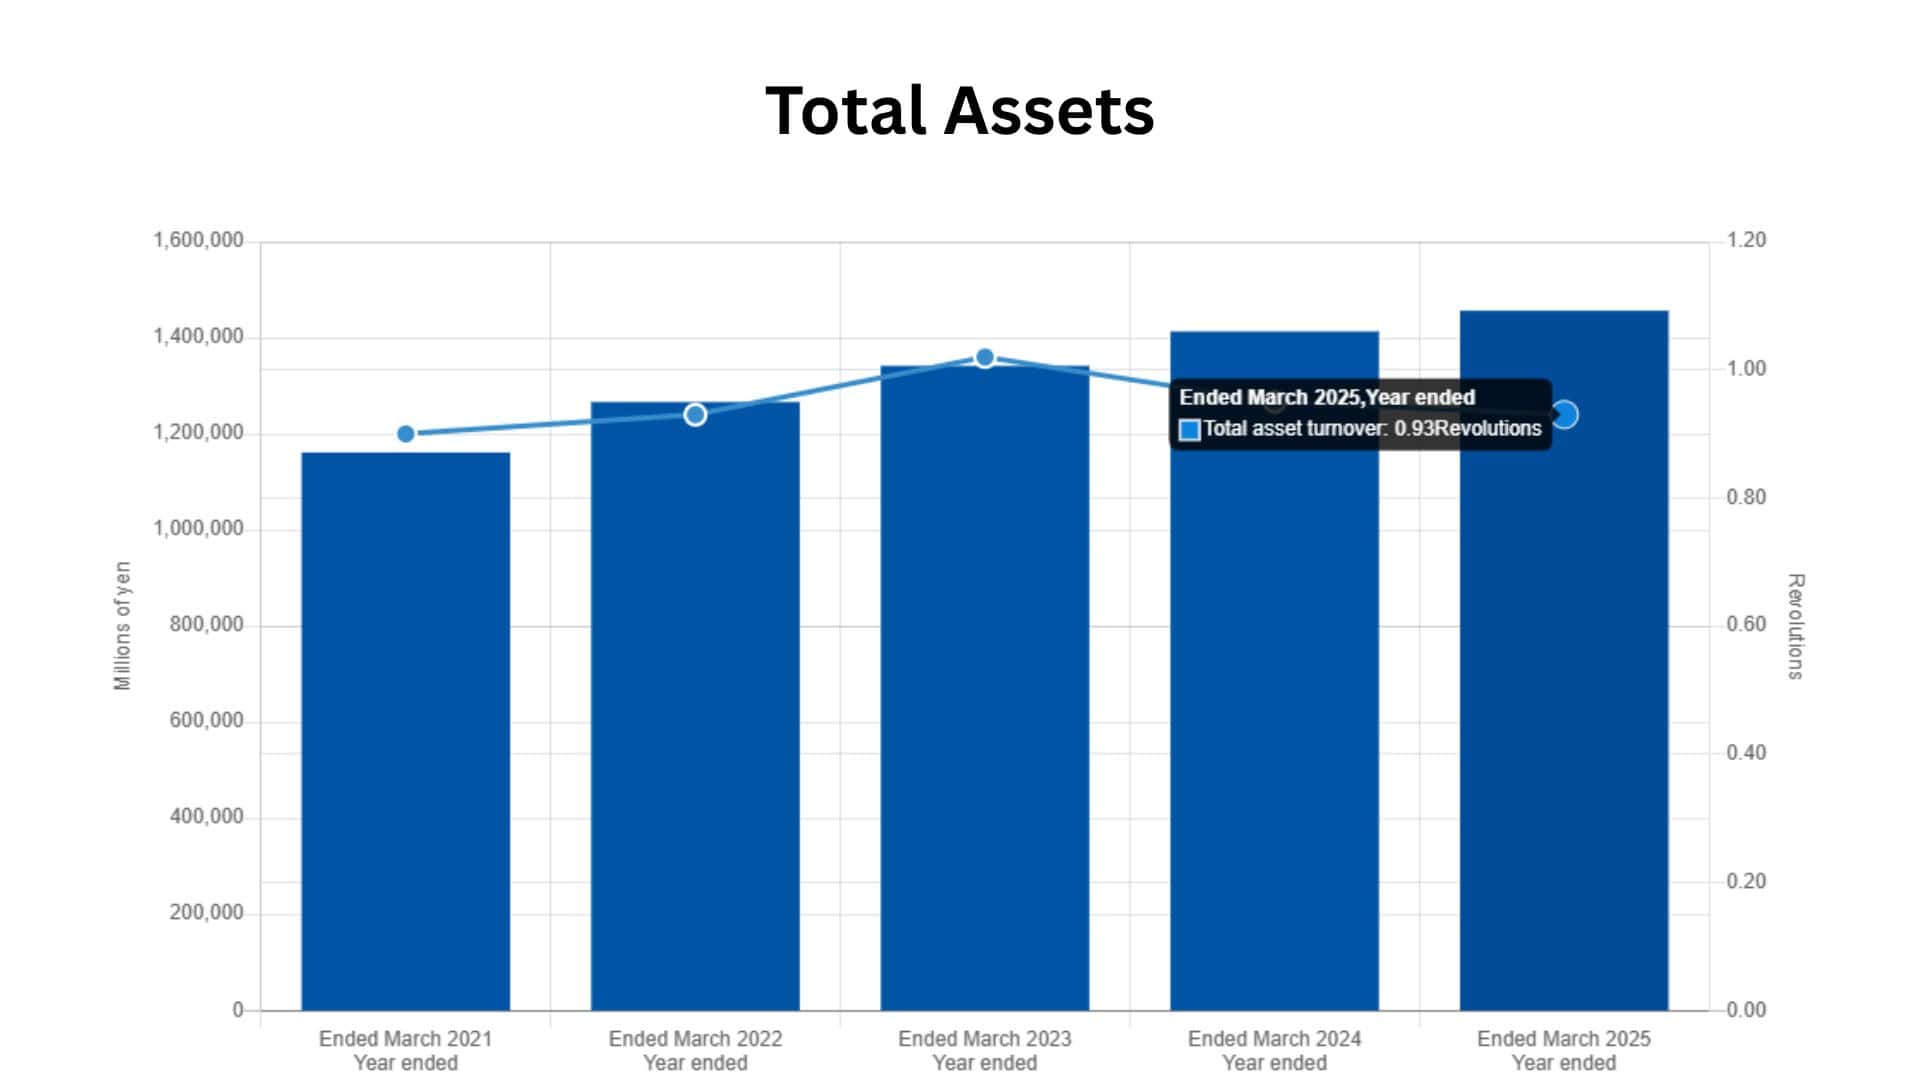
- By the end of March 2025, Epson’s total assets were approximately USD 9.71 billion, and its total asset turnover was 0.93 times.
Furthermore, the previous yearly analysis is mentioned in the table below:
| Year ended | Total assets (Millions of yen) | Total asset turnover (Revolution) |
| 2024 | 1,413,094 (USD 9.42 billion) | 0.95 |
| 2023 | 1,341,575 (USD 8.94 billion) | 1.02 |
| 2022 | 1,266,420 (USD 8.44 billion) | 0.93 |
| 2021 | 1,161,314 (USD 7.74 billion) | 0.90 |
By Inventories
| March 2025 | Total assets (Millions of yen) | Turnover by days |
| Six months ended | 358,852 (USD 2,392.35 million) | 97 |
| Nine months ended | 382,753 (USD 2,551.69 million) | 103 |
| Year ended | 369,781 (USD 2,465.21 million) | 99 |
| Three months ended | 377,626 (USD 2,517.51 million) | 107 |
| Six months ended | 395,728 (USD 2,638.19 million) | 109 |
By Cash Flows
 (Reference: corporate.epson)
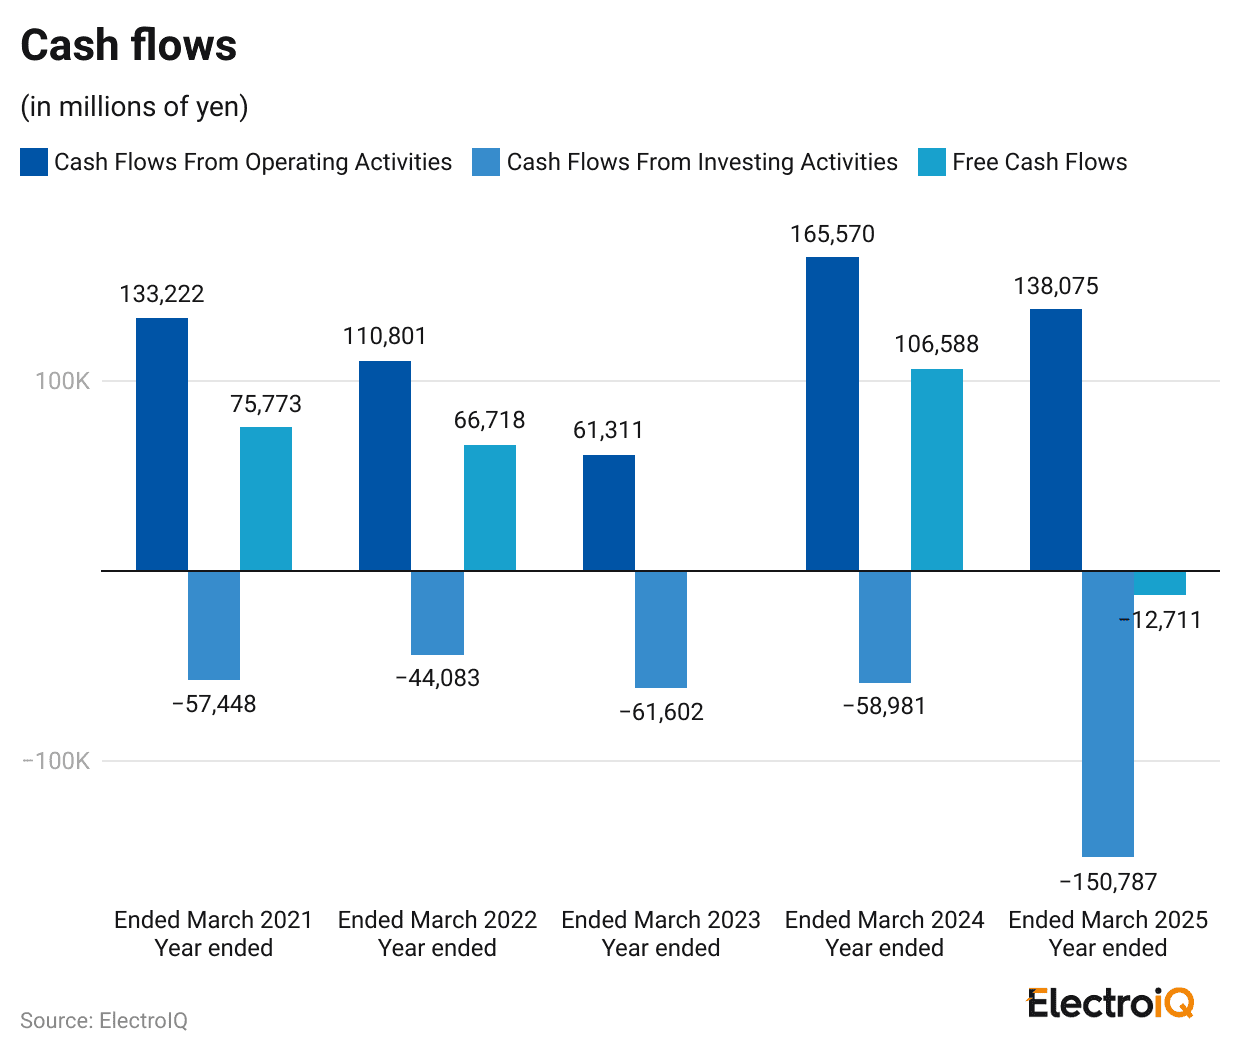
| Period (Ended Mar 2025) | Cash flows from operating activities | Cash flows from investing activities | Free cash flows |
| (Millions of yen) | |||
| Six months ended (H1) | 69,975 (USD 466.50 million) | -37,138 (USD -247.59 million) | 32,836 (USD 218.91 million) |
| Nine months ended | 108,736 (USD 724.91 million) | -134,199 (USD -894.66 million) | -25,462 (USD -169.75 million) |
| Year ended | 138,075 (USD 920.50 million) | -150,787 (USD -1,005.25 million) | -12,711 (USD -84.74 million) |
| Three months ended (Q4) | 3,236 (USD 21.57 million) | -22,156 (USD -147.71 million) | -18,920 (USD -126.13 million) |
| Six months ended (H2) | 24,238 (USD 161.59 million) | -36,840 (USD -245.60 million) | -12,601 (USD -84.01 million) |
- During the first six months ended March 2025, Epson generated ¥69,975 million (USD 466.50 million) from operating activities. Cash outflow from investing activities was ¥37,138 million (USD -247.59 million), resulting in free cash flows of ¥32,836 million (USD 218.91 million). This indicates positive liquidity in the early half of the fiscal year.
- Over the nine-month period, operating cash inflow increased to ¥108,736 million (USD 724.91 million), while investing activities consumed ¥134,199 million (USD -894.66 million). This led to negative free cash flows of ¥25,462 million (USD -169.75 million), showing the impact of higher investment spending.
- For the full year, operating activities generated ¥138,075 million (USD 920.50 million), but investing cash flows amounted to ¥150,787 million (USD -1,005.25 million). Consequently, Epson recorded negative free cash flows of ¥12,711 million (USD -84.74 million), suggesting that large capital investments outweighed cash inflows from operations.
- In the three-month period, operating cash inflow dropped to ¥3,236 million (USD 21.57 million), and investing cash outflow stood at ¥22,156 million (USD -147.71 million), producing negative free cash flows of ¥18,920 million (USD -126.13 million). This quarter reflected weaker cash generation and higher expenditure.
- During the last six months of the fiscal year, operating activities contributed ¥24,238 million (USD 161.59 million), while ¥36,840 million (USD -245.60 million) was used in investing activities. The period closed with negative free cash flows of ¥12,601 million (USD -84.01 million), highlighting continued investment commitments and pressure on cash reserves.
 (Reference: corporate.epson)
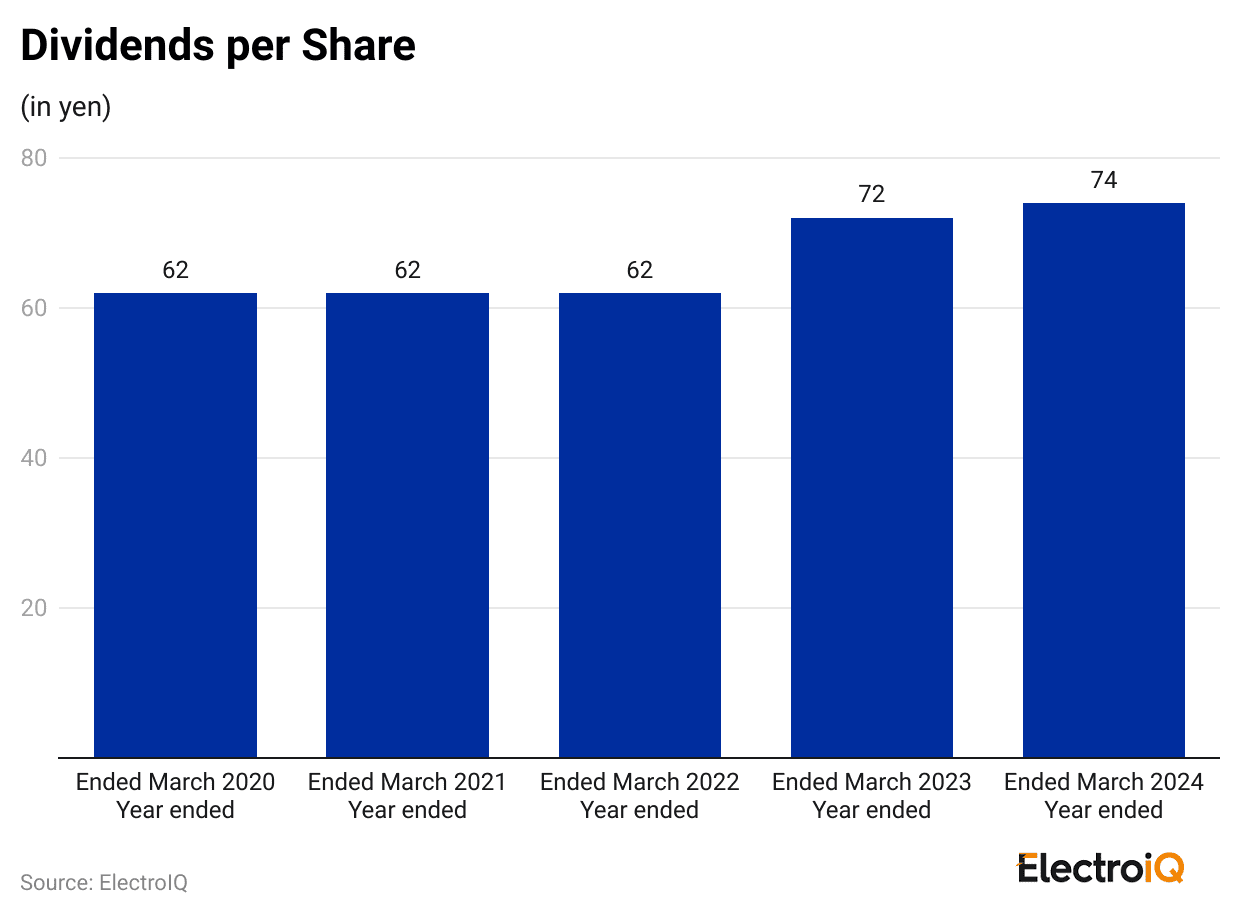
- Epson’s “Dividends per Share” are about USD 0.49 for the year ended March 31, 2024.
- Meanwhile, the amounts were USD 0.48 for March 31, 2023, and USD 0.41 for each of March 31, 2022, March 31, 2021, and March 31, 2020.
- The chart’s y-axis top scale of 80 yen is roughly USD 0.53.
By Management Indicators
 (Reference: corporate.epson)
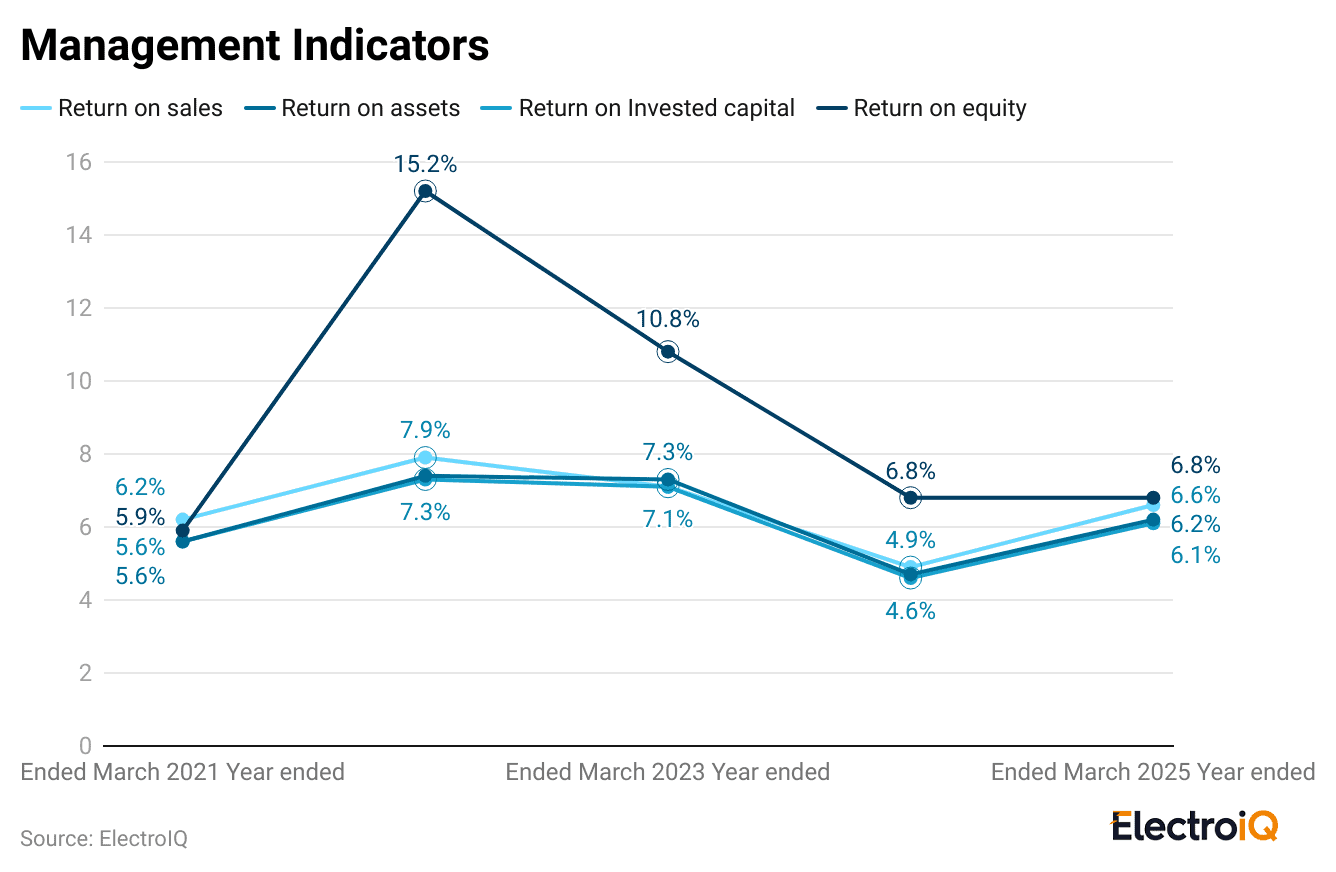
| Ended March | Return on sales (business profit) (ROS) | Return on assets (business profit) (ROA) | Return on equity (ROE) | Return on Invested Capital (ROIC) |
| 2025 | 6.6% | 6.2% | 6.8% | 6.1% |
| 2024 | 4.9% | 4.7% | 6.8% | 4.6% |
| 2023 | 7.1% | 7.3% | 10.8% | 7.1% |
| 2022 | 7.9% | 7.4% | 15.2% | 7.3% |
| 2021 | 6.2% | 5.6% | 5.9% | 5.6% |
Financial Statement of Epson
| Metrics | Amount (USD million) |
| Revenue | 9,086.29 |
| Cost of revenue | 5,799.45 |
| Gross profit | 3,286.85 |
| Selling, general & administrative (SG&A) | 2,287.31 |
| Research & development | 285.43 |
| Depreciation & amortization | 116.85 |
| Interest (operating), net | 63.47 |
| Other operating expenses | 6.20 |
| Total operating expense | 8,585.57 |
| Operating income | 500.72 |
| Interest (non-operating), net | 27.67 |
| Other, net | -5.75 |
| Income before taxes | 522.63 |
| Provision for income taxes | 154.76 |
| Net income after taxes | 367.87 |
| Net income before extraordinary items | 367.85 |
| Net income | 367.85 |
Top Epson Products and Prices
- EcoTank ET-4950 (All-in-one printer): USD 499.99
- EcoTank ET-4850 (All-in-one printer): USD 499.99 (promo often USD 349.99)
- EcoTank ET-15000 (13″×19″ all-in-one printer): USD 699.99
- EcoTank Pro ET-5850 (Business AIO printer): USD 849.99 (current savings price USD 799.99).
- SureColor P700 (13″ photo printer): USD 829.00 (sale USD 729.00)
- Home Cinema 3800 (4K PRO-UHD projector): USD 1,799.99
- EpiqVision Mini EF22 (Smart laser projector): USD 999.99
- RapidReceipt RR-600W (Receipt/document scanner): USD 529.99 (sale USD 429.99)
- WorkForce ES-50 (Portable document scanner): USD 159.99 (sale USD 129.99).
- Moverio BT-45C (AR smart glasses): USD 1,599.00
Conclusion
After completing the article on Epson Statistics, it can be concluded that the company now serves global customers with printers, imaging gear, and automation tools. The brand is now recognised for its reliable products and innovative solutions. Its devices are made to use less energy and meet strict environmental standards.
As a result, people and businesses can rely on Epson’s technology day after day. With many industries adopting digital tools, Epson’s move toward smarter, eco-friendly products will help it keep a leading role in the global electronics market.
Sources
FAQ.
Epson produces a wide range of printers, including home and office inkjets, business models, large-format graphic printers, and industrial label machines.
Epson printers use genuine Epson ink cartridges or EcoTank bottles, which are specifically designed for each printer model.
Epson runs green programs, including recycling, energy-saving products, and initiatives to reduce environmental impact, worldwide today.
Third-party supplies may work, but Epson recommends genuine products for optimal performance.
Epson printers usually last 4 to 8 years, depending on usage, maintenance, and model type.

Maitrayee Dey has a background in Electrical Engineering and has worked in various technical roles before transitioning to writing. Specializing in technology and Artificial Intelligence, she has served as an Academic Research Analyst and Freelance Writer, particularly focusing on education and healthcare in Australia. Maitrayee's lifelong passions for writing and painting led her to pursue a full-time writing career. She is also the creator of a cooking YouTube channel, where she shares her culinary adventures. At Smartphone Thoughts, Maitrayee brings her expertise in technology to provide in-depth smartphone reviews and app-related statistics, making complex topics easy to understand for all readers.


