App Monetization Statistics By Publishers, Retention, Advertising, Revenue, Trends and Facts (2026)
Updated · Mar 14, 2026


Table of Contents
- Introduction
- Editor’s Choice
- App Monetization Methods By U.S. Publishers
- iOS Ad Hosting Leaders Highlight Scale
- Android Ad Inventory Giants Signal Scale-First Monetization Models
- Global App Retention Trends
- Mobile Video Advertising
- Social Media And Communication Apps
- Mobile Commerce Apps
- Mobile Gaming and In-App Advertising
- Subscription App Revenue Models
- Conclusion
Introduction
App Monetization Statistics: Mobile app monetization has become the most profitable online revenue source since people now use mobile devices more than desktop computers. The app economy extended beyond downloads in 2025 because it implemented established monetization methods that will create substantial revenue through user interactions. Developers test various strategies to enhance their revenue potential through in-app purchases (IAPs), subscriptions, and advertising, and hybrid revenue models while creating better experiences for their users.
This article presents essential app monetization statistics, covering revenue figures from 2025, user behavior patterns, and research-backed evaluations.
Editor’s Choice
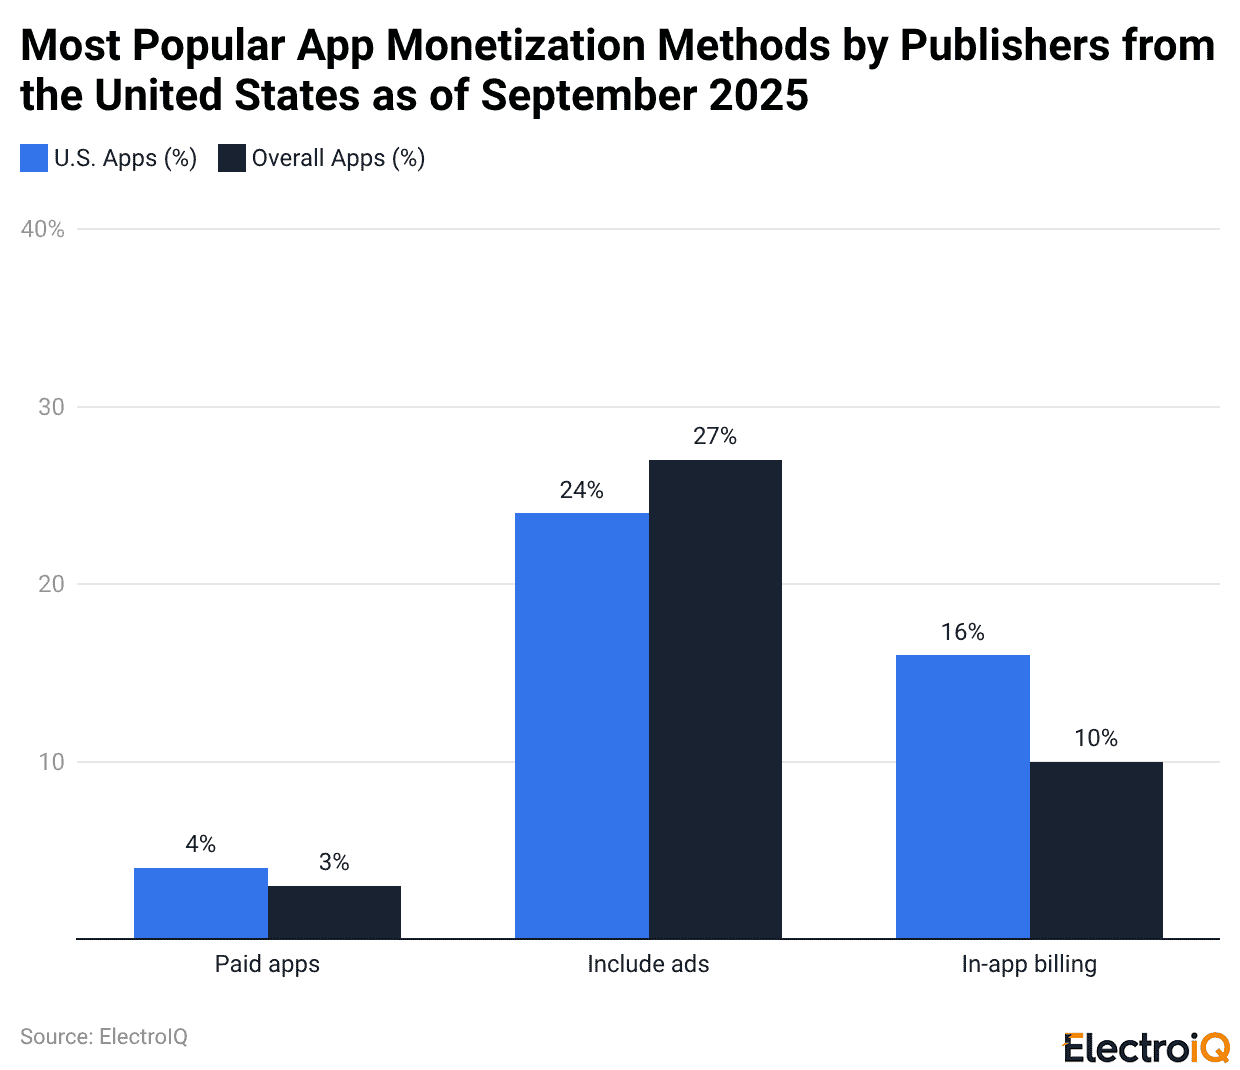
- The United States shows 4% of its applications using paid downloads, which exceeds the global average of 3% and demonstrates that upfront pricing exists as a specialized market.
- About 25% of U.S. apps rely on in-app ads, below the 27% global benchmark.
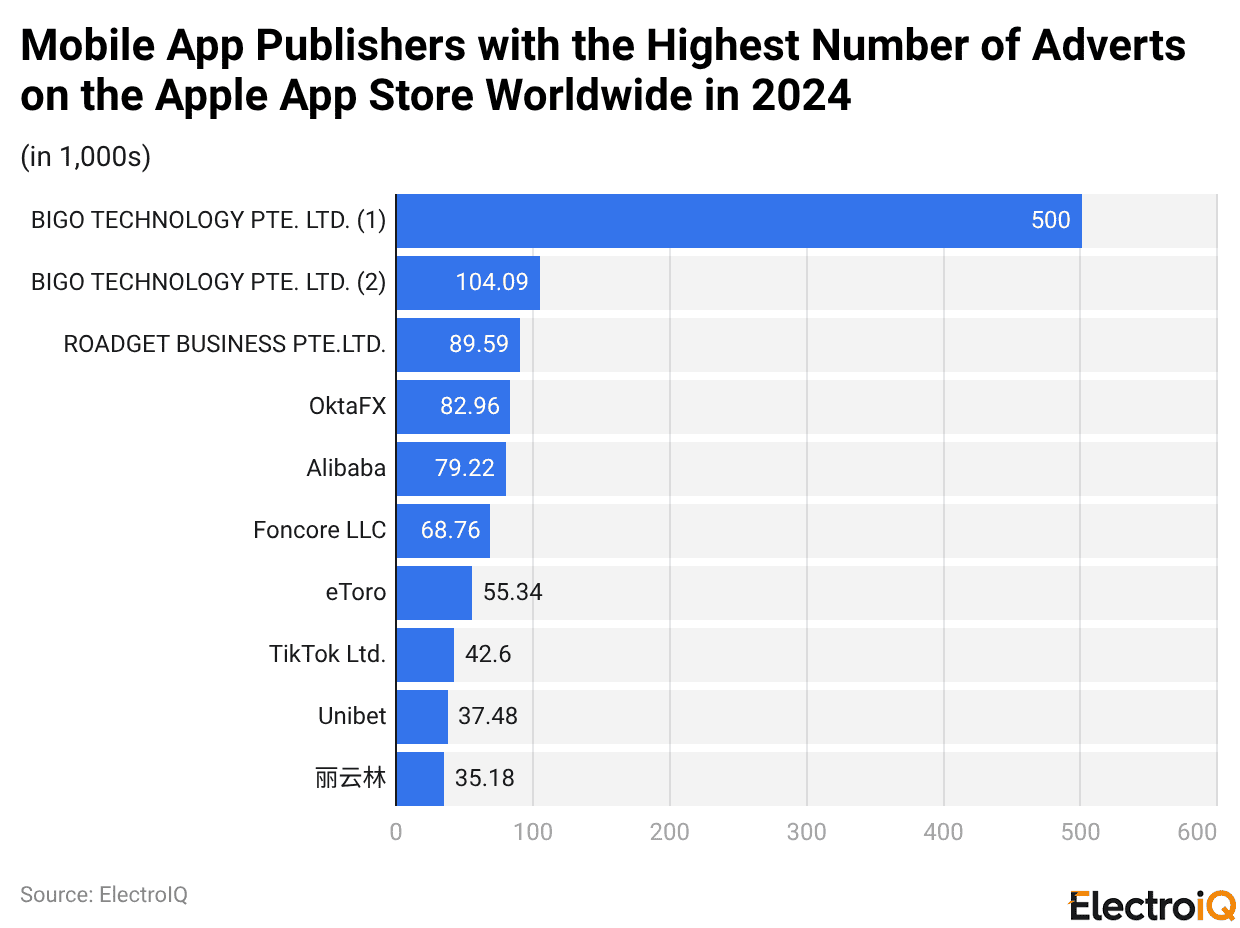
- During 2024, BIGO Technology operated more than 500000 advertisements on iOS, which enabled the company to reach ad-scale monetization.
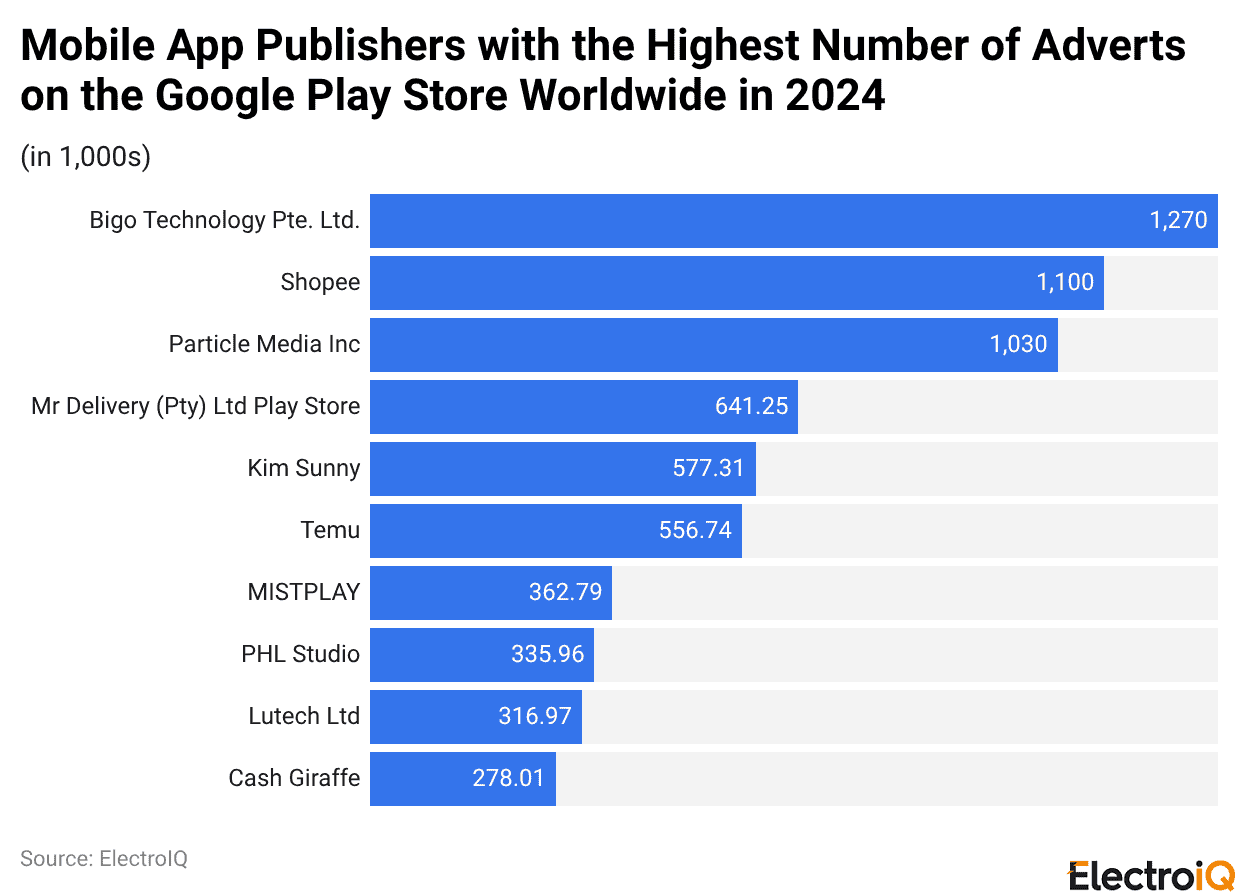
- BIGO generated over 1.27 million advertisements on Android, which demonstrated how platform-specific features of the system created advantages for advertising volume.
- U.S. mobile ad spending reached an estimated USD 228.92 billion in 2025, up 12.6% YoY. Mobile video accounted for over 75% of total mobile ad spend by 2025.
- Social media ad revenue exceeded USD 180 billion globally in 2024. Mobile commerce represented 59% of total eCommerce sales in 2025.
- Mobile games generate roughly USD 15 annual revenue per user versus USD 3 for non-gaming apps.
- The worldwide market for in-app advertising reached an estimated value of USD 390.04 billion in 2025.
- The annual subscription model maintains 28% of its users after one year, while the monthly subscription models achieve 12% user retention.
App Monetization Methods By U.S. Publishers
(Reference: statista.com)
- As of September 2025, App Monetization patterns reveal a subtle but meaningful divergence between the United States and global markets.
- U.S. app stores showed 4% of applications using paid downloads, exceeding the 3% global average — indicating that upfront pricing remains a niche strategy.
- The monetisation methods of U.S. applications show that 25% use in-app advertising, while the worldwide standard is 27%.
- According to industry data published in September 2025, this shows that U.S. developers prefer hybrid revenue models, which include subscription services and in-app purchase options.
- The analyst perspective shows that App Monetization strategies now prioritize recurring revenue streams instead of generating income through advertisements and one-time purchases.
iOS Ad Hosting Leaders Highlight Scale
(Reference: statista.com)
- According to information published by Statista in November 2025, 2024 demonstrated that extensive advertising-driven systems controlled the Apple App Store.
- The global lead in advertising creative hosting belonged to BIGO Technology, which provided more than 500000 advertising materials to its users.
- Roadget Business followed with more than 89000 ads, while OktaFX apps carried approximately 82860 ads.
- The high volume of ad inventory demonstrates data-driven optimization, which proves that advertising functions as the primary App Monetization method within competitive iOS environments.
Android Ad Inventory Giants Signal Scale-First Monetization Models
(Reference: statista.com)
- The data published by Statista in November 2025 shows that Android publishers created more advertising content than iOS publishers during the 2024 period.
- The Google Play Store registers BIGO Technology as the top advertiser with 1.27 million ads, while Shopee counts more than 1.1 million ads, and Particle Media Inc. has more than 1.03 million ads.
- The distribution model, which generates high-volume distribution from its operations, demonstrates to analysts how business size increases App Monetization performance.
- Android platforms use extensive ad inventory to achieve high fill rates, which support their advertising operations through algorithmic optimization and multiple revenue streams.
Global App Retention Trends
- The global app retention trends show different performance results across various platforms and geographic areas.
- The recent app retention rate statistics show that users experience a sudden drop-off in app usage, which affects their ability to generate revenue through app monetization.
- Business of Apps and DesignRush report that iOS shows better user retention results than Android throughout both the short-term and mid-term periods.
- iOS users maintain 27% of their Day 1 usage, while Android users maintain 24% of their Day 1 usage.
- The Day 30 numbers show a sharp decline because iOS users drop to 3.7% while Android users decrease to 2.1%, which indicates a high decline in user activity.
- AppsFlyer research shows Japan leading Android Day 30 retention at 4.15%, which exceeds the United Kingdom’s 2.73% retention rate.
- The UK market shows a 3.22% retention rate, while the US market shows a 3.02% retention rate, which falls behind the retention rates of smaller European countries like Norway and Denmark.
- Users who participate in weekly activities demonstrate a 90% higher probability of becoming permanent users, which shows that developing initial behaviors transforms into a revenue-generating process.
- The average retention rate drops to 21% after 24 hours, which further decreases to 7.5% by Day 10 and reaches 1.89% after 90 days.
- App monetization requires ongoing user engagement, which builds through engagement engineering instead of depending on download numbers.
Mobile Video Advertising
- The latest Mobile Video Ads Statistics signal a decisive shift in digital economics, which establishes video as the primary method for App Monetization.
- According to projections from eMarketer, U.S. mobile ad spending will reach USD 228.92 billion in 2025, which will represent 66.4% of total ad spending and increase from the previous year when it stood at USD 202.59 billion.
- The growth demonstrates that smartphones have become the main entry point for advertisers to reach their target audience.
- The Global Banking & Finance Review reports that mobile video captured more than 75% of all mobile advertising expenditures by 2025 because of its superior ability to engage with viewers.
- Fact.MR predicts that the global mobile video optimization market will reach USD 1.44 billion by 2034 and experience a 7.2% compound annual growth rate.
- Wyzowl discovered that 93% of video marketers reported a positive ROI from video, and 95% of companies considered video marketing important in 2025.
- The proof shows that optimized video content has become essential for reaching scalable App Monetization and conversion-driven growth, according to analysts.
Social Media And Communication Apps
- Digital engagement now centers on social media and communication platforms, which will determine the future of App Monetization.
- According to industry estimates, over 5.24 billion ( in 2025) people use social media globally, with 90% accessing platforms via mobile apps, underscoring mobile-first consumption trends.
- The growth of short-form video content and live streaming platforms continues to expand, as TikTok reached approximately 1.9 billion monthly active users by early 2026, making it one of the most successful non-gaming applications.
- WhatsApp alone processes over 150 billion messages per day as of 2024, which shows that people use these apps extensively.
- Users spend an average of 2 hours and 20 minutes per day on social apps, which creates revenue opportunities through advertisement-based App Monetization strategies.
- Social applications generated more than USD 252.7 billion in global advertising revenue during 2024, which shows that these platforms use their size, user engagement, and data accuracy to achieve maximum sustainable App Monetization performance.
Mobile Commerce Apps
- Mobile shopping apps have established themselves as the main driver for worldwide eCommerce expansion, which now surpasses desktop usage.
- Industry data indicates that 72% of total eCommerce sales in 2024 were completed via mobile devices, which shows a fundamental change in consumer purchasing habits.
- The worldwide mobile shopping industry exceeded USD 2.51 trillion by 2025, which demonstrates its extensive capacity to handle financial transactions.
- Retail and marketplace applications display rising user interaction because they experienced a 22% growth in user engagement duration, which occurs every year.
- Performance metrics further highlight monetization efficiency: in-app checkout conversion rates are three times higher than mobile web, which results in personalized product recommendations generating up to 35% revenue growth through in-app sales.
- Retailers who use applications to reach customers show 2x better customer retention results than businesses that depend only on their websites.
- Mobile applications have become essential for every business because they enable businesses to implement App Monetization methods, which depend on customer retention.
Mobile Gaming and In-App Advertising
- The mobile ecosystem divides itself into two separate categories, which include utility applications and high-yield gaming platforms that show their growth through both major platforms.
- Earlier 42matters datasets suggested 3.4+ million combined apps and games, but after stricter moderation and removals, the active app count has been revised to about 1.58 million to 2+ million as of late 2025 and early 2026.
- The gaming industry generates greater revenue than its total number of games because of its higher income from fewer titles.
- Mobile games achieve USD 16.50 ARPU for each paying customer while they produce about USD 15 annual revenue per user, which exceeds the USD 3 generated by non-gaming applications.
- Honor of Kings achieved USD 1.86 billion in in-app purchase revenue at Business of Apps, which shows that in-game transactions dominate App Monetization models.
- User growth maintains its strong momentum. Adapty projects mobile gamers will rise 8% to 137 million by 2027, with ARPU climbing from USD 57.64 to USD 64.26. In-app advertising experiences rapid growth at present.
- Statista predicts that the global market will reach USD 390.04 billion by 2025, which will experience an 8.17% CAGR expansion to USD 533.92 billion by 2029, and U.S. spending will total USD 147.52 billion.
Subscription App Revenue Models
- The subscription economy has expanded 435% over the past decade, and according to ERP Today, it is projected to reach USD 1.5 trillion by 2025.
- App Monetization undergoes a structural shift from one-time licensing to recurring billing, which establishes stable revenue streams as better revenue systems than Unpredictable income streams.
- Consumer behavior, however, reveals friction.
- Research from Subscription Service Statistics and Costs shows the average user spends USD 219 per month on subscriptions—2.5 times higher than they estimate—while 42% pay for services they no longer use, exposing inefficiencies but also revenue stickiness.
- Statista reports that 97% of Google Play apps were free as of January 2025, reinforcing in-app upgrades as the core App Monetization gateway.
- Data from 42matters shows Google Play hosts 1.96 million free apps versus 61,985 paid, while the Apple App Store lists 1.84 million free and 89,048 paid apps.
- DesignRush finds annual plans retain 28% of users after one year, compared to 12% for monthly and 3.5% for weekly subscriptions.
- Additionally, TyrAds notes well-optimized subscriptions can deliver up to 50% higher lifetime value.
Conclusion
App Monetization Statistics: By 2025, app monetization had matured into a highly sophisticated economic engine, responsible for hundreds of billions in annual revenue worldwide. With ads commanding the largest share, followed by in-app purchases and subscriptions, developers have a wealth of ways to turn engagement into earnings. Strategic hybrid monetization, understanding platform nuances (like iOS vs. Android), and region-specific trends all play a role in maximizing value. But it’s not just about big numbers.
The true winners are developers who seamlessly blend monetization with high-quality user experience — retaining users while intelligently exposing them to revenue opportunities. With the global app market projected to continue expanding well beyond 2025, app monetization remains one of the most exciting frontiers in the digital economy.
FAQ.
A 1000-download app generates monthly earnings between USD 10 and USD 50 based on how users interact with it and its chosen monetization methods.
Total revenue is expected to show an annual growth rate (CAGR 2022-2029) of 7.48%, resulting in a projected market volume of USUSD 781.70bn by 2029. (Statista)
Investors should focus on gaming applications because these apps show the highest profit potential, with their revenue stream reaching USD 64.26 per user by 2027. (Adapty)
Mobile video advertising will dominate app monetization because it will make up more than 75% of total mobile advertising expenditures by 2025.
Subscription models establish sustainable app monetization growth because they help businesses retain 28% of annual plan customers who stay beyond their first year, but only 12% of monthly plan customers who stay beyond their first year.

Tajammul Pangarkar is the co-founder of a PR firm and the Chief Technology Officer at Prudour Research Firm. With a Bachelor of Engineering in Information Technology from Shivaji University, Tajammul brings over ten years of expertise in digital marketing to his roles. He excels at gathering and analyzing data, producing detailed statistics on various trending topics that help shape industry perspectives. Tajammul's deep-seated experience in mobile technology and industry research often shines through in his insightful analyses. He is keen on decoding tech trends, examining mobile applications, and enhancing general tech awareness. His writings frequently appear in numerous industry-specific magazines and forums, where he shares his knowledge and insights. When he's not immersed in technology, Tajammul enjoys playing table tennis. This hobby provides him with a refreshing break and allows him to engage in something he loves outside of his professional life. Whether he's analyzing data or serving a fast ball, Tajammul demonstrates dedication and passion in every endeavor.