Augmented Reality Statistics By Market, Advertising, Users, Software, Hardware And Trends
Updated · Oct 13, 2025


Table of Contents
- Introduction
- Editor’s Choice
- Augmented Reality Market Statistics
- Augmented Reality Advertising Statistics
- Augmented Reality Software Statistics
- Augmented Reality Hardware Statistics
- Augmented Reality Users Statistics
- Augmented Reality Market Share Statistics by Region
- By Industry
- Augmented Reality Mobile Market Statistics
- Popular Uses of Augmented Reality Statistics
- Augmented Reality Shopping Uses Statistics by Generation
- Augmented Reality Market Statistics by Agriculture
- By Healthcare
- By AR Glasses
- By AR Headset
- By Retail Market
- By Application
- Reasons for Using Augmented Reality Statistics
- Conclusion
Introduction
Augmented Reality Statistics: Augmented Reality (AR), also known as Mixed Reality (MR), is a rapidly growing technology that mixes the digital world with the real one. People can use smartphones or special headsets to see AR in action. It works by adding extra things like pictures, animations, or sounds to what you see around you.
AR is now involved in every segment, starting from gaming, education, shopping, and healthcare. They primarily allow for changing the way of interaction in both the digital and physical worlds. Currently, AI is playing a crucial role due to its advanced and widely used processes, and it is also expected to grow with higher responsibilities in the coming years.
This article has covered all the information and data analysis from different insights that will guide in providing a clear understanding of the market.
Editor’s Choice
- According to Precedence Research reports, by 2025, the global market size of augmented reality (AR) will reach around USD 149.57 billion.
- In 2024, North America made over 36% of the total revenue from the AR market.
- In terms of components, software made up more than 61% of the total revenue in 2024.
- Statista report also depicts that the global AR hardware market is estimated to earn USD 8.6 billion in 2025.
- According to a report published by Emerline, more than 2 billion people will be using mobile Augmented Reality globally by the end of 2025.
- As per the scoop.market.us report of 2025, electronics leads the industry with a 32.0% share in overall revenue, followed by services at 12.9% and manufacturing at 10.3%.
- Exploding Topic further shows that the mobile AR market revenue accounted for USD 25.84 billion in 2024, with a growth rate of 22.64% (+USD 4.77 billion).
- A report published by insightaceanalytic.com, the Augmented Reality in Agriculture market is valued at USD 1.44 billion in 2024.
- The Strait Research report further stated that in 2024, the global augmented reality (AR) in healthcare market was valued at USD 2.01 billion.
- The Cons and Insights report shows that the market valuation of Augmented Reality in the retail industry by 2025 will account for USD 29.92 billion.
Augmented Reality Market Statistics
 (Reference: precedenceresearch.com)
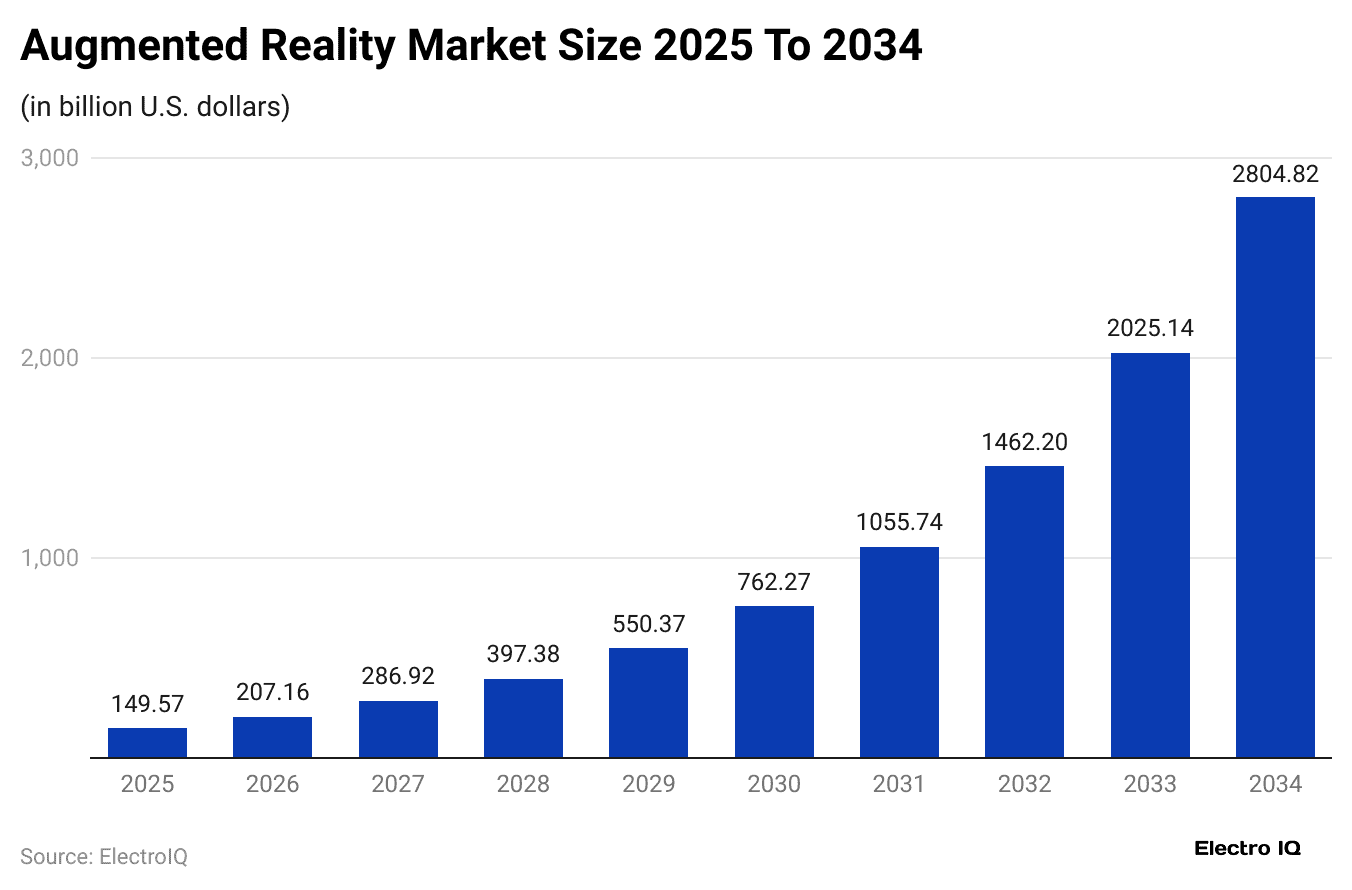
- The above graphical representation states that by 2025, the global market size of augmented reality (AR) will reach around USD 149.57 billion.
- This market is supposed to be around USD 207.16 billion by the end of 2026, followed by USD 286.92 billion (2027), 2028 (USD 397.38 billion), 2029 (USD 550.37 billion), 2030 (USD 762.27 billion), 2031 (USD 1,055.74 billion), 2032 (USD 1,462.20 billion), 2033 (USD 2,025.14 billion), and 2034 (USD 2,804.82 billion).
- The compound annual growth rate of 38.5% between 2024 and 2034.
In the United States
 (Reference: precedenceresearch.com)
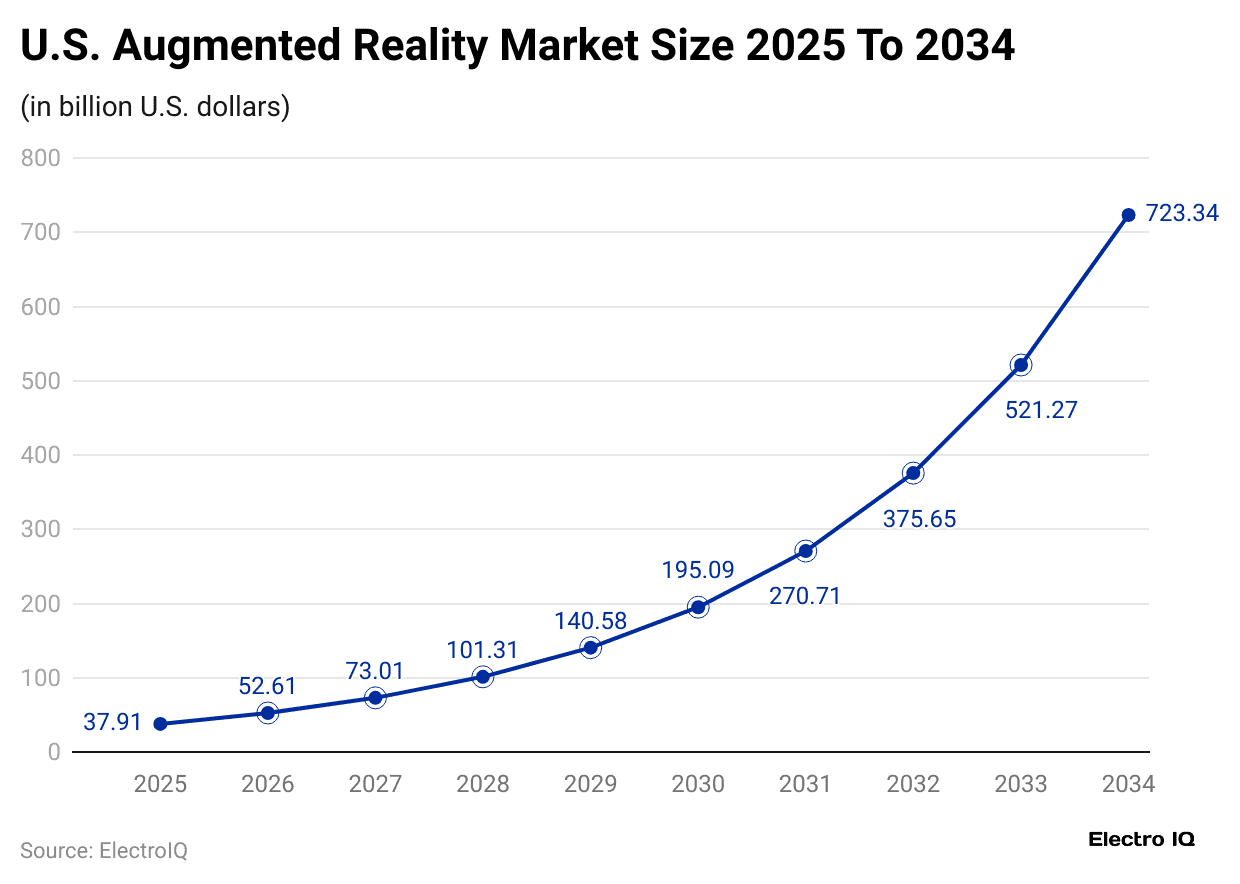
- As of 2025, the U.S. augmented reality market will reach USD 37.91 billion.
- It is expected to grow quickly and reach nearly USD 723.34 billion by the end of 2034, with a growth rate of 38.8% CAGR between 2025 and 2034.
Augmented Reality Advertising Statistics
- A Statista report further states that the market revenue of AR Advertising is estimated to reach around USD 5.8 billion by 2025, with a change rate of 13% from last year.
- The market is expected to grow at a rate of approximately 8.35% annually from 2025 to 2029, reaching a total value of around USD 8.0 billion by 2029.
- The United States accounted for the highest revenue, resulting in USD 1.4 billion, in 2025.
Augmented Reality Software Statistics
- The global Augmented Reality software market revenue is expected to reach USD 14 billion by 2025, as per Statista insights.
- This market is supposed to grow at a CAGR of 6.44% from 2025 to 2029, reaching USD 18 billion by the end of 2029.
- As of 2025, the United States is expected to lead the market, resulting in USD 4.3 billion in revenue.
- By 2029, AR software users are expected to reach 3.7 billion, with each user generating approximately USD 4 in global revenue.
- In 2025, about 54.1% of the global population is expected to use AR software, and this share may increase to 56.5% by 2029.
Augmented Reality Hardware Statistics
- Statista report also depicts that the global AR hardware market is estimated to earn USD 8.6 billion in 2025 and will grow to USD 11.7 billion by the end of 2029.
- The global market will grow at a CAGR of 13% from 2025 to 2029.
- As of 2025, the U.S. Augmented Reality Hardware market will lead with USD 3.1 billion in revenue.
- Globally, the average revenue is USD 117.3 per user.
- By 2029, the AR hardware market will reach almost 143.5 million users, and will reach 2.2%.
Augmented Reality Users Statistics
- According to a report published by Emerline, globally, more than 2 billion people will be using mobile Augmented Reality by the end of 2025, up from 1.7 billion in 2024.
- In the U.S., users will reach 100.1 million in 2025, followed by 103.9 million (2026), and 106.9 million (2027).
- By 2025, about 35% to 40% of the U.S. internet users (nearly 60% of the population) are expected to use AR often.
- Globally, 75% of people may use AR, and over 300 million use Snapchat’s AR lenses every day.
- The exploding report further shows that about 40% of people say they would spend more on a product if they could try it first using AR.
- Around 70% to 75% of people aged 16 to 44 know about AR.
- In comparison, 56% of those aged 45 to 54 are aware of it, while only 44% of people aged 55 to 64 have heard of AR.
- Augmented Reality Statistics also show that only 30% of Americans use AR, with 10% using it less than monthly.
- The remaining 20% are evenly split across monthly, weekly, several weekly, and daily usage.
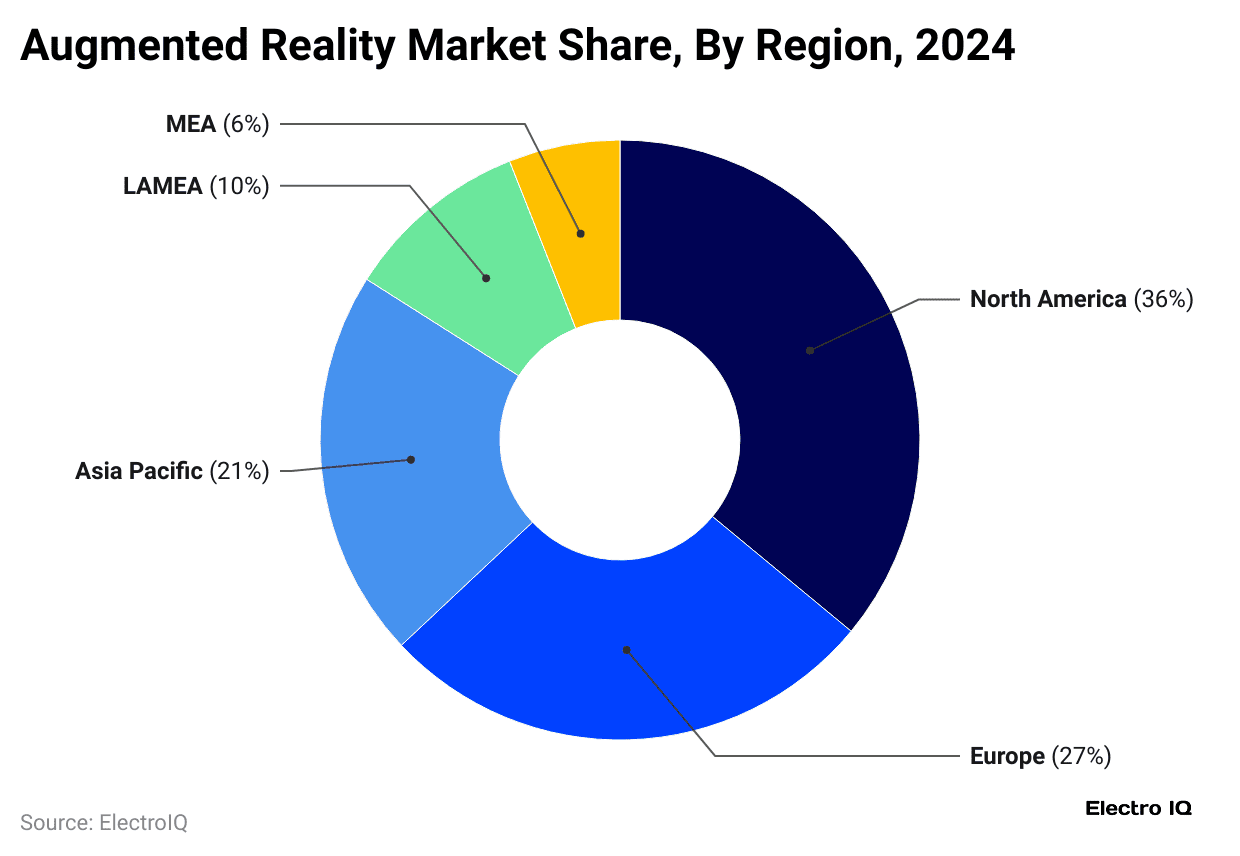
- In 2024, the North American region accounted for the highest AR market, with a share of 36%, while Europe secured a market share of 27%.
- Meanwhile, other regions’ AR market share is followed by Asia Pacific (22%), LAMEA (10%), and MEA (6%).
By Industry
 (Reference: market.us)
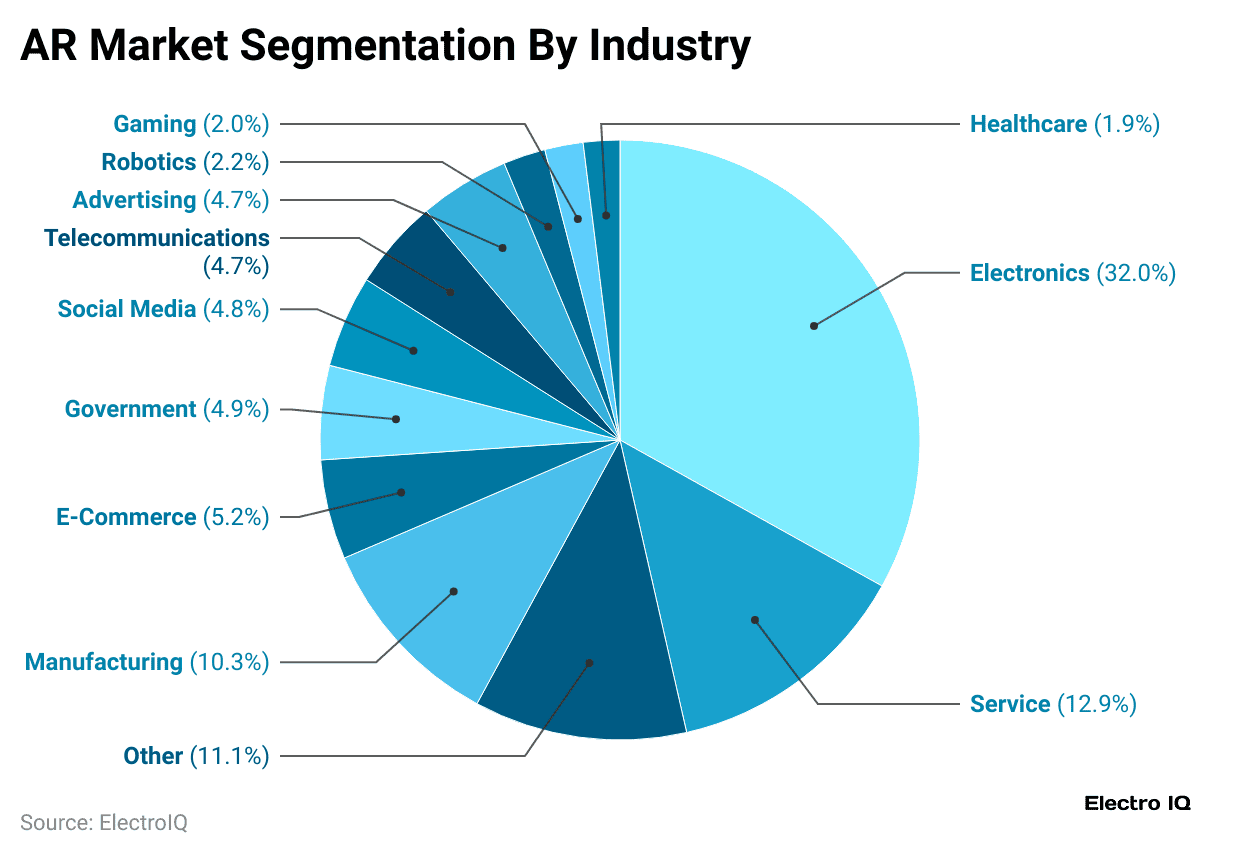
- As of 2025, electronics leads the industry with a 32.0% share in overall revenue, followed by services at 12.9% and manufacturing at 10.3%.
- E-commerce (5.2%), government (4.9%), and social media (4.8%) also contribute significantly.
- Telecommunications and advertising each hold 4.7%.
- Meanwhile, robotics and gaming account for 2.2% and 2.0%, respectively, and healthcare makes up 1.9%.
- The remaining other industries will account for a revenue share of 11.1%.
Augmented Reality Mobile Market Statistics
 (Reference: buttercms.com)
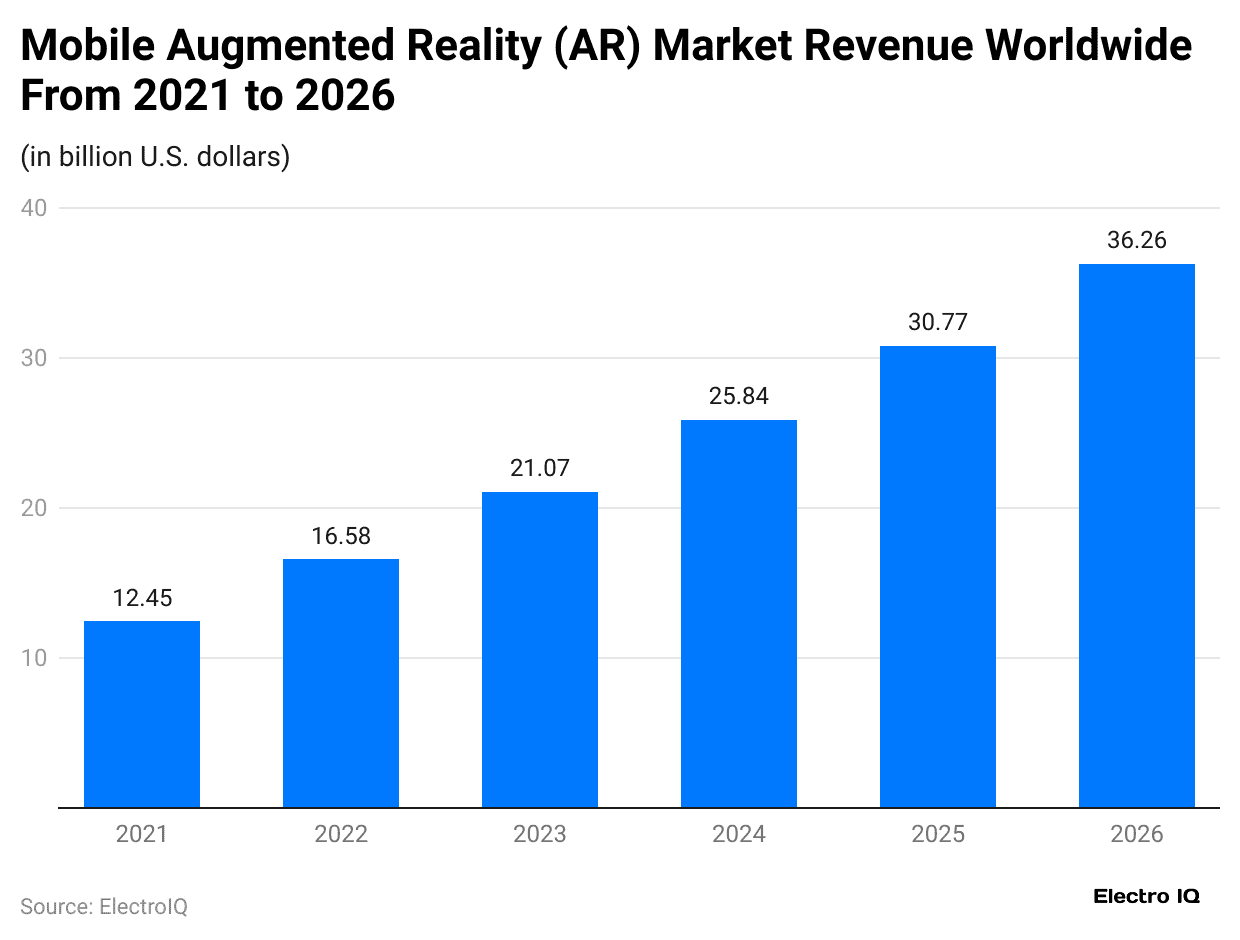
- The above graph shows that the mobile AR market revenue accounted for USD 25.84 billion in 2024, with a growth rate of 22.64% (+USD 4.77 billion).
Furthermore, the estimated market revenue in the coming years is mentioned below:
| Year | Revenue (USD billion) | Increase over the previous year (USD billion) | Growth Rate |
| 2025 | 30.77 | 4.93 |
+19.08% |
|
2026 |
36.26 | 5.49 | +17.84% |
| 2027 | 39.81 | 3.55 |
+9.79% |
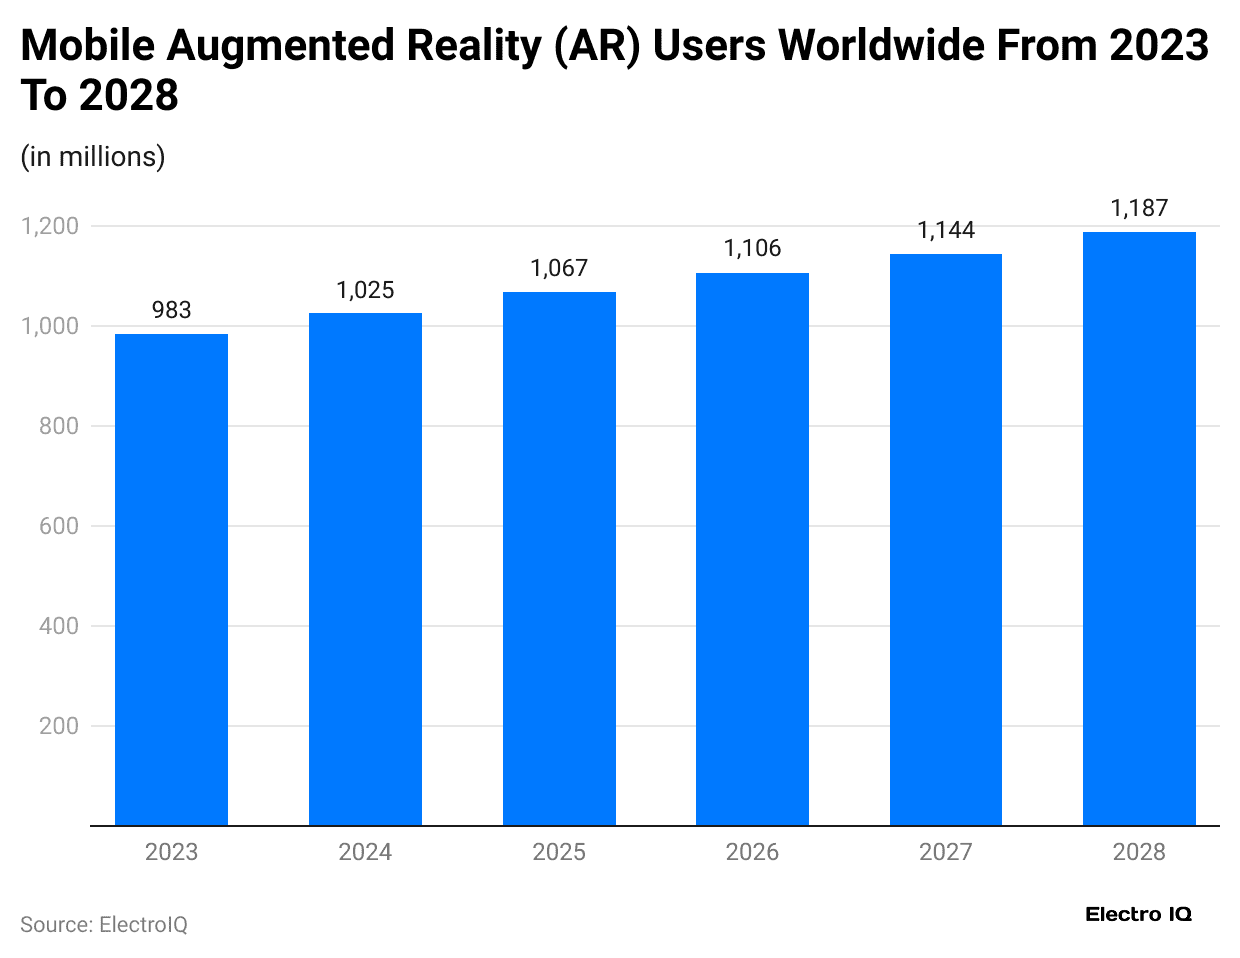
- The above graph also reports that in 2024, mobile augmented reality users resulted in 1,025, and is estimated to reach up to 1,067 users by the end of 2025
- Moreover, in the coming years, total users of mobile augmented reality are expected to reach 2026 (1,106), 2027 (1,144), and 2028 (1,187).
Popular Uses of Augmented Reality Statistics
- According to Exploding Topics, about 32% of Americans (nearly 1 in 3 people) said they were interested in playing video games using augmented reality in 2024.
- Furthermore, other AR use cases by Americans are followed by travel/driving (12%), music (11%), immersive environments (11%), history (10%), training/education (9%), watching movies/TV (9%), and imaginary environments (7%).
Augmented Reality Shopping Uses Statistics by Generation
| Use Cases | Gen Z | Millennials | Gen X | Boomers | Silent |
| Furniture or decor | 94% | 92% | 87% | 75% | 64% |
| Paint color | 91% | 91% | 85% | 73% | 58% |
| Makeup or hair colour | 90% | 87% | 82% | 60% | 62% |
| Clothes, shoes, and accessories | 92% | 90% | 84% | 65% | 57% |
Augmented Reality Market Statistics by Agriculture
- A report published by insightaceanalytic.com, the Augmented Reality in Agriculture market is valued at USD 1.44 billion in 2024 and projected to reach around USD 25.33 billion by 2034.
- The market will grow at a 33.4% CAGR from 2025 to 2034.
The regional AR agriculture market size is stated in the table below:
| Region | Market Size (USD) | Market Share |
| North America | 220,000 | 33.3% |
| Europe | 190,000 | 28.8% |
| Asia-Pacific and Japan | 110,000 | 16.7% |
| China | 50,000 | 7.6% |
| UK | 40,000 | 6% |
| Rest of World | 50,000 | 7.6% |
By Healthcare
- The Strait Research report further stated that in 2024, the global augmented reality (AR) in healthcare market was valued at USD 2.01 billion.
- The market is projected to grow from USD 2.54 billion in 2025 to USD 16.44 billion by 2033.
- The growth rate of the global market will grow at a CAGR of 26.3% from 2025 to 2033.
By AR Glasses
 (Reference: buttercms.com)
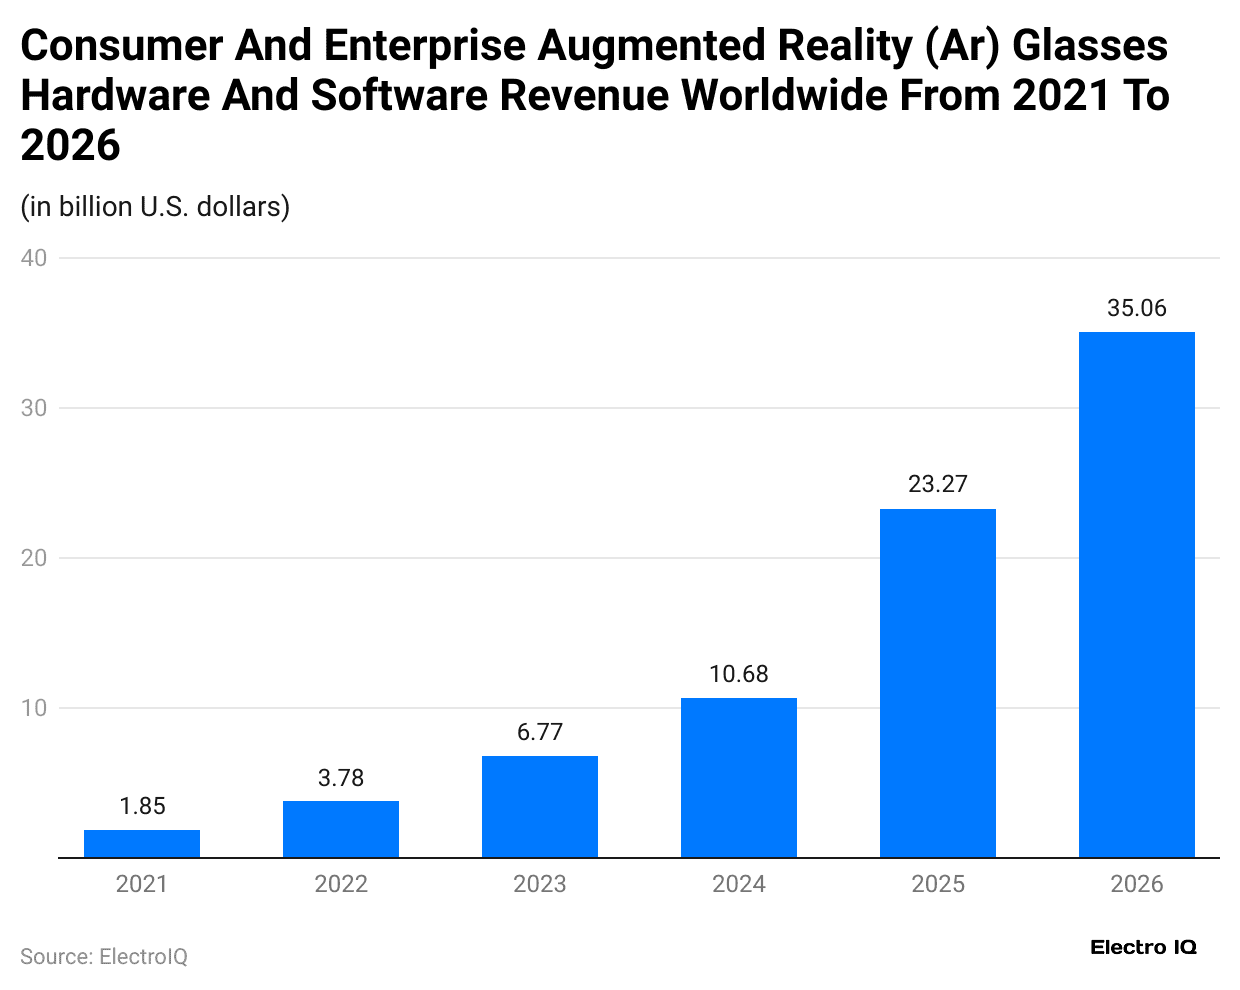
- AR glasses revenue is expected to grow more than 5 times between 2023 and 2026.
| Year | Revenue (USD billion) | Increase from last Year (USD billion) | Growth Rate |
| 2023 | 6.77 | +2.99 | +79.1% |
| 2024 | 10.68 | +3.91 | +57.8% |
| 2025 | 23.27 | +12.59 | +117.9% |
| 2026 | 35.06 | +11.79 | +50.7% |
- VR glasses can weigh between 76 grams and over 550 grams, depending on design, features, and built-in hardware components.
- The most expensive AR glasses in 2024 are Apple Vision Pro (USD 3,499), Microsoft HoloLens 2 (USD 3,500), and Meta Orion (USD 10,000).
By AR Headset
- Emergen Research reports that in 2024, the augmented reality (AR) headset market was worth around USD 8.9 billion.
- It is expected to grow fast and reach nearly USD 45.7 billion by 2034.
- The global market will grow at a CAGR of 20.1% from 2024 to 2034.
- According to the HDIN Research report, the global VR headset shipments reached 7.57 million units in 2024.
As of 2025, regional VR/AR headset market shares are mentioned below:
| Region | Market Share |
| Asia Pacific | 27% to 32% |
| North America | 24% to 29% |
| Europe | 22% to 27% |
| South America | 20% to 25% |
| The Middle East and Africa | 18% to 23% |
The table below elaborates on the AR headset shipments Statistics:
| Year | AR Units Shipped (million) | Consumer (million) | Commercial (million) | Growth rate from last year |
| 2024 | 29.33 | 21.13 | 8.2 | +25.34% |
| 2025 | 39.07 | 25.31 | 13.76 | +33.21% |
| 2026 | 50.46 | 30.88 | 19.58 | +29.15% |
By Retail Market
 (Reference: consainsights.com)
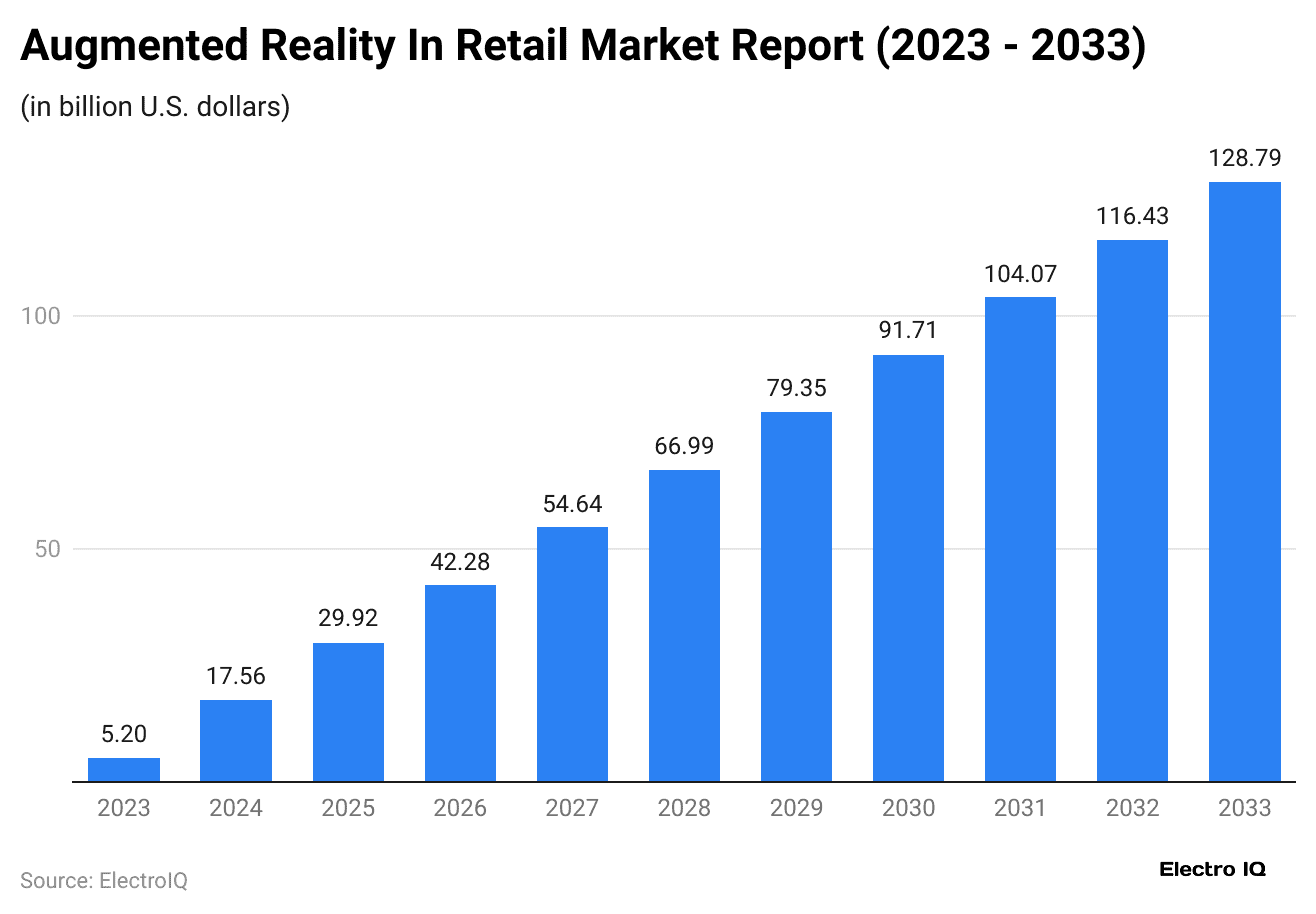
- As of 2024, the market valuation of Augmented Reality in the retail industry has accounted for USD 17.56 billion, and is estimated to reach USD 29.92 billion by the end of 2025.
- The market will grow at a CAGR of 35% from 2023 to 2033, resulting in USD 129.79 billion.
The market analysis of retail market statistics by technology is mentioned in the table below:
| Technology | 2024 (USD billion) | 2030 (USD billion) |
| Marker-Based AR | 11.03 | 80.92 |
| Markerless AR | 4.82 | 35.33 |
| Superimposition-Based AR | 1.71 | 12.54 |
By Application
| Application | 2024 (USD billion) | 2030 (USD billion) |
| Virtual Try-On | 10.6 | 73.81 |
| Store Navigation | 3.62 | 26.57 |
| Product Customization | 2.10 | 15.40 |
| Interactive Display | 1.77 | 13.01 |
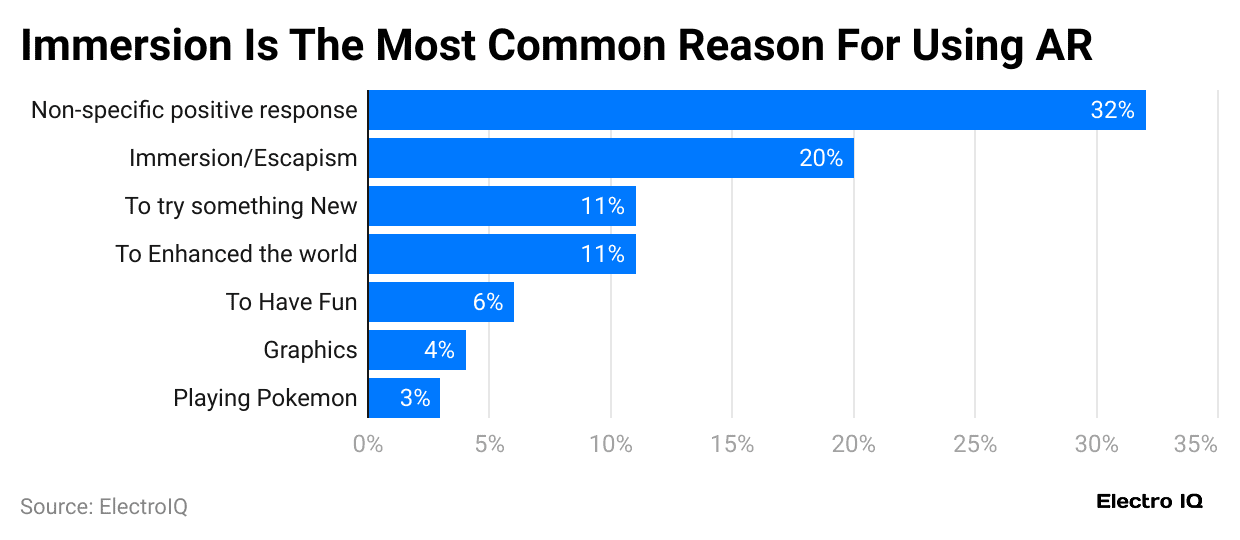
Reasons for Using Augmented Reality Statistics
 (Reference: buttercms.com)
- As of 2025, a recent study in the U.S. showed that 32% of Augmented Reality users enjoy it without a clear reason.
- Meanwhile, only 20% claimed that they use AR mainly for immersion and escapism.
- In contrast, other reasons for using AR by respondents are stated as trying something new (11%), enhancing the world (11%), having fun (6%), graphics (4%), and playing Pokémon (3%).
Conclusion
After finishing the article on Augmented Reality statistics, it’s clear that AR is quickly changing how people around the world connect with both the digital and real world. It helps improve many areas like retail, healthcare, education, gaming, and manufacturing by making work more efficient, helping users make better choices, and keeping them engaged.
AR shows real-time visuals, adds a personal feel, and keeps users interested. Overall, AR has a bright future and is set to impact how people and businesses interact globally strongly.
Sources
FAQ.
The main functions of AR are tracking invoice payments, managing collections, cash applications, deductions, and credit risk.
The major limitations are high costs, privacy concerns, limited content, device dependency, technical glitches, and user discomfort during prolonged use.
Commonly used devices in AR are smartphones, tablets, smart glasses, headsets, and AR-enabled contact lenses.
Languages used by AR are C#, C++, Java, Python, and Swift.
Software used by AR is Unity, Vuforia, ARKit, ARCore, ZapWorks, Wikitude, and Spark AR.

Maitrayee Dey has a background in Electrical Engineering and has worked in various technical roles before transitioning to writing. Specializing in technology and Artificial Intelligence, she has served as an Academic Research Analyst and Freelance Writer, particularly focusing on education and healthcare in Australia. Maitrayee's lifelong passions for writing and painting led her to pursue a full-time writing career. She is also the creator of a cooking YouTube channel, where she shares her culinary adventures. At Smartphone Thoughts, Maitrayee brings her expertise in technology to provide in-depth smartphone reviews and app-related statistics, making complex topics easy to understand for all readers.