Digital Wallet Statistics By User, Demographics, Region, Transaction, Usage And Trends (2025)
Updated · Sep 25, 2025

Table of Contents
- Introduction
- Editor’s Choice
- General Digital Wallet Statistics
- Digital Wallet User Statistics
- By Frequency, 2024
- Digital Wallet Adoption in E-commerce by Age and Gender
- Digital Wallet Usage Statistics by Demographics
- Digital Wallet Transaction Statistics
- Digital Wallet Adoption Statistics by Country
- Digital Wallet Penetration Statistics by Region
- Digital Wallet Usage Statistics by Category
- Digital Wallet Usage Statistics by Platform
- Top Digital Wallet Apps Statistics by Monthly Active Users in Countries
- Pros and Cons of Digital Wallet
- Technological Innovations and Trends of Digital Wallets in 2025
- Conclusion
Introduction
Digital Wallet Statistics: A digital wallet, often called an e-wallet or mobile wallet, is a software, online service, or electronic tool that lets people make digital transactions by using digital money to pay for goods and services. Their use has grown quickly worldwide in recent years, driven by e-commerce, tap-and-go payments, and mobile banking. As cash and even physical cards are used less often, digital wallets are becoming central to the move toward a cashless economy.
The Digital Wallet Statistics below show their growth, market trends, and the reasons behind this shift in 2025 and the years ahead.
Editor’s Choice
- According to thefinancialbrand.com 2024, digital payments became the main method for online shopping, making up 66% of transactions, while cash and card payments dropped to 34%.
- As of 2024, there were 4.3 billion digital wallet users in the world, or 52.9% of the global population.
- As per Paysafe’s 2024 global consumer survey of 14,500 people conducted between May and June, about 32% indicated that they were turning to digital wallets more often for online purchases.
- About 78.9% of Gen Z use digital wallets regularly, making them the biggest users.
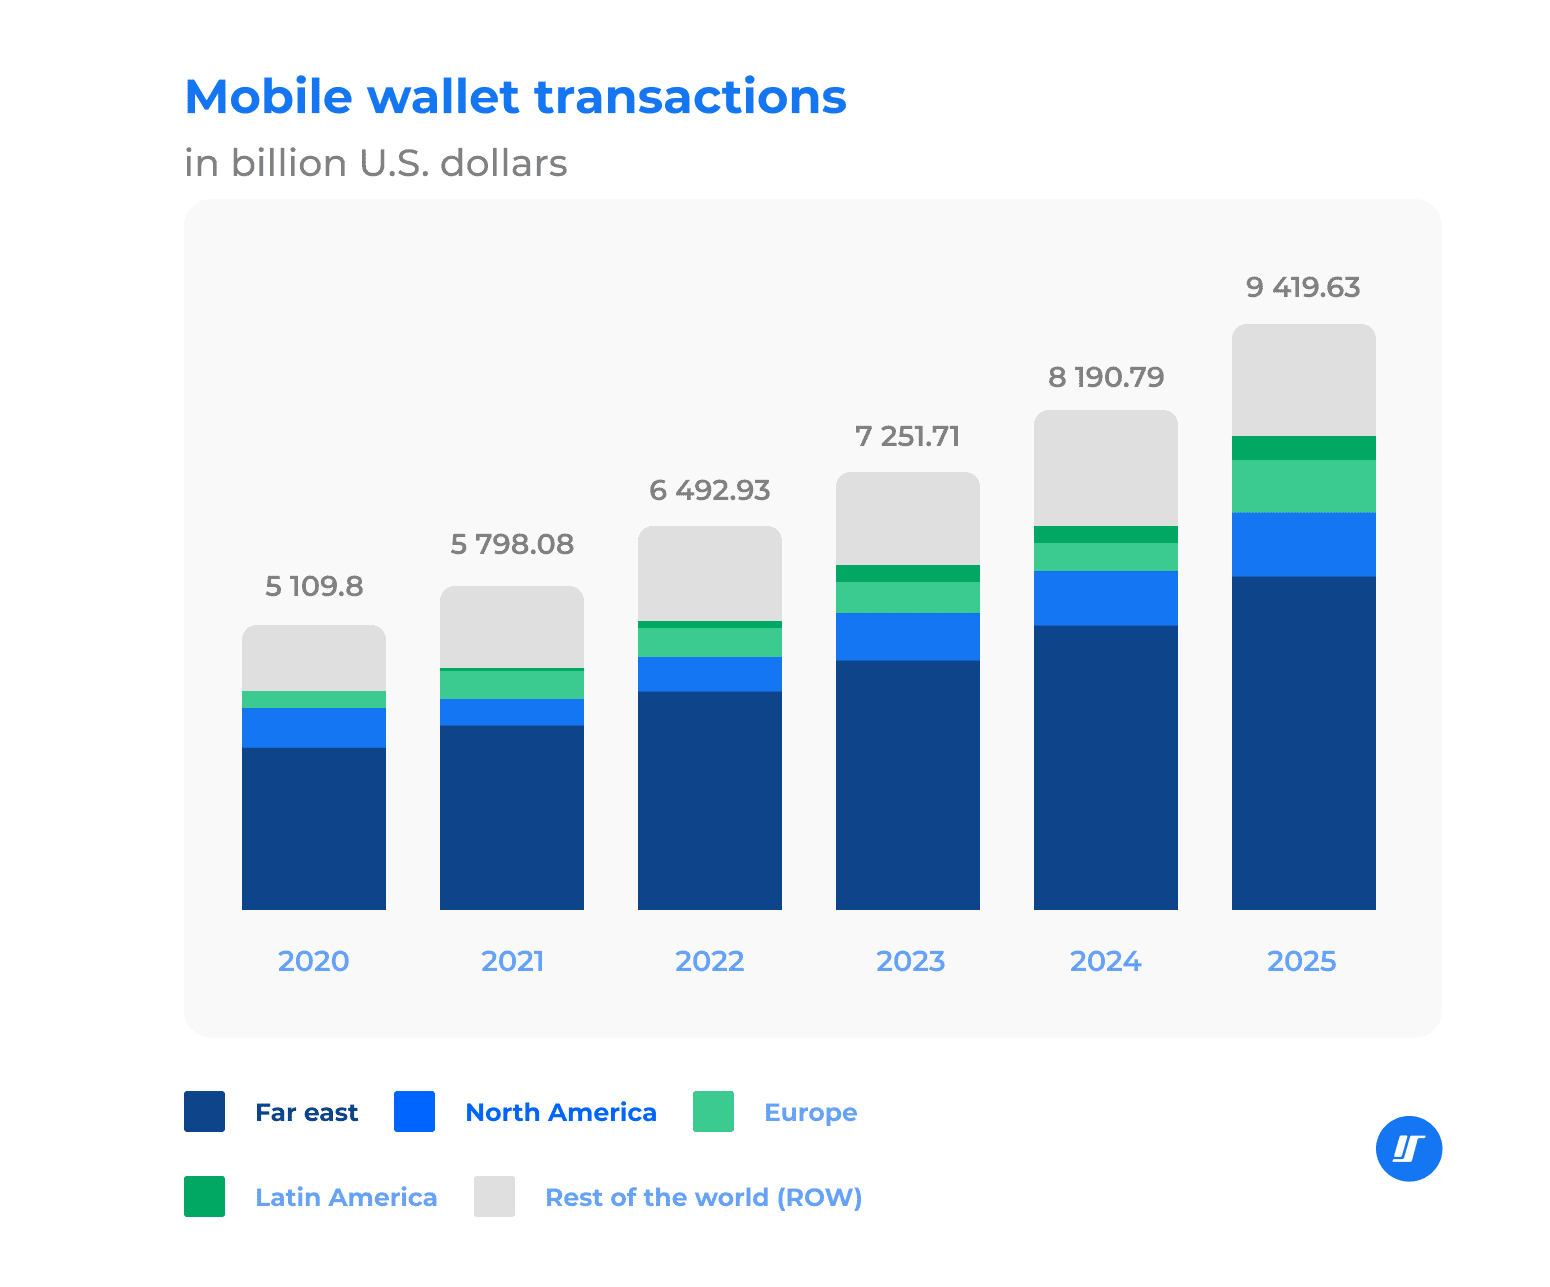
- In 2024, people around the world used digital wallets for transactions worth USD 8,190.79 billion, and it is estimated to reach approximately USD 9,419.63 billion by 2025.
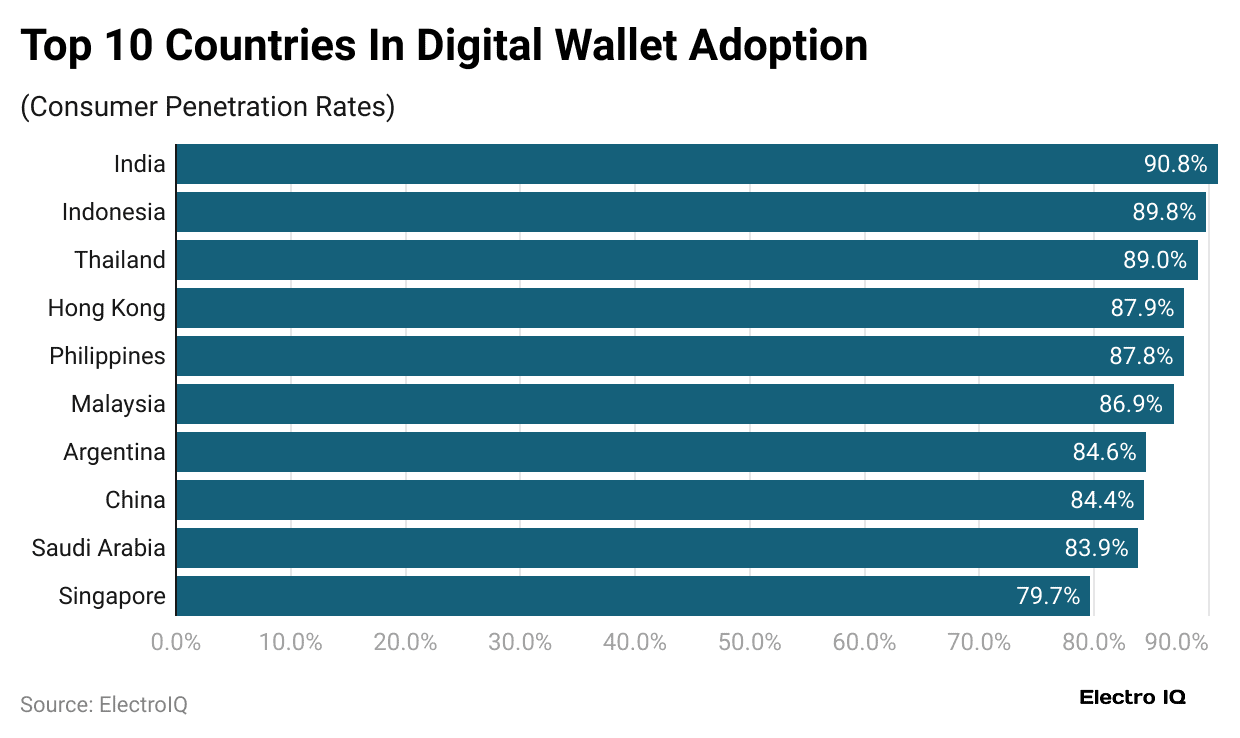
- India accounted for the highest position in digital wallet adoption with a consumer penetration rate of 90.8%, followed by Indonesia at 89.8%, and Thailand at 89%.
- According to Capital One Shopping Research, further shows that in North America in 2024, 41% of all POS payments were made with credit cards, 156% more than the 16% made with digital wallets.
- Survey data on digital wallet spending in 2024 shows that 66% of consumers reported higher use for groceries, followed by 57% for utilities and 52% for rent.
- In the same period, almost 61.3 million iPhone users in the U.S. were using Apple Pay daily.
General Digital Wallet Statistics
 (Source: thefinancialbrand.com)
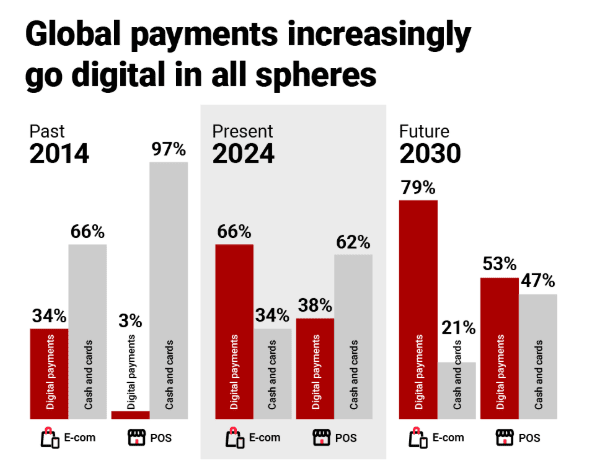
- As of 2024, most online shopping was done through digital payments, accounting for 66% of transactions globally, while cash and card payments made up only 34%.
- Looking ahead to 2030, digital payments are expected to grow to 79% of all transactions, leaving just 21% for cash and cards.
- In the United States, 2024 shows a 50-50 split between digital and traditional payments.
- By 2030, digital payments in the U.S. are projected to rise to 65%, slightly below the global average but still showing strong growth.
Digital Wallet User Statistics
- A capitaloneshopping.com report also stated that in 2024, there were 4.3 billion digital wallet users in the world, or 52.9% of the global population.
- By 2029, the number of global digital wallet users is expected to grow by 35% to reach 5.8 billion, or over 68% of the global population.
- 8 million or 44.9% of U.S. smartphone owners used proximity mobile payments in 2024.
- By 2028, 132.6 million Americans, or 50.2% of smartphone users, are expected to use digital payment platforms.
 (Reference: imagedelivery.net)
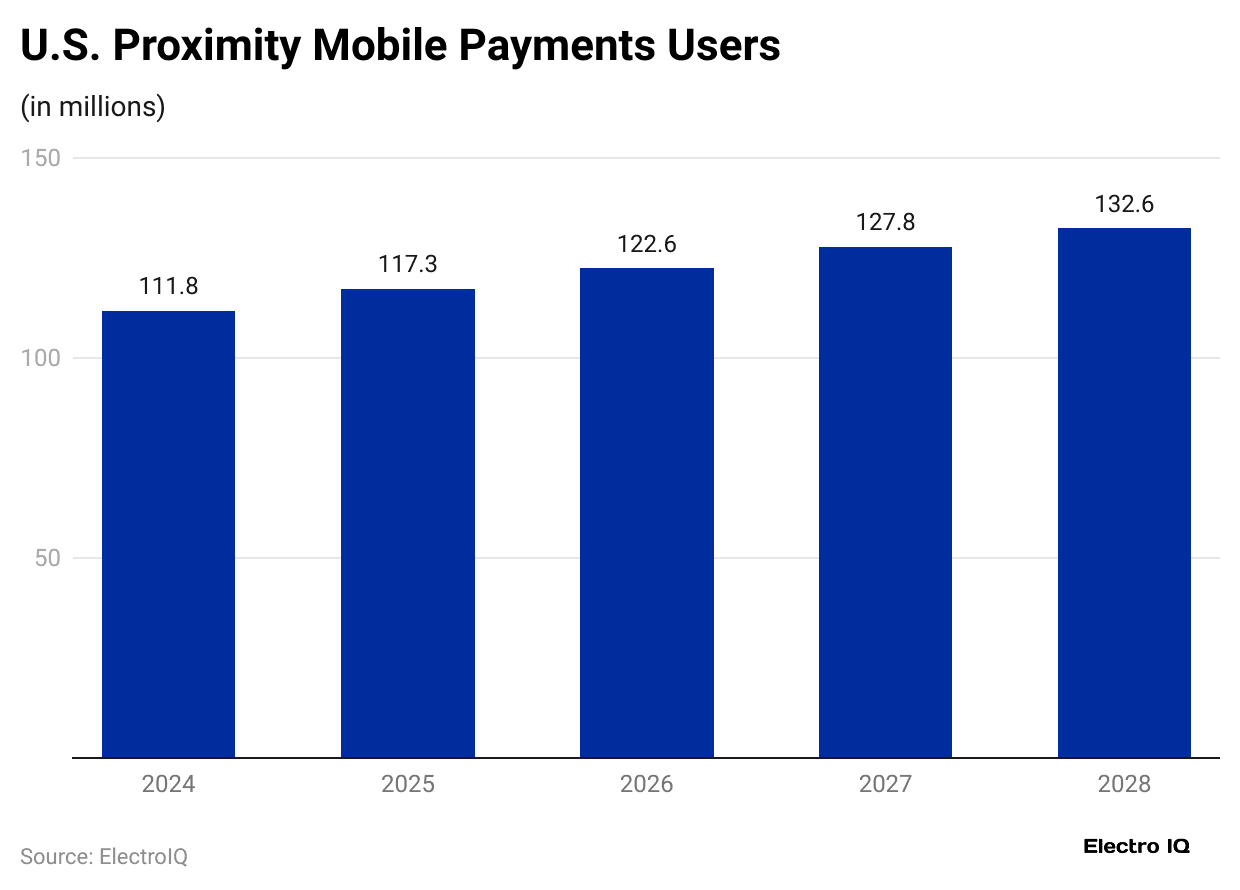
- In 2024, the United States had about 111.8 million people using proximity mobile payments.
- This number is expected to rise to 117.3 million in 2025, followed by 122.6 million in 2026.
- By 2027, the user count may reach 127.8 million, and by 2028, it could grow further to 132.6 million.
By Frequency, 2024
| Metrics | Several times a day | About once a day | A few times a week | About once a week | About once a month or less |
| Cash App | 21% | 12% | 20% | 14% |
33% |
| 17% | 12% | 22% | 15% | 34% | |
| Google Pay | 14% | 12% | 18% | 15% |
41% |
| 12% | 10% | 20% | 18% | 40% | |
| Venmo | 9% | 8% | 16% | 17% |
50% |
|
Zelle |
8% | 8% | 15% | 16% |
53% |
Digital Wallet Adoption in E-commerce by Age and Gender
- According to Paysafe’s 2024 global consumer survey of 14,500 people conducted between May and June, about 32% indicated that they were turning to digital wallets more often for online purchases.
- Meanwhile, roughly 34% of those aged 18 to 27 use wallets for e-commerce compared with around 21% among people aged 60 to 78.
- Younger consumers, particularly those between 18 and 43, are driving the fastest adoption.
- Complementing this, The Financial Brand reported that about 66% of Gen Z had used a wallet in the past 90 days.
- At the transaction level, Worldpay’s analysis placed wallet use at 39% of e-commerce payments in 2024, while other sources estimated 50% to 53%.
Digital Wallet Usage Statistics by Demographics
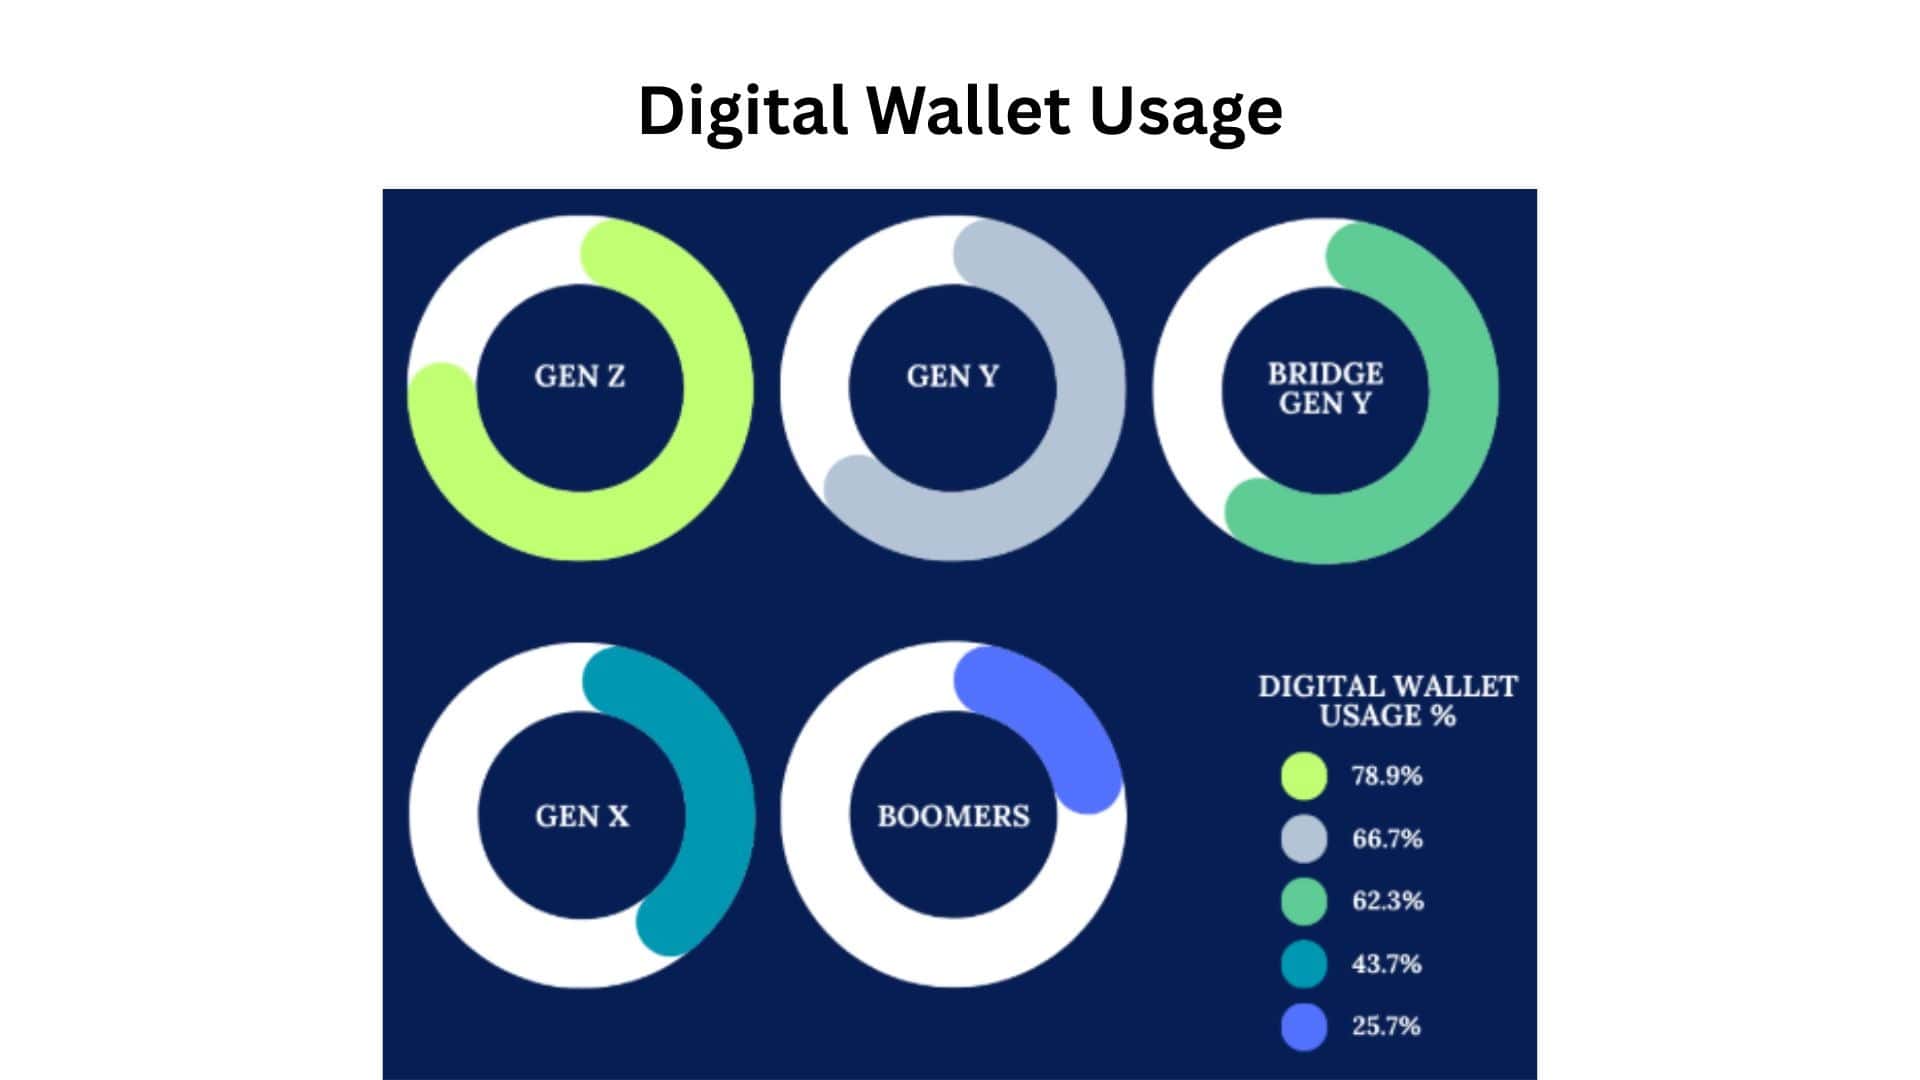
- About 78.9% of Gen Z use digital wallets regularly, making them the biggest users.
- Among Millennials, around 66.7% rely on this payment option.
- The group often called Bridge Millennials (between Millennials and Gen X) also shows strong interest, with 62.3% using digital wallets.
- For Gen X, usage is lower, at about 43.7%, though many value the safety and ease it provides.
- Baby Boomers remain the least likely to adopt this technology, with only 25.7% using digital wallets.
Digital Wallet Transaction Statistics
 (Source: nitrocdn.com)
- In 2024, people around the world used digital wallets for transactions worth USD 8,190.79 billion, and it is estimated to reach approximately USD 9,419.63 billion by 2025.
- Mobile payments using QR codes are projected to reach USD 5.4 trillion in 2025 and could increase by 48% to over USD 8 trillion.
- QR code payments are likely the most common type of digital wallet transaction globally, making up 48.6% of all transactions by volume.
- On average, credit card users spend 2.8% more than digital wallet users, while digital wallet users spend 12.8% more than debit card users and 51.1% more than those using cash.
- In the U.S., each mobile payment user spent an average of USD 3,693 in 2024.
Digital Wallet Adoption Statistics by Country
 (Reference: imagedelivery.net)
- As of 2024, India accounted for the highest position in digital wallet adoption with a consumer penetration rate of 90.8%, followed by Indonesia at 89.8%, and Thailand at 89%.
- Furthermore, other countries in digital wallet adoption are followed as Hong Kong (87.9%), the Philippines (87.8%), Malaysia (86.9%), Argentina (84.6%), China (84.4%), Saudi Arabia (83.9%), and Singapore (79.7%).
Digital Wallet Penetration Statistics by Region
- According to Capital One Shopping Research, further shows that in North America in 2024, 41% of all POS payments were made with credit cards, 156% more than the 16% made with digital wallets.
- By 2030, credit card use in North American POS payments is expected to decline to 33%; digital wallet use will increase to 29%.
- Also in 2024, 39% of North American online payments were made with digital wallets, just over the 32% made with credit cards.
- By 2030, digital wallets will solidify their lead over credit cards in North American online payments, rising to capture 52% of transactions online as credit card use drops to 22%.
Moreover, other regions’ analysis of 2024 is stated in the table below:
| Region | POS Payment- Digital Wallets | POS Payments-Credit/Debit/Cash | Online Payments-Digital Wallets | Online Payments-Credit/Debit/Cash | 2030 Forecast-POS | 2030 Forecast-Online |
| Asia-Pacific | 54% | 18% (Credit Cards) | 74% | 12% (Credit Cards) | 65% (Digital Wallets), 13% (Credit Cards) | 80% (Digital Wallets), 7% (Credit Cards |
| Europe | 14% | 42% (Debit Cards) | 33% | – | 27% (Digital Wallets) | 46% (Digital Wallets) |
| Latin America | 13% | 25% (Cash) | 22% | 30% (Credit Cards) | 23% (Digital Wallets) | 29% (Digital Wallets) |
| Middle East & Africa | 21% | 28% (Cash) | 27% | 22% (Debit Cards) | 35% (Digital Wallets) | 39% (Digital Wallets) |
Digital Wallet Usage Statistics by Category
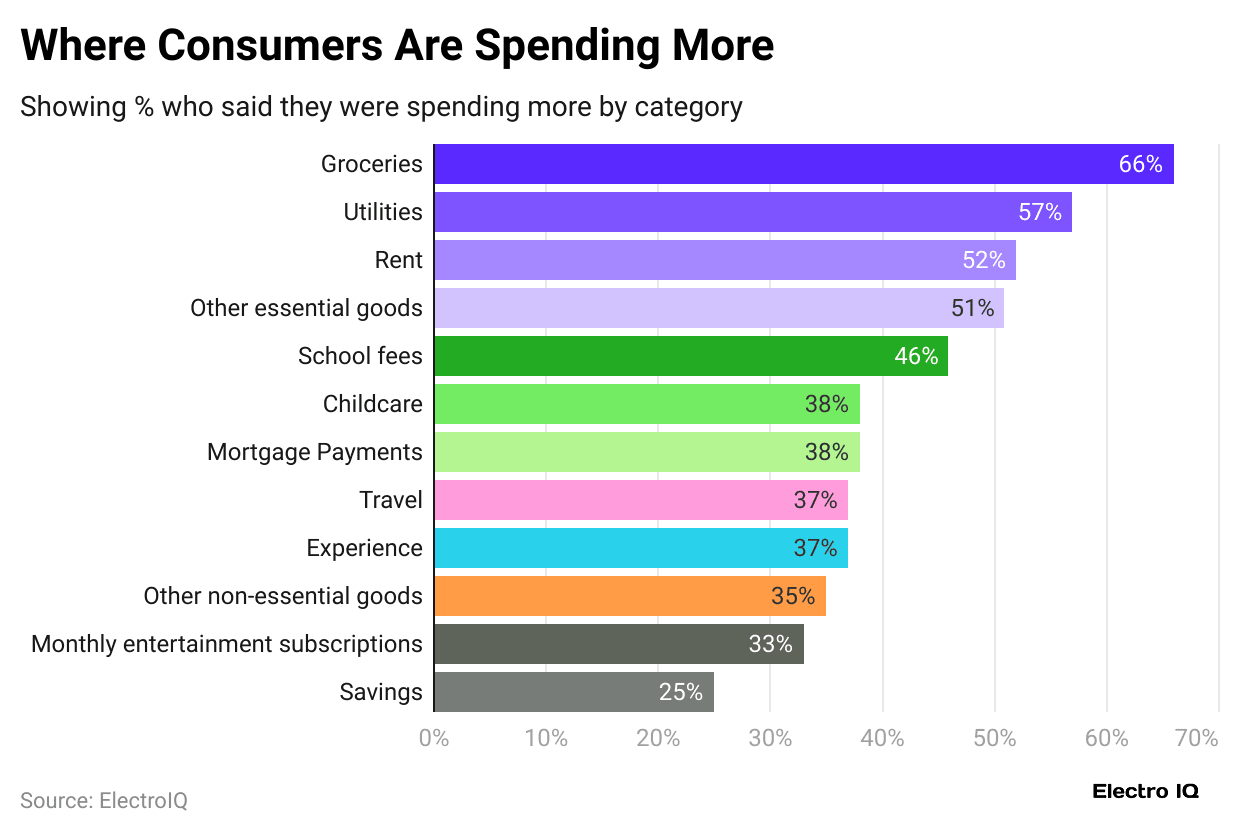
- Survey data on digital wallet spending in 2024 shows that 66% of consumers reported higher use for groceries, followed by 57% for utilities and 52% for rent.
- Other essentials like goods (51%), school fees (46%), also ranked high, childcare and mortgage payments (38% each), travel and experiences (37% each).
- Moreover, other non-essential goods (35%), monthly entertainment subscriptions (33%), and savings (25%).
Digital Wallet Usage Statistics by Platform
- In 2024, CapitalOne Shopping Research found that 61.3 million iPhone users in the U.S. used Apple Pay.
- Across the country, 111.9 million people used some form of mobile payment during the year.
- More than half of them, 54.8%, chose Apple Pay over other services.
- According to chargeflow.io, 48.6 million Americans used Google Wallet in 2024, which equals about 14.5% of the U.S. population.
- The number is expected to reach 50.9 million in 2025 and could climb to 57 million by 2028, with the possibility of 300 million users worldwide.
- PayPal reported in June 2024 a revenue of USD 7.89 billion, a net income of USD 1.13 billion, and a profit margin of 14.31%, as per helplama.com.
- In comparison, back in September 2023, PayPal’s revenue stood at USD 7.42 billion, with USD 1.02 billion in net income.
- io shared that in 2025, Samsung Pay processed over 1.6 billion transactions across 31 countries.
Its U.S. user base increased by 9% year-over-year, reaching 35 million active users. - The same report highlighted that in 2025, Amazon Pay processed about USD 85 billion in transactions, marking a 13.3% increase from 2024.
- The service achieved 3.2 billion transactions, with mobile payments growing 20%, and now serves over 12 million Amazon Pay Later users.
Top Digital Wallet Apps Statistics by Monthly Active Users in Countries
| Country | Top Digital wallet (brand) | Users |
| Global | Google Pay | 820 million (2025) |
| China | WeChat Pay | 935 million (2023 to 2024) Large-scale MAU for WeChat: ~1.38 billion MAU (Q1, 2025) |
| India | PhonePe | 600 million (Mar to Apr 2025) |
| Paytm | 270 million MAU (early 2025) | |
| United States | Venmo | 92 million (Q1 2025) |
| U.S. (Wallet widely used in-store) | Apple Pay | 60 to 64 million U.S. users( in 2025) |
| Brazil | PicPay | 40 million 2024 to Q1 2025) |
| Japan | PayPay | 68 to 70 million (May 2025) |
| South Korea | Kakao Pay | 6.35 million (Q2, 2025) |
Pros and Cons of Digital Wallet
| Pros | Cons |
| Convenience | Security Concerns. |
| Speed | Tangibility |
| Adaptability | Dependence on Technology |
| Compactness | Potential Misuse |
| Global Transactions | Limited Acceptance |
Technological Innovations and Trends of Digital Wallets in 2025
- Digital wallets now use tokenisation, turning sensitive data into unique codes, which helps prevent data theft.
- Artificial Intelligence (AI) is being utilised to analyse user behaviour, predict spending patterns, and offer tailored financial products and rewards.
- Facial recognition and fingerprint scanning are now termed as standard verification in digital wallets.
- Governments are exploring the integration of Central Bank Digital Currencies (CBDCs) into digital wallets.
- Digital wallets are expanding their reach by integrating with wearable devices like smartwatches or fitness trackers.
- Companies like Apple are introducing features that allow users to store digital driver’s licenses and state IDs within their digital wallets.
Conclusion
After completing the article on Digital Wallet Statistics, all the data shows that digital wallets are becoming an important part of daily life. In recent years, as millions of people are using them because smartphones are common, online shopping is growing, as well as the demand for quicker, safer ways to make payments.
The number of users is rising, transaction amounts are increasing, and features like contactless payments and spending trackers are becoming popular. Both customers and businesses value the ease and security these wallets offer. As technology improves, digital wallets will play an even bigger role in everyday payments, gradually reducing reliance on cash.
Sources
FAQ.
The three types of digital wallets are closed wallets, semi-closed wallets, and open wallets.
Globally, the most widely used digital wallet is PayPal, which is used by millions for online transactions.
The first digital wallet was created by Coca-Cola and IBM in 1994 for payments.
Yes, this can be hacked if security measures fail, but strong protections greatly reduce risks.
Some digital wallets are free, but certain transactions or international payments may include small fees.

Maitrayee Dey has a background in Electrical Engineering and has worked in various technical roles before transitioning to writing. Specializing in technology and Artificial Intelligence, she has served as an Academic Research Analyst and Freelance Writer, particularly focusing on education and healthcare in Australia. Maitrayee's lifelong passions for writing and painting led her to pursue a full-time writing career. She is also the creator of a cooking YouTube channel, where she shares her culinary adventures. At Smartphone Thoughts, Maitrayee brings her expertise in technology to provide in-depth smartphone reviews and app-related statistics, making complex topics easy to understand for all readers.