Electric Bikes Statistics By Revenue, Sales and Facts
Updated · Aug 27, 2024
Table of Contents
- Introduction
- Editor’s Choice
- E-Bike Fun Facts
- Electric Bike Market
- Oil Displacement Due To EV Usage
- Electric Bike Vehicle Size By Electric Type
- Asia Pacific Electric Bike Vehicles
- Electric Vehicle’s Worldwide Revenue
- Electric Vehicle Revenue In Europe
- Electric Vehicle Revenue In Asia
- Electric Bicycles Forecast
- India E-bike Statistics
- Impact of China's Slowdown
- How Many e-Bikes Have Been Sold?
- Are E-Bikes Becoming More Affordable and Profitable?
- E-Bike Usage and Popularity Statistics
- Environmental Impact of Electric Bikes
- E-Bike Safety Statistics
- Conclusion
Introduction
Electric Bikes Statistics: An e-bike is a vehicle powered by an electric motor that provides propulsion through an assistive system. There is a wide variety of e-bikes designed to meet the needs of various tasks and activities. It is essential to have comprehensive information on electric vehicles and to gather data about e-bike statistics to gain a complete understanding of electric vehicles. Similarly, understanding the future of technology expected to drive vehicles is crucial for users.
Editor’s Choice
- The global e-bike market is projected to generate around USD 51.78 billion in revenue by 2029.
- The market is expected to grow at a CAGR of approximately 8% between 2024 and 2029.
- By 2024, the global e-bike market is estimated to reach USD 32 billion.
- E-bike battery range improved by 15% in 2023, making them more attractive to consumers.
- The global electric bike market is expected to grow from 40 million units in 2023 to 77 million units by 2030.
- Growing concerns about climate change and the need to reduce carbon emissions have driven the demand for electric vehicles.
- In 2023, lithium-ion batteries held a significant share of the e-bike market, accounting for 69.3%.
- The market is projected to grow at a CAGR of nearly 10% from 2022 to 2030, reaching just under 77.3 million e-bikes by 2030.
- The India e-bike market is expected to grow from USD 27 million in 2024 to USD 60.93 million by 2029, with a CAGR of 17.68% during this period.
- Slowdown in China’s market growth has hindered the overall global growth of BEV sales. In the third quarter of 2023, battery electric vehicle (BEV) sales increased by 26% in all twenty analyzed markets compared to the same period last year.
E-Bike Fun Facts
- The idea of electric bicycles dates back to 1895 when Ogden Bolton Jr. received the first US patent for a bike powered by a battery.
- In 1899, John Schnepf patented an electric bike with a rear-wheel friction roller for propulsion.
- Yamaha created the first working prototype of an electric bike in 1899.
- UPS is experimenting with using electric tricycles to deliver packages in cities like Pittsburgh and Seattle.
- The US Government offers a tax-free benefit to people who commute to work using an electric bike instead of driving a car alone.
- Research published in a journal found that electric bike riders often get more exercise than those on regular bikes because they take more trips and ride longer distances.
Electric Bike Market
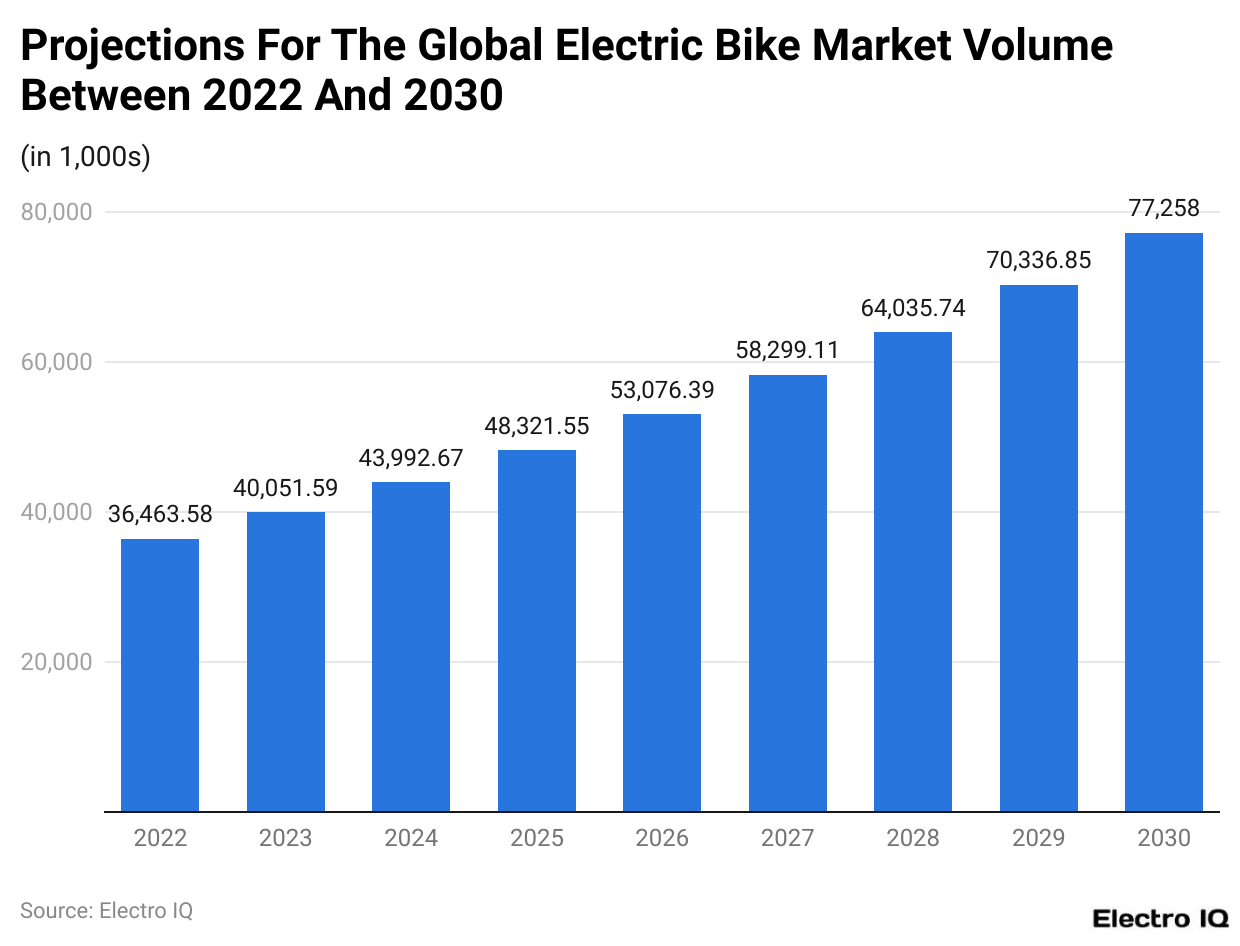
(Reference: Statista.com)
- If one Regarding e-bike statistics, the global electric market is rising significantly.
- In 2023, the e-bike revenue of 40,051.59k units.
- In 2030, it predicted that the total sales of e-bikes would be 77,258k units.
Oil Displacement Due To EV Usage
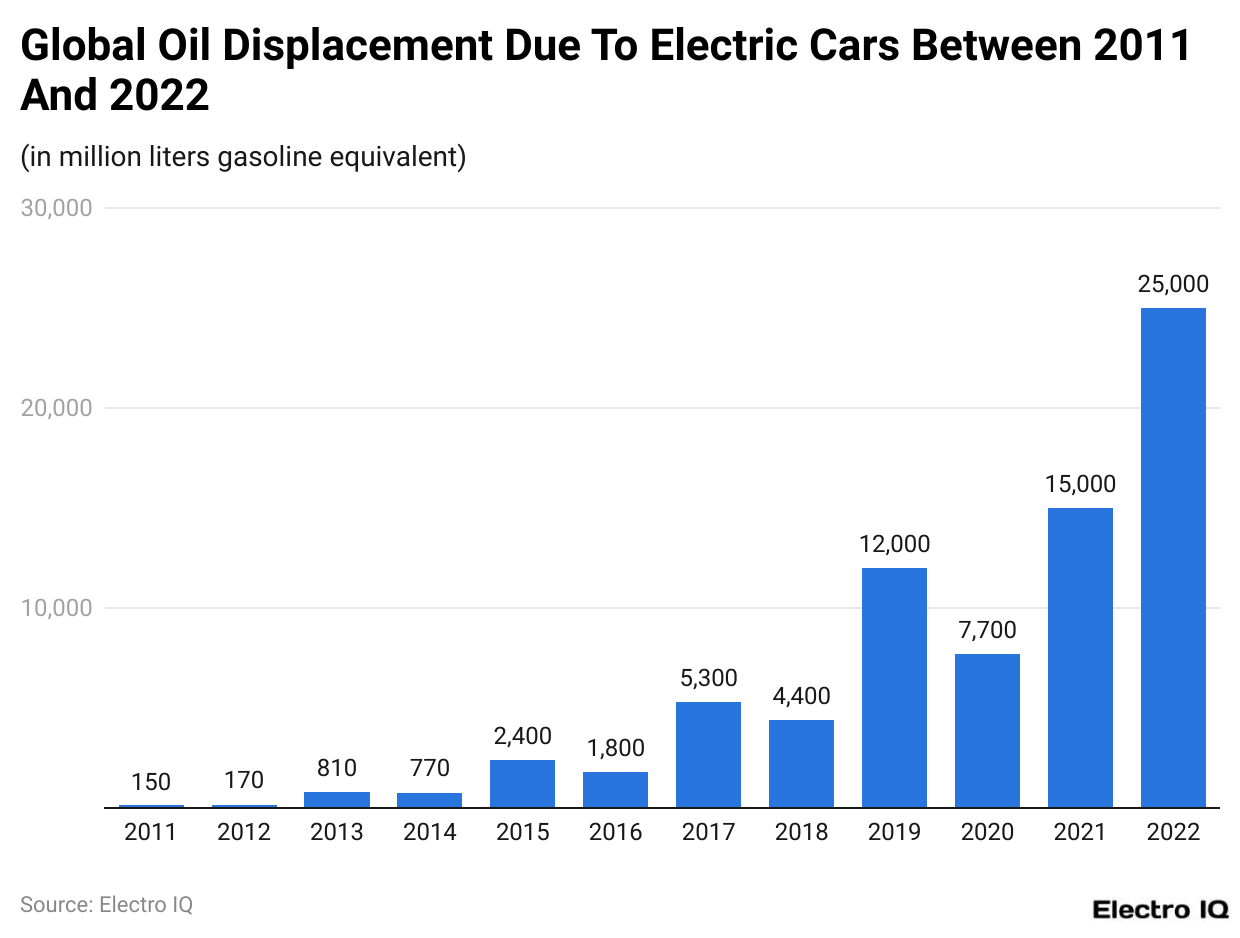
(Reference: Statista.com)
- Referring to electric bike statistics, around 25 billion gasoline were displaced in 2022.
- Starting from a meager displacement of 150 million gasoline units displacement, it is impressive to see the rise of electric vehicles and how they replace gasoline-based vehicles.
Electric Bike Vehicle Size By Electric Type
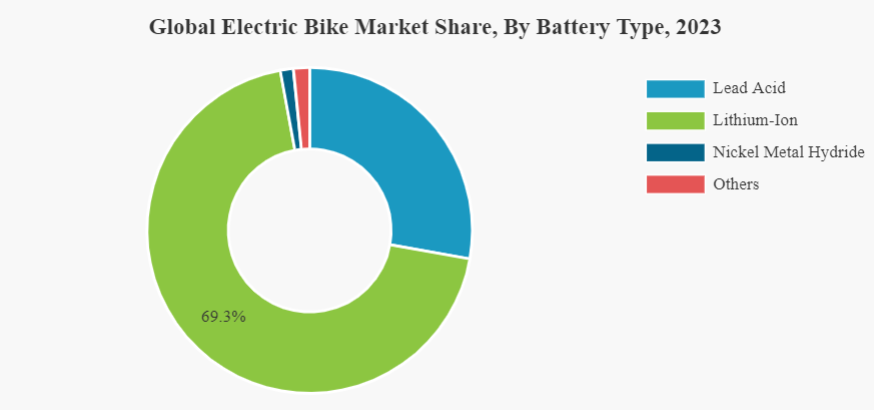
(Source: fortunebusinessinsights.com)
- Regarding electric bike statistics, Lithium-ion battery has the highest share of electric vehicles, with 69.3%.
- Lead Acid, Nickel Metal Hydride, and other electric bike vehicles follow it.
Asia Pacific Electric Bike Vehicles
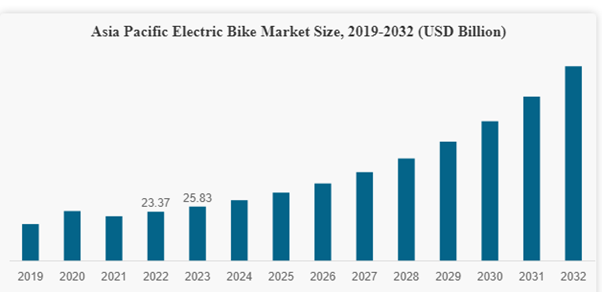
(Source: fortunebusinessinsights.com)
- Referring to electric bike statistics, the sales of Asia Pacific vehicles have increased consistently, which is expected to continue.
- In 2023, the revenue in the Asia Pacific region was $25.83 billion.
Electric Vehicle’s Worldwide Revenue
(Reference: Statista.com)
- Regarding electric bike vehicles, the worldwide revenue is $623.3 billion as of June 2024.
- Norway leads the global sales and market share in the revenue from electric vehicles.
- Based on the projected volume, the revenue by 2028 would be $906.7 billion.
Electric Vehicle Revenue In Europe
(Reference: Statista.com)
- About electric bike statistics, Germany is the rising market with a massive surge in demand.
- The electric vehicle market in Europe is expected to reach a revenue of $182.9 billion in 2024.
- By 2028, electric vehicle revenue is expected to reach 4.83 vehicles.
Electric Vehicle Revenue In Asia
(Reference: Statista.com)
- According to electric bike statistics, the revenue is expected to reach $342.1 billion.
- Japan is developing its infrastructure to enhance revenue and provide an environment that facilitates EV adoption.
Electric Bicycles Forecast
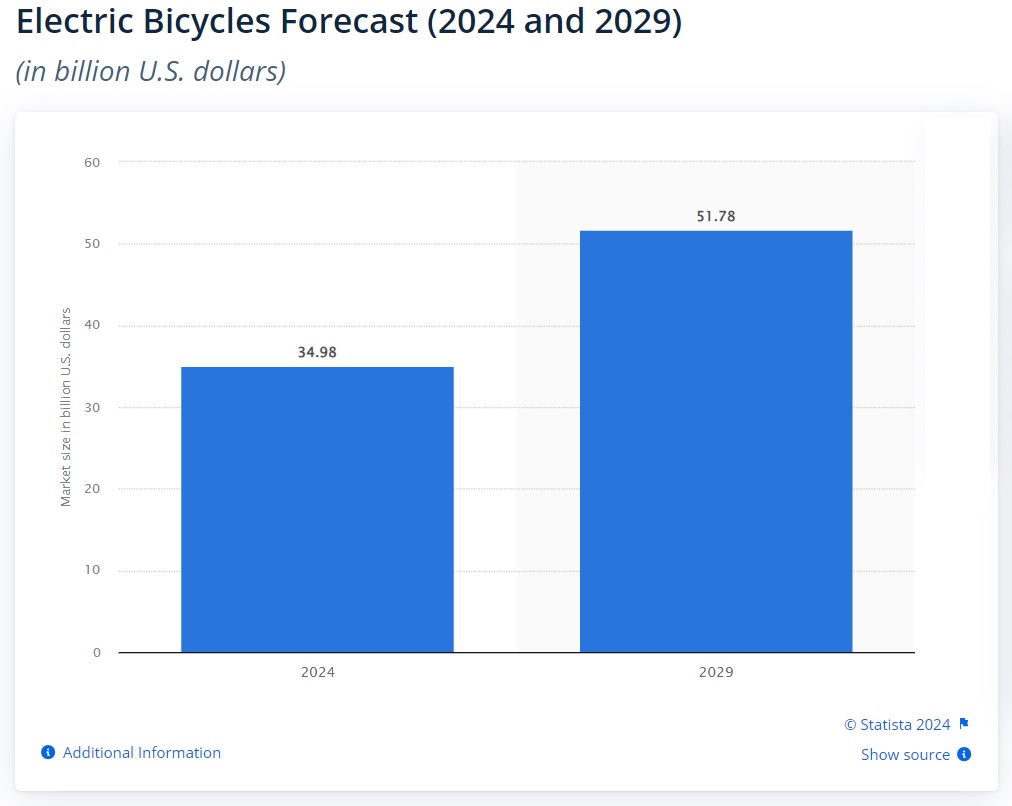
- The global e-bike market is expected to generate around USD 51.78 billion in revenue by 2029, with a compound annual growth rate of about 8% from 2024 to 2029.
- E-bikes are becoming more popular and are moving from being seen as niche and unfashionable to mainstream in various markets, from rural areas to cities.
- Power-assisted bicycles attract users who previously avoided cycling, such as those who struggled with hills or preferred driving to work.
- Once users try e-bikes, their perception of cycling often improves, leading to more positive attitudes towards biking.
- Professional athletes are praising electric bikes, further boosting their popularity.
- E-bikes are a significant investment for consumers, as they are much more expensive than traditional bicycles.
- The Asia-Pacific region is the largest market for e-bikes.
- The European market for e-bikes is growing rapidly.
- In some European countries, e-bikes now make up more than half of all bicycles sold.
- The Netherlands is the leading country in Europe for e-bike sales, reaching this point in 2020.
- Germany is another key market, with 2.2 million e-bikes sold in 2022.
India E-bike Statistics
- According to the Mordor Intelligence, the India E-bike market is valued at approximately USD 27.00 million in 2024. It is expected to grow to USD 60.93 million by 2029, with a compound annual growth rate (CAGR) of 17.68% during the forecast period.
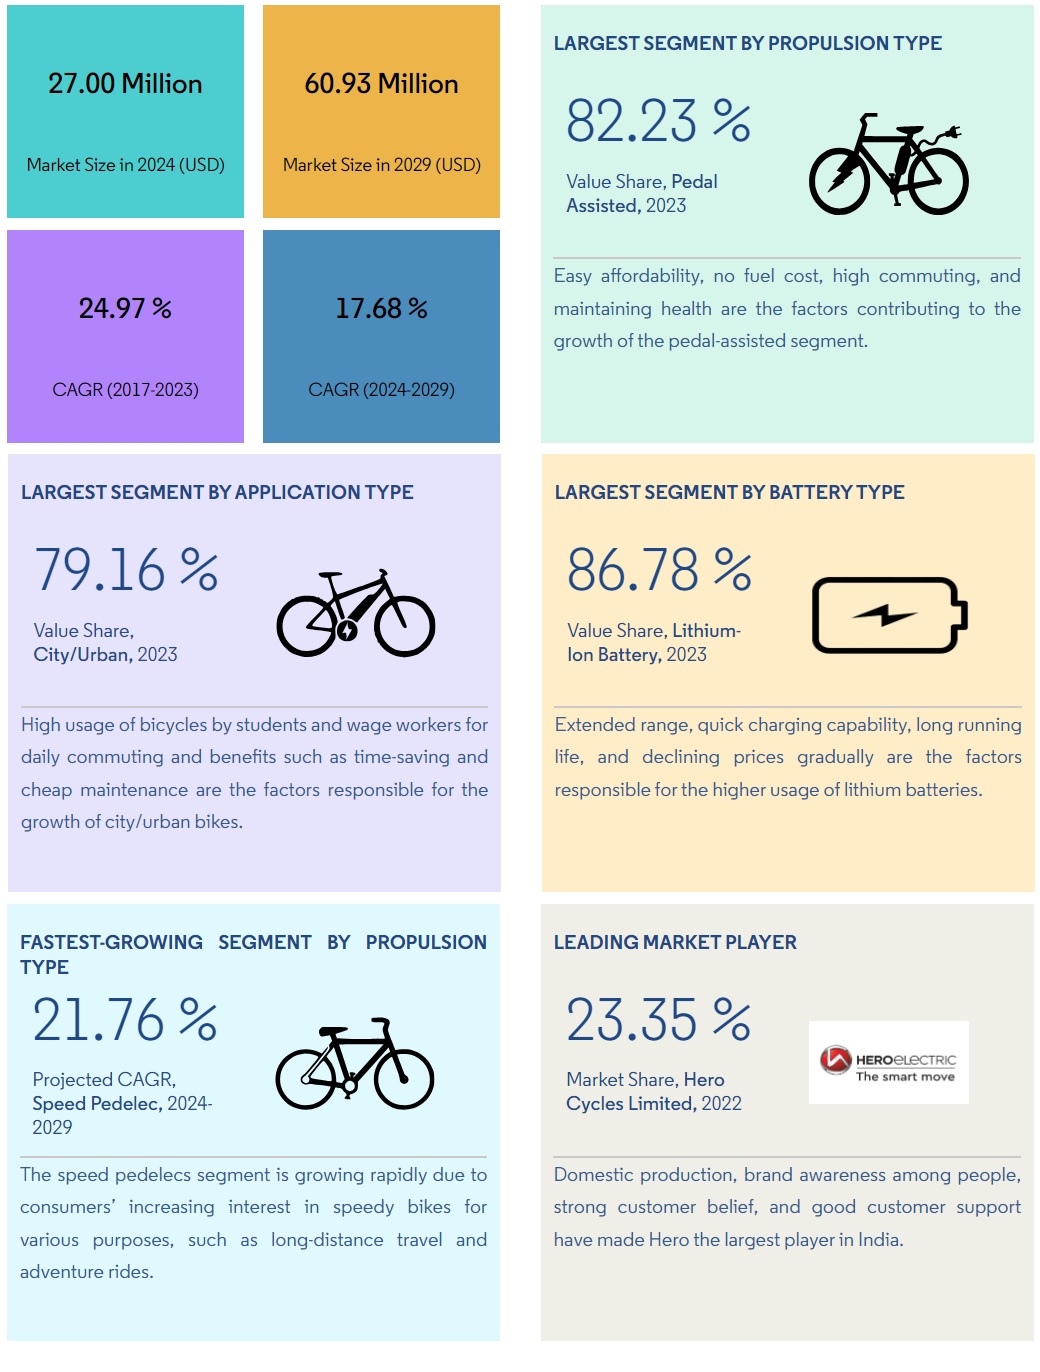
- E-bike adoption in India is steadily increasing, indicating significant market potential.
- The popularity of e-bikes is rising due to growing awareness of their health benefits and the need to avoid traffic congestion.
- Government initiatives supporting e-bike adoption are contributing to the market's growth.
- Lower fuel and maintenance costs are driving e-bike adoption among Indian consumers.
- The COVID-19 pandemic positively impacted e-bike adoption as people sought alternatives to public transportation to maintain social distancing.
- E-bike adoption saw a sharp rise from 0.10% in 2019 to 0.60% in 2022, with a projected increase to 5.00% by 2029.
- The easing of lockdown restrictions and the resumption of commercial activities have further boosted the e-bike market.
- More people in India are commuting daily by bicycle, especially for distances of 5-15 kilometers.
- The pandemic increased the demand for bicycles as people turned to cycling for exercise and essential travel.
- The introduction of e-bikes with better features and longer battery life has encouraged their use for commuting and recreational activities.
- The habit of cycling for short commutes is growing, with more people opting for bicycles to save time and avoid traffic.
- The market is fragmented, with the top five companies holding a combined market share of 35.09%.
- The major players in the India E-bike market include Alpha Vector, Cultsport, EMotorad, Hero Cycles Limited, and Tru E Bikes Pvt. Ltd.
Impact of China's Slowdown
- BEV sales grew by 26% in the third quarter of 2023 across all twenty analyzed markets compared to the same period last year.
- The growth figure would be higher if not for the slowdown in the Chinese market.
- China plays a crucial role in the global BEV market, with its sales making up two-thirds of all BEV sales in the analyzed markets.
- BEV sales growth in China has been slowing due to a weakening economic outlook.
- This slowdown in China is a significant change from the rapid growth seen two years ago.
- In most analyzed markets, BEV sales growth outpaced the growth of total powertrain sales during the same period.
- South Korea was the only market where total powertrain sales growth exceeded BEV sales growth.
- The gap between BEV sales growth and overall powertrain sales growth was notably wide in some regions, such as 62% vs. 17% in the USA and 59% vs. 18% in Germany.
- PwC Autofacts predicts that strong BEV sales growth will continue, with an expected increase of 35% in all analyzed markets in 2024.
How Many e-Bikes Have Been Sold?
- 2019: Approximately 3.7 million e-bikes were sold.
- 2023: It is estimated that there will be 300 million e-bikes in use globally.
- 2024: Annual sales are projected to rise to 10 million.
- 2030: The annual sales could further increase to 17 million.
Are E-Bikes Becoming More Affordable and Profitable?
- E-bikes are getting cheaper as lithium-ion batteries become more efficient and less expensive.
- The price of e-bikes has decreased due to the reduction in battery costs.
- In 2022, the average price of e-bikes sold in the US was $1,825, which was 10% lower than the average price in 2021.
- While high-end models are becoming more expensive, the lower costs of affordable models are driving down the average price.
- Manufacturing and selling e-bikes is profitable, but the profit margins are not very high.
- Production costs account for about 42% of the sales price of an e-bike.
- After considering other costs, the net profit margin on each e-bike is typically around 10%.
E-Bike Usage and Popularity Statistics
- E-bikes are becoming much more popular, especially when compared to regular bikes and other electric vehicles.
- From 2019 to 2021, sales of e-bikes increased by 240%, which was four times faster than the sales growth of traditional bikes.
- In 2020, e-bike sales were double that of electric vehicles.
- E-bikes are appealing to a wide range of age groups, especially those between 40 and 70 years old.
- E-bikes are becoming the preferred choice in bike-sharing programs across many cities.
- Over 50 cities in the U.S. now include e-bikes in their bike-sharing fleets.
- In New York, e-bikes are used for 35% of all Citi Bike rides, even though they make up only 20% of the fleet.
- On average, a Citi Bike e-bike is used 9 times daily, compared to 3.5 times for a regular bike.
- Madison, Wisconsin, saw its BCycle usage more than double after introducing e-bikes.
- In China, Hellobike's electric bike-sharing service is its most profitable segment.
- Many people use e-bikes to reduce car trips, making it easier to travel through hilly areas.
- E-bikes are popular for being cheaper than driving and for environmental reasons.
- In busy urban areas like Manhattan and central London, e-bikes are often the fastest way to get around.
- Nearly all e-bike riders (96.4%) enjoy the experience, with 75% preferring e-bikes over driving a car.
Environmental Impact of Electric Bikes
- E-bikes are much better for the environment compared to cars. Replacing short car trips with e-bikes in cities has shown positive effects.
- Electric bikes significantly reduce carbon emissions. For example, in Portland, Oregon, if 15% of daily trips were made by e-bike instead of car, carbon emissions could drop by 11%, saving around 900 metric tons of CO2 each day.
- E-bikes produce much less CO2 than cars. They emit only 4.9g of CO2 per person per mile, compared to 140g from public transport and 274g from cars.
- The environmental benefit of e-bikes depends on how the electricity is generated. If it's from renewable sources, the carbon footprint is minimal. If from fossil fuels, the impact is higher.
- Modern e-bikes use lithium-ion batteries, which are more environmentally friendly than older lead-acid batteries. Lead-acid batteries are heavier, less efficient, and can pollute the environment if not disposed of properly.
E-Bike Safety Statistics
- E-bikes have batteries that store a lot of energy, which can sometimes cause fires if not charged or stored correctly.
- E-bike fires have been reported globally, with over 100 incidents in New York and London in 2021, and more than 10,000 fires in China between 2013 and 2017.
- The number of e-bike accidents has increased as their use has grown.
- E-bike riders generally feel safer on the road than regular cyclists, with 78.3% of e-bike users feeling safe compared to 63.7% of regular cyclists.
- E-bikes are faster than regular bikes, with an average speed of 13.3 kph compared to 10.4 kph for regular bikes.
- Although e-bike riders feel safer, they often experience more severe injuries and higher hospitalization rates compared to regular cyclists.
- In the last few years up to 2021, injuries involving e-bikes and e-scooters increased by 70%, while car accident injury rates remained mostly stable.
- It is difficult to determine whether e-bikes are safer than cars due to the many variables involved.
Conclusion
While going through electric bike statistics, it is evident that it has experienced significant growth in recent years. Driven by increasing environmental awareness and rising fuel costs, the demand for effective transportation solutions has led to the rise of electric bikes. The global market of e-bikes is valued at $32 billion as of June 2024. Technological advancements and supportive government policies have emerged as critical factors in shaping the future of the e-bike industry.
Sources
FAQ.
The global e-bike market share is expected to reach 77,258k units in sales by 2030.
As per electric bike statistics, the industry experienced around 25 billion gallons of Gasoline displacement with the introduction of electric vehicles.
Norway leads in global sales and revenue in electric vehicles, including bikes.

Pramod Pawar brings over a decade of SEO expertise to his role as the co-founder of 11Press and Prudour Market Research firm. A B.E. IT graduate from Shivaji University, Pramod has honed his skills in analyzing and writing about statistics pertinent to technology and science. His deep understanding of digital strategies enhances the impactful insights he provides through his work. Outside of his professional endeavors, Pramod enjoys playing cricket and delving into books across various genres, enriching his knowledge and staying inspired. His diverse experiences and interests fuel his innovative approach to statistical research and content creation.


