Employee Theft Statistics By Industry, Perpetrator And Region
Updated · Feb 11, 2026

Table of Contents
- Introduction
- Editor’s Choice
- Incidents of Fraud Experienced
- Disruptive Fraud By Industry
- Top Victims of Fraud By Industry
- Employee Fraud Perpetrator By Position
- Employee Fraud Perpetrator By Department
- Employee Fraud By Region
- Type of Occupational Fraud
- Asset Misappropriation Thefts
- Intensity of Fraud Loss By Duration
- Concealment Used By Fraudsters
- Frauds Involving Cryptocurrency
- Occupation Fraud Detection
- Occupational Fraud Sources
- Formal Reporting Mechanisms of Whistleblowers
- Most Common Anti-Fraud Controls
- Anti-Fraud Control By Industry
- Conviction History of Perpetrators
- Employee-Related Disciplinary History Of The Perpetrator
- The Red Flag of Perpetrators
- Conclusion
Introduction
Employee Theft Statistics: Employee theft and fraud remain significant challenges for organizations worldwide, representing a substantial threat to financial stability and operational integrity. By reviewing Employee Theft Statistics, we can learn the complex nature of occupational fraud and its far-reaching implications.
The economic impact varies significantly based on factors such as the duration of the scam, the perpetrator’s position, and the type of scheme employed. It is a crucial resource for organizations seeking to understand, prevent, and detect occupational fraud in an evolving business landscape.
Editor’s Choice
- Customer fraud leads all fraud types at 35% of reported incidents
- The real estate industry faces the highest median losses at 435,000 USD
- Executive-level fraud results in median losses of 337,000 USD
- The United States and Canada account for 36% of all fraud cases
- Asset misappropriation represents 47% of occupational fraud
- Tips remain the primary fraud detection method at 42%
- 87% of fraud perpetrators had no prior criminal record
- Fraud lasting over 60 months leads to median losses of 800,000 USD
- Email has become the preferred whistleblowing method in 2022
- Non-profit organizations lead in anti-fraud control implementation at 87%
- Living beyond means is the top red flag at 39%
- Billing fraud accounts for 20% of asset misappropriation cases
- Operations department leads in fraud cases at 15%
- 48% of cryptocurrency frauds involve bribery or kickback payments
- 83% of fraudsters had no prior workplace disciplinary history
Incidents of Fraud Experienced
(Source: pwc.com)
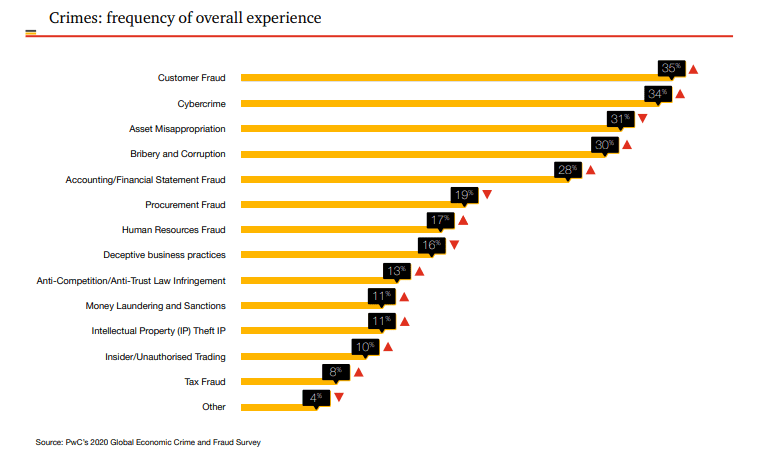
- Employee Theft Statistics show that customer fraud is the most prevalent type of fraud experienced by 35% of respondents.
- Cybercrime is the second most prevalent type of fraud, experienced by 34% of respondents.
- Asset misappropriation is the third most prevalent type of fraud, experienced by 31% of respondents.
- Bribery and corruption are the fourth most prevalent type of fraud, experienced by 30% of respondents.
- Accounting/financial statement fraud is the fifth most prevalent type, experienced by 28% of respondents.
Disruptive Fraud By Industry
(Source: pwc.com)
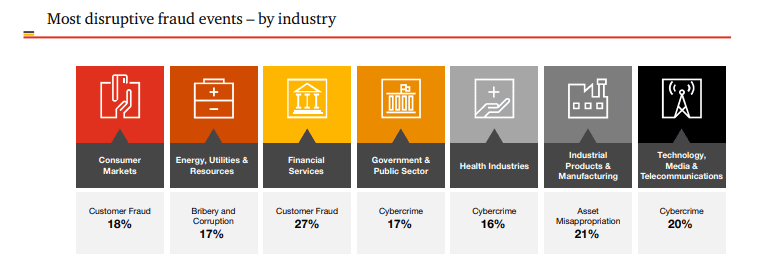
- Employee Theft Statistics show that customer fraud is the most common type of fraud reported in the consumer market, according to 18% of respondents.
- Bribery and corruption are the highest reported in energy, utilities, and resources, according to 17% of respondents.
- Customer fraud is the highest reported in financial services, according to 27% of respondents.
- Cybercrime is the highest reported in the government and public sector, according to 17% of respondents.
- Cybercrime is the highest reported in the health industry, according to 16% of respondents.
- Asset misappropriation is the highest reported in industrial products and manufacturing, according to 21% of respondents.
- Cybercrime is the highest reported in technology, media, and telecommunications, according to 20% of respondents.
Top Victims of Fraud By Industry

(Source: amazonaws.com)
- Employee Theft Statistics show that real estate has experienced the highest losses among different industries, with 435000 USD.
- Wholesale trade has experienced the second-highest losses among different industries, with USD400,000.
- Transportation and warehousing has experienced the third-highest losses among different industries, with USD250,000.
- Construction has experienced the fourth-highest losses among different industries, with USD203,000.
Employee Fraud Perpetrator By Position
(Source: amazonaws.com)
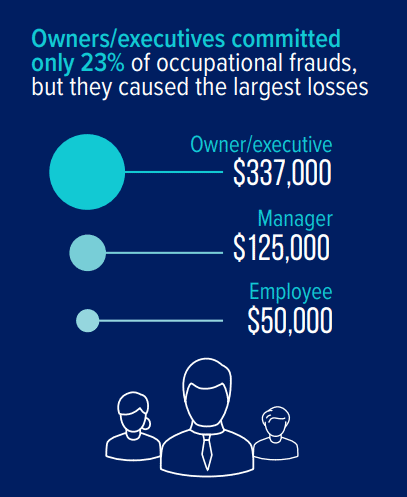
- Employee Theft Statistics show that employee fraud at the owner/executive level led to losses amounting to USD 337000.
- Employee fraud at the manager level led to losses amounting to USD 125,000.
- Employee fraud at the employee level led to losses amounting to USD 50,000.
Employee Fraud Perpetrator By Department

(Source: amazonaws.com)
- Employee Theft Statistics show that the operations department accounted for 15% of frauds.
- The accounting department accounted for 12% of frauds.
- The executive/upper management accounted for 11% of frauds.
- The sales department accounted for 11% of frauds.
Employee Fraud By Region

(Source: amazonaws.com)
- Employee Theft Statistics show that the United States and Canada accounted for 36% of all fraud cases.
- Sub-Saharan Africa accounted for 23% of all fraud cases.
- Asia-Pacific accounted for 10% of all fraud cases.
- Western Europe accounted for 8% of all fraud cases.
- Southern Asia accounted for 7% of all fraud cases.
- Middle East and North Africa accounted for 7% of all fraud cases.
- Latin America and the Caribbean accounted for 5% of all fraud cases.
- Eastern Europe and Western/Central Asia accounted for 4% of all fraud cases.
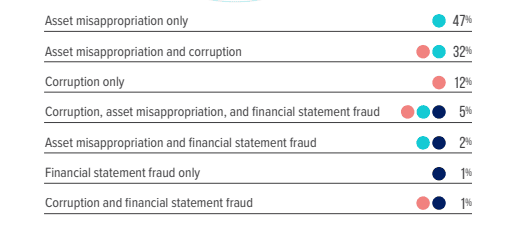
Type of Occupational Fraud
(Source: amazonaws.com)
- Employee Theft Statistics show that asset misappropriation only accounted for 47% of all occupational frauds.
- Asset misappropriation and corruption accounted for 32% of all occupational frauds.
- Corruption only accounted for 12% of all occupational frauds.
- Corruption, asset misappropriation, and financial statement fraud accounted for 5% of all occupational frauds.
- Asset misappropriation and financial statement fraud accounted for 2% of all occupational frauds.
- Financial statement fraud only accounted for 1% of all occupational frauds.
- Corruption and financial statement fraud accounted for 1% of all occupational frauds.
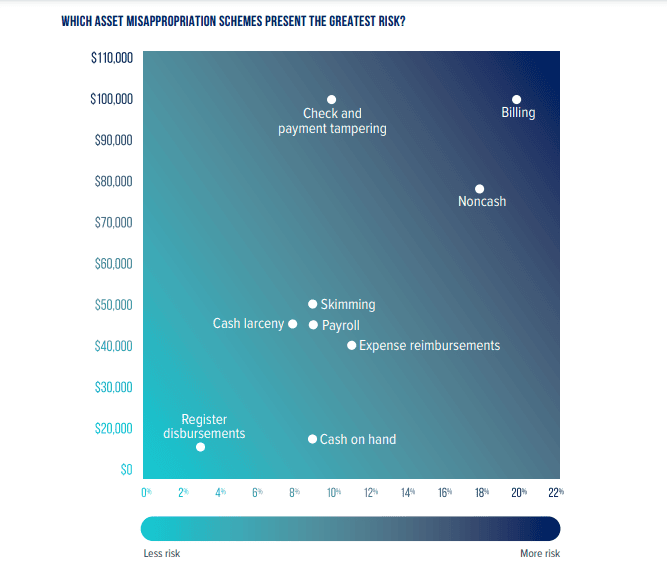
Asset Misappropriation Thefts
(Source: amazonaws.com)
- Employee Theft Statistics show that billing led to the highest cases involving asset misappropriation, amounting to 20% of cases, with a median loss of 100,000 USD.
- Noncash accounted for 18% of asset misappropriation cases, with a median loss of USD78,000.
- Expense reimbursements accounted for 11% of asset misappropriation cases, with a median loss of USD40,000.
- Check and payment tampering accounted for 10% of asset misappropriation cases, with a median loss of USD 100,000.
- Cash on hand accounted for 9% of asset misappropriation cases, with a median loss of USD15,000.
- Skimming accounted for 9% of asset misappropriation cases, with a median loss of USD50,000.
Intensity of Fraud Loss By Duration

(Source: amazonaws.com)
- Employee Theft Statistics show that employee fraud lasting over 60 months leads to a median loss of 800,000 USD.
- Employee fraud lasting 37–48 months leads to a median loss of USD 698,000.
- Employee fraud lasting 49–60 months leads to a median loss of USD 450,000.
- Employee fraud lasting 25–36 months leads to a median loss of USD300,000.
- Employee fraud lasting 13–18 months leads to a median loss of USD125,000.
- Employee fraud lasting 7–12 months leads to a median loss of USD100,000.
Concealment Used By Fraudsters

(Source: amazonaws.com)
- Employee Theft Statistics show that the creation of fraudulent physical documents comprised 39% of fraud.
- Alteration of physical documents comprised 32% of fraud.
- The creation of fraudulent electronic documents or files comprised 28% of fraud.
- Alteration of electronic documents or files comprised 25% of fraud.
- Destruction or withholding of physical documents comprised 23% of fraud.
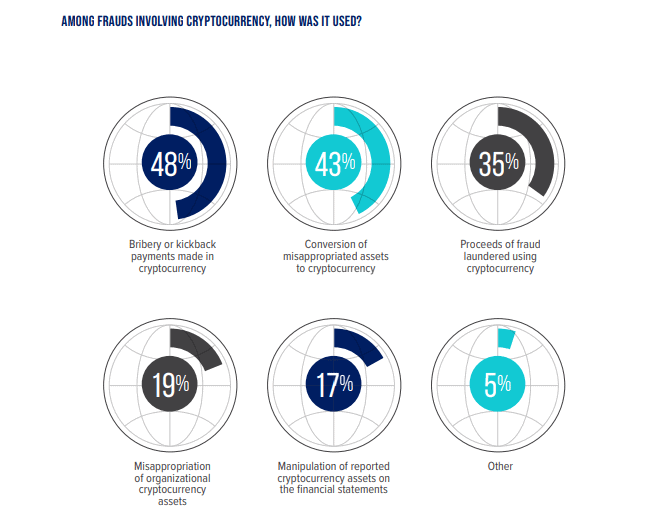
Frauds Involving Cryptocurrency
(Source: amazonaws.com)
- Employee Theft Statistics show that bribery or kickback payments make up 48% of cryptocurrency fraud.
- Conversion of misappropriated assets to cryptocurrency makes up 43% of cryptocurrency fraud.
- Proceeds of fraud laundered using cryptocurrency make up 35% of cryptocurrency frauds.
- Misappropriation of organizational cryptocurrency assets makes up 19% of cryptocurrency fraud.
- Manipulation of reported cryptocurrency assets on the financial statements makes up 17% of cryptocurrency fraud.
- Other types of cryptocurrency fraud make up 5% of cryptocurrency frauds.
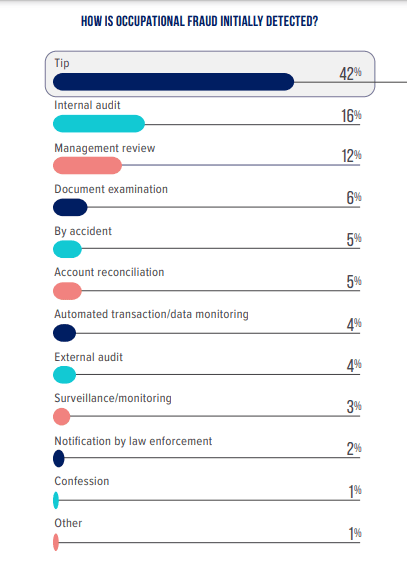
Occupation Fraud Detection
(Source: amazonaws.com)
- Employee Theft Statistics show that tipping is the most prevalent source of occupational fraud, accounting for 42% of all detected fraud.
- Internal audit is the second most prevalent source, making up 16% of occupational fraud detected.
- Management review makes up 12% of occupational fraud being detected.
- Document examination makes up 6% of occupational fraud being detected.
- By accident and account reconciliation, each makes up 5% of occupational fraud being detected.
- Automated transaction/data monitoring and external audits comprise 4% of occupational fraud detected.
Occupational Fraud Sources

(Source: amazonaws.com)
- Employee Theft Statistics show that employee is the most common source of reporting occupational fraud, amounting to 55% of all fraud reported.
- Customer is the second most common source of reporting occupational fraud, amounting to 18% of all frauds reported.
- Anonymous sources are the third most common, accounting for 16% of all frauds reported.
- Vendor reports account for 10% of all frauds reported.
Formal Reporting Mechanisms of Whistleblowers

(Source: amazonaws.com)
- Employee Theft Statistics show whistleblowers report fraud using web-based or online forms, fax, email, telephone hotlines, mailed letters or forms, and other methods.
- In 2016, the telephone hotline was the most common method of reporting fraud, comprising 40% of all fraud reported.
- In 2022, email has emerged as the the most common form of reporting fraud by whistleblowers.
Most Common Anti-Fraud Controls
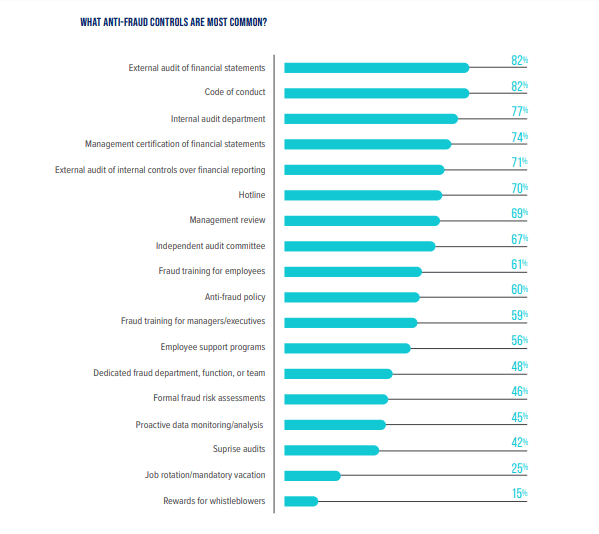
(Source: amazonaws.com)
- Employee theft statistics, external audits of financial statements, and code of conduct are the most common anti-fraud controls for 82% of respondents.
- Internal audit department is the second most common anti-fraud control for 77% of respondents.
- Management certification of financial statements is the third most common anti-fraud control for 74% of respondents.
- External audits of internal controls over financial reporting are a common anti-fraud control for 71% of respondents.
- Hotline is a common anti-fraud control for 70% of respondents.
Anti-Fraud Control By Industry
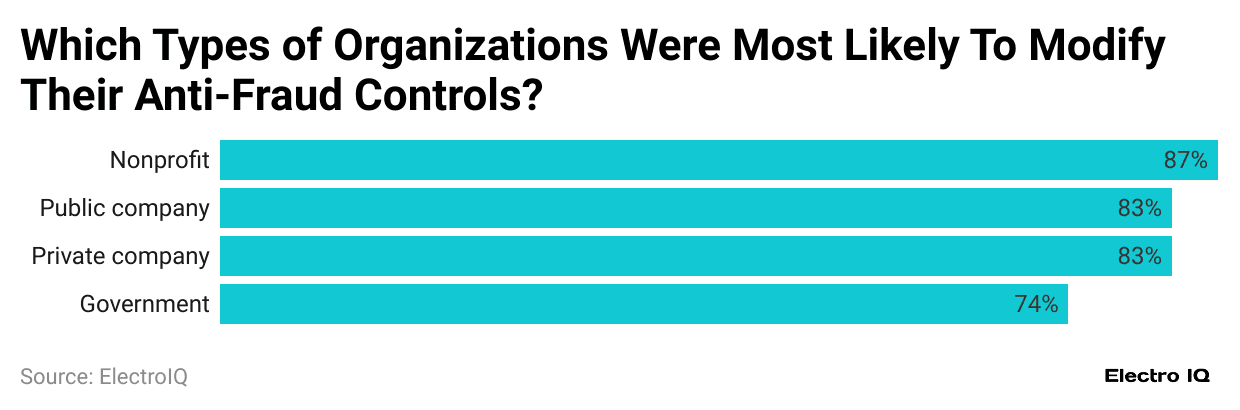
(Reference: amazonaws.com)
- Employee Theft Statistics show that non-profit organizations are most likely to use anti-fraud controls, amounting to 87%.
- Public and private companies are equally likely to modify their anti-fraud controls, each amounting to 83%.
- Government organizations will likely modify their anti-fraud controls, amounting to 74%.
Conviction History of Perpetrators
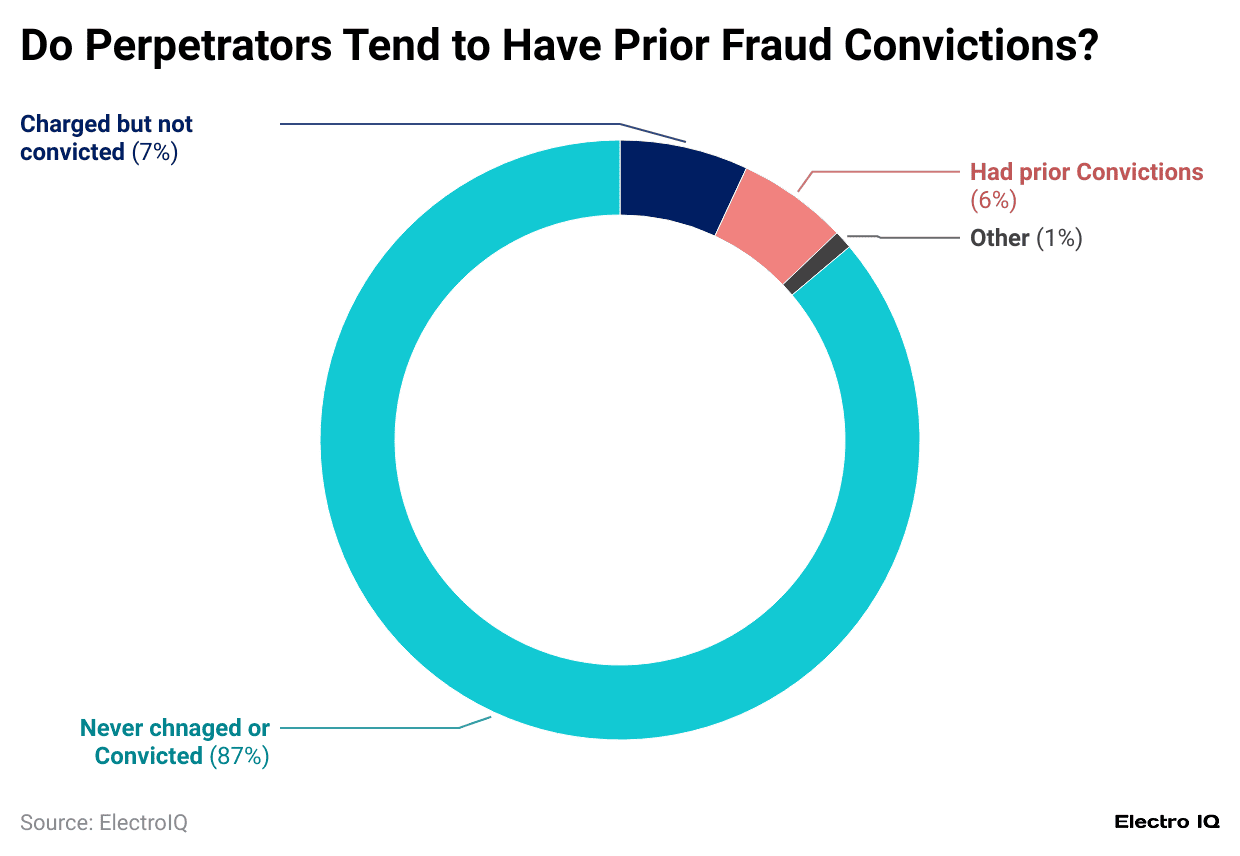
(Reference: amazonaws.com)
- Employee Theft Statistics show that 87% of perpetrators of employee fraud were never charged or convicted.
- 7% of perpetrators of employee fraud were charged but not convicted.
- 6% of perpetrators of employee fraud had prior convictions.
- 1% of perpetrators of employee fraud fall into other categories.
Employee-Related Disciplinary History Of The Perpetrator
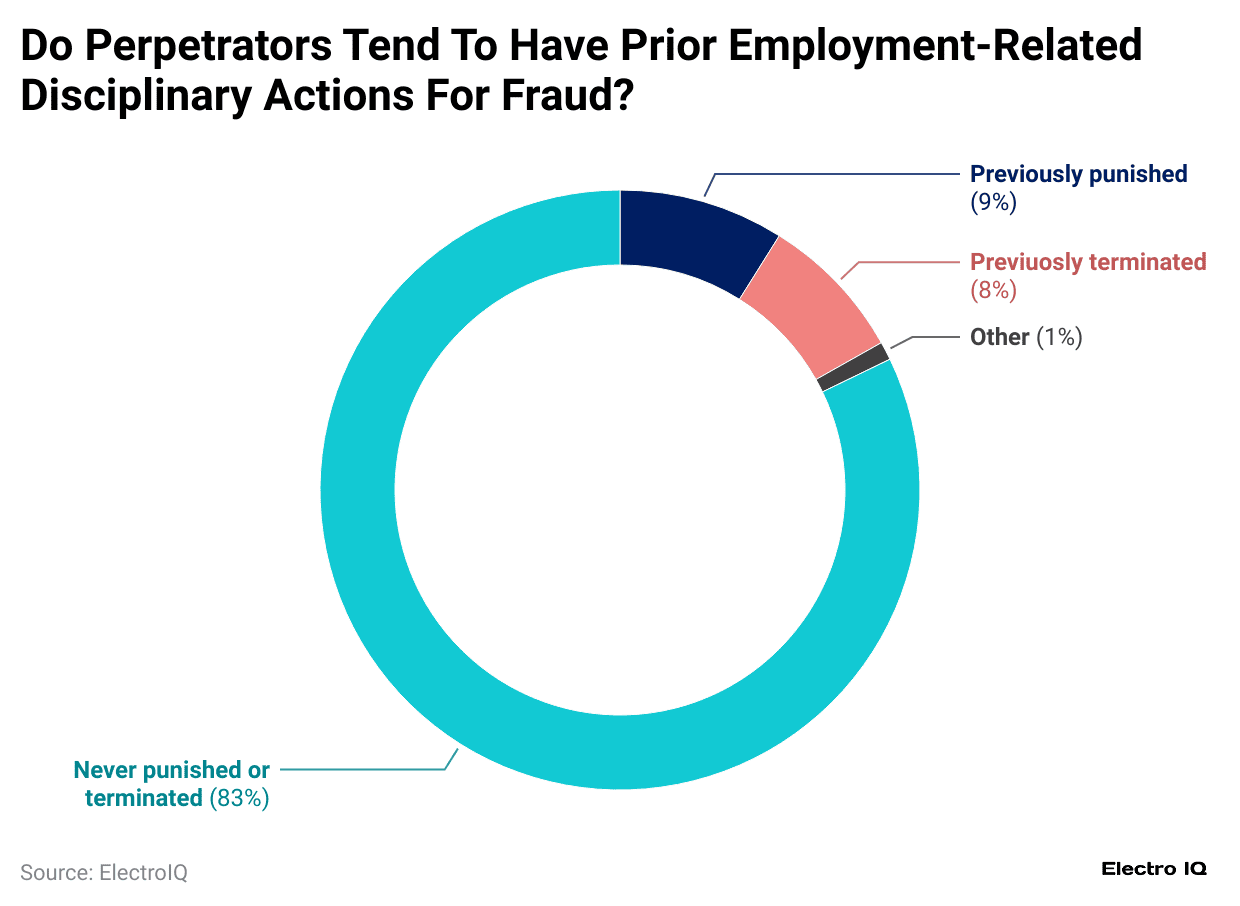
(Reference: amazonaws.com)
- Employee Theft Statistics show that 83% of employees were never punished or terminated for fraud.
- 9% of employees were previously punished for fraud.
- 8% of employees were previously terminated for fraud.
- 1% of employees fall into other categories.
The Red Flag of Perpetrators

(Reference: amazonaws.com)
- Employee Theft Statistics show that living beyond means is the biggest red flag for perpetrators being caught, as per 39% of respondents.
- Financial difficulties are the second biggest red flag for perpetrators being caught, as per 25% of respondents.
- As 20% of respondents stated, an unusually close association with a vendor or customer is a red flag that perpetrators are being caught.
- No behavioral red flags are reported for perpetrators being caught, as per 15% of respondents.
- Control issues, unwillingness to share duties, irritability, suspiciousness, defensiveness, and bullying or intimidation are red flags for perpetrators being caught, as per 12% of respondents.
- Ten percent of respondents said divorce, family problems, and a “wheeler-dealer” attitude are red flags that perpetrators are likely to be caught.
Conclusion
Employee Theft Statistics reveal several critical patterns and insights that organizations must consider when implementing fraud prevention strategies. They demonstrate that fraud remains a significant threat across all sectors, varying in impact on industry, position level, and geographical location. The financial services sector appears particularly vulnerable to customer fraud, while executive-level fraud consistently results in the highest losses.
The emergence of cryptocurrency-related fraud presents new challenges for organizations, requiring updated control mechanisms and detection methods. Organizations should prioritize developing comprehensive fraud prevention strategies incorporating traditional controls and new technologies to address evolving fraud risks in the modern business environment.
Sources
FAQ.
Customer fraud is the most prevalent, experienced by 35% of organisations, followed by cybercrime at 34%.
The real estate industry experiences the highest median losses, at USD435,000 per incident.
Tips are the primary detection method, accounting for 42% of fraud discoveries, followed by internal audits at 16%.
Owner/executive level fraud causes the highest median losses, at USD337,000 per incident.
The detection duration varies, but frauds lasting over 60 months result in the highest median losses of USD800,000.
Only 6% of perpetrators had prior convictions, while 87% were never charged or convicted.
The operations department accounts for 15% of frauds, making it the most susceptible department.
The most common red flags are living beyond means (39%) and financial difficulties (25%).
Cryptocurrency is most commonly used in bribery or kickback payments, accounting for 48% of cryptocurrency-related frauds.
External audits of financial statements and codes of conduct are the most common, implemented by 82% of organisations.

Maitrayee Dey has a background in Electrical Engineering and has worked in various technical roles before transitioning to writing. Specializing in technology and Artificial Intelligence, she has served as an Academic Research Analyst and Freelance Writer, particularly focusing on education and healthcare in Australia. Maitrayee's lifelong passions for writing and painting led her to pursue a full-time writing career. She is also the creator of a cooking YouTube channel, where she shares her culinary adventures. At Smartphone Thoughts, Maitrayee brings her expertise in technology to provide in-depth smartphone reviews and app-related statistics, making complex topics easy to understand for all readers.


