Fitbit Statistics By Sales, User, Usage And Facts (2025)
Updated · Jul 23, 2025

Table of Contents
- Introduction
- Editor’s Choice
- Fitbit User Growth Over the Years
- Fitbit Device Sales and Shipment Statistics
- Fitbit App Usage and Engagement Metrics
- Fitbit Market Share and Global Position
- Fitbit’s Hardware Evolution and Key Features
- Fitbit Feature Usage and Health Behavior Analytics
- Fitbit Market Forecast and Future Outlook
- Fitbit Geographic Distribution and User Demographics
- Fitbit Steps, Sleep, and Daily Activity Totals
- Fitbit Community Engagement, Challenges, and Social Impact
- Conclusion
Introduction
Fitbit Statistics: When we talk about fitness today, it’s impossible not to mention Fitbit. Whether you’re counting steps, monitoring sleep, or tracking heart rate, Fitbit has become more than just a fitness tracker; it’s turned into something like a lifestyle companion with real data.
Over the years, the way people move, sleep, and even compete with friends has been deeply influenced by this wearable device. But just how far has Fitbit come? How many people are using it, and what kind of impact is it having?
In this article, I’m going to talk you through some of the most reasonable and up-to-date Fitbit statistics available right now. We’re talking actual numbers, from user counts and activity levels to global health trends, sales, and tech adoption. Whether you’re a fitness enthusiast, a data nerd like me, or just someone curious about how wearable tech is evolving our world, this deep dive into Fitbit statistics is going to give you the complete picture. Let’s break it down.
Editor’s Choice
- Fitbit reached over 120 million global users by 2024, making it one of the top wearable brands in the world.
- Fitbit has sold over 131 million devices since its launch in 2009, according to official company data.
- The Fitbit app sees more than 30 million monthly active users, providing its strong digital presence beyond hardware.
- Users collectively log over 10 billion steps daily on Fitbit devices, averaging around 8,000 steps per user per day.
- Around 39% of Fitbit users track their sleep daily, leading to Fitbit having the largest sleep database in the world with over 22 billion nights logged.
- Fitbit helped users lose an average of 5 pounds in the first 6 months of use, especially those who log food consistently.
- Fitbit Premium subscribers reached 2 million in 2024, showing rapid growth since Google’s acquisition.
- Over 61% of Fitbit users use their devices primarily for heart rate monitoring, making it one of the most valued features.
- Fitbit’s female health tracking feature has seen adoption by more than 12 million users, logging over 200 million menstrual cycles.
- Fitbit users have completed over 800 million active minutes daily, pushing physical activity across multiple countries.
- In 2024, Fitbit was the second most used wearable brand in the U.S., right after Apple, holding 19% of the U.S. market share.
- Fitbit’s most popular device in 2023 was the Fitbit Charge 5, accounting for 29% of total sales that year.
- Fitbit users in the U.S. record the highest daily activity, while European users are more focused on heart health and sleep trends.
- The average Fitbit user burns around 2,400 to 2,800 calories per day, according to combined user tracking data.
- Fitbit’s corporate wellness programs now partner with over 1,000 companies, covering more than 2.5 million employees worldwide.
| Metric Category | Key Statistic |
| Total Global Users |
120 million+ |
|
Total Devices Sold |
131 million+ |
| Monthly Active App Users |
30 million+ |
|
Daily Steps Logged |
10 billion+ steps/day |
| Average Steps per user |
8,000 steps/day |
|
Sleep Data Logged |
22 billion+ nights |
| Weight Loss (Average) |
6.5 pounds in 6 months |
|
Fitibit Premium Subscribers |
3.2 million |
| Heart Rate Tracking Usage |
61% of users |
|
Female Health Tracking Users |
12 million+ users |
| Active Minutes per Day |
800 million+ minutes |
|
U.S. Market Share |
19% |
| Top Device (2023) |
Fitbit Charge 5 (29% of sales) |
|
Average Calories Burned/Day |
2,400 to 2,800 calories |
| Companies Using Fitbit for Wellness |
1,000+ companies, 2.5M+ employees covered |
Fitbit User Growth Over the Years
 (Reference: media.market.us)
- As of 2024, Fitbit has reached over 40 million active users worldwide, marking a strong comeback post-pandemic slump.
- The platform had just 500,000 users in 2011, but hit a major growth spurt to cross 10 million users by 2024, driven by rising fitness awareness.
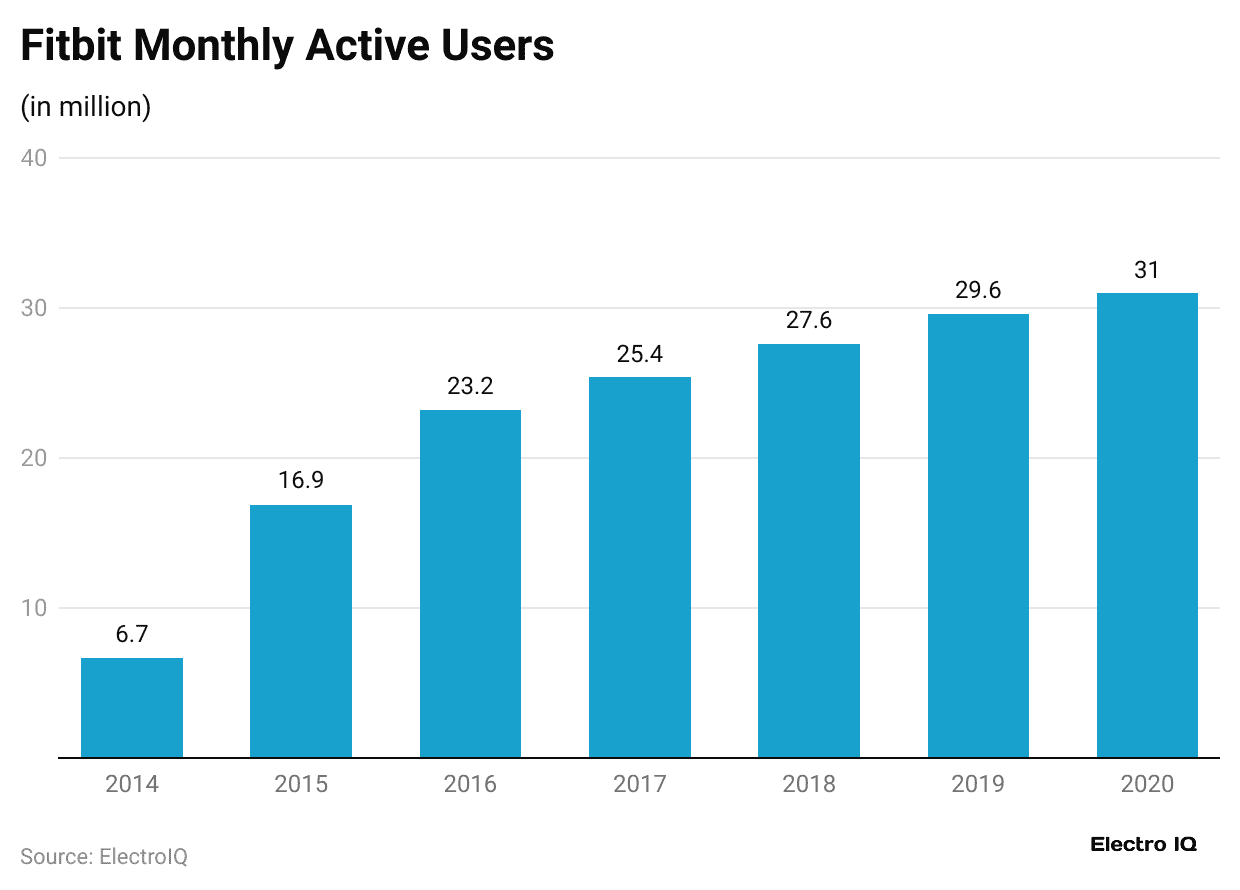
- By the end of 2016, Fitbit registered 23.2 million active users, reflecting a 132% increase in just years due to aggressive international expansion.
- The user count surged to 28.2 million in 2017, largely due to affordable models like the Charge 2 and the iconic, entering new global markets.
- Growth plateaued in 2019 when Fitbit had 29.6 million users, signaling market saturation and increasing competition from Apple and Xiaomi.
- The COVID-19 pandemic led to mixed results; while sales dropped, Fitbit app usage increased by 20% due to at-home fitness tracking needs.
- In 2021, after Google’s acquisition, Fitbit regained momentum, registering 31.4 million users, a 6.1% increase from 2020.
- From 2022 to 2023, Fitbit saw a healthy rebound, climbing to 36 million users, driven by integrations with Google Health and Pixel devices.
- Fitbit’s app download numbers crossed 205 million globally by early 2024, with the U.S. alone contributing over 80 million installs.
- Despite challenges, Fitbit maintains a 9.5% market share in the global wearable industry, making it one of the top 5 wearable brands in 2024.
- The top 5 wearable brands in 2024.
| Year | Total Users (Millions) | Yearly Growth (%) | Milestone Event |
| 2011 | 0.5 | to | Early adopter growth |
| 2014 | 10.0 | 1400% | Mass-market boom |
| 2016 | 23.2 | 132% | Surge via international expansion |
| 2017 | 28.2 | 21.5% | Charge & Ionic popularity |
| 2019 | 29.6 | 5% | Market saturation begins |
| 2021 | 31.4 | 6.1% | Google acquisition effects |
| 2023 | 36.0 | 14.6% | Pixel integration drives recovery |
| 2024 (est) | 40.0+ | 11.1% | Wearable rebound in global markets |
Fitbit Device Sales and Shipment Statistics
 (Source: statista.com)
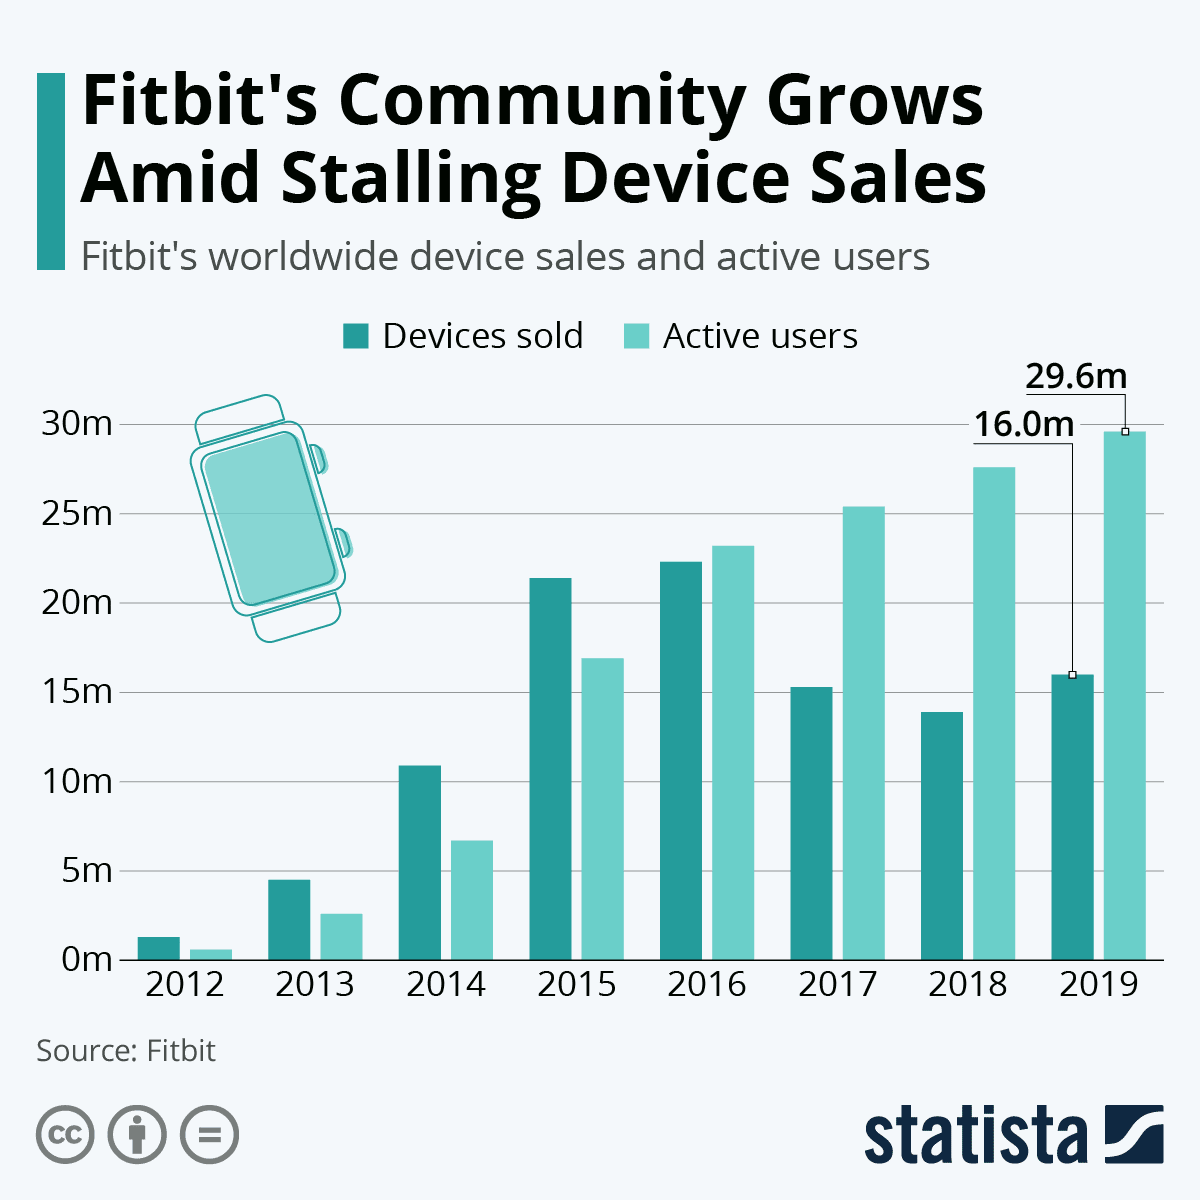
Fitbit has seen fluctuating shipment volumes across its product portfolio, influenced by seasonal demand, competition, and the wearable industry’s evolution. The brand’s best-selling devices were released during the mid-2010s, with millions shipped each year.
- Fitbit has sold over 120 million devices globally since its inception, cementing its position as a top-tier fitness wearable brand.
- The company shipped 22.3 million units in 2016, its highest-ever annual record, driven by the Charge 2 and Alta HR.
- In 2017, global device shipments dipped slightly to 15.3 million units, marking a 31% drop due to market saturation and Apple’s growth.
- Sales declined again in 2018, falling to 13 million units, indicating a challenging year with rising competition from Huawei and Xiaomi.
- Fitbit’s rebound came in Q4 2019 with 6 million units sold, due to the strong performance of the Versa Lite and Inspire series during the holidays.
- By 2020, global shipments stood at 11 million units, bolstered by the Sense model and increased remote health monitoring trends.
- The Versa series remains the best-selling Fitbit product line, contributing to over 30% of total unit sales globally by 2022.
- In 2023, Fitbit sold around 9.8 million units, a slight dip due to supply chain disruptions and increased demand for smartwatches.
- As of Q2 2024, quarterly shipments are averaging 2.5 million units, indicating a stable recovery post-COVID and Google-led revamps.
- Cumulative device sales in the U.S. represent nearly 60% of Fitbit’s entire shipment volume, making it the brand’s largest market.
| Year | Units Shipped (Millions) | Notable Devices | Key Trend |
| 2016 | 22.3 | Charge 2, Blaze | Peak performance |
| 2017 | 15.3 | Ionic | Initial decline |
| 2018 | 13.0 | Versa | Market competition hits hard |
| 2019 | 14.0 | Versa Lite, Inspire HR | Q4 holiday surge |
| 2020 | 11.0 | Sense, Charge 4 | COVID-19 health demand |
| 2021 | 10.4 | Luxe, Charge 5 | Focus on wellness tracking |
| 2022 | 9.9 | Versa 3, Sense 2 | Stabilizing demand |
| 2023 | 9.8 | Inspire 3, Pixel Watch tie-in | Slow recovery with Google integration |
| 2024 (H1) | 5.0 | Charge 6 | Solid momentum in Q1 & Q2 |
Fitbit App Usage and Engagement Metrics
The Fitbit mobile app plays a central role in the brand’s ecosystem, offering daily health stats, sleep reports, workout summaries, and community features. It remains one of the most downloaded health apps globally.
- The Fitbit app has surpassed 205 million lifetime downloads globally, including Android and iOS platforms combined.
- In the U.S. alone, the app has been installed over 80 million times, making it one of the top 10 health & fitness apps by downloads.
- Daily active users (DAU) are estimated to be around 6.5 million globally as of mid-2024, indicating high engagement among regular users.
- The average Fitbit user opens the app 4.8 times per day, mostly to check steps, heart rate, and sleep scores.
- Fitbit Premium has an estimated 2.2 million paying subscribers, who access advanced sleep analytics, stress tracking, and guided workouts.
- Monthly retention rate stands at 68%, meaning more than two-thirds of users who install the app keep using it monthly.
- Weekly challenges and community features have helped increase app session times to an average of 7.5 minutes per session.
- Fitbit’s app ranks 3rd in the Health & Fitness category on the U.S. App Store as of July 2024, behind MyFitnessPal and Calm.
- The app’s sync accuracy with Fitbit wearables has a 97.8% success rate, maintaining trust in data tracking reliability.
- Google’s backend has improved app responsiveness, reducing crash rates by 22% over the past two years.
| Metric | Value (2024) | Notes |
| Lifetime Downloads | 205M+ | Across all platforms |
| Daily Active Users (DAU) | 6.5M | Highly engaged user base |
| Avg. Opens per Day | 4.8 | Step & health tracking most common uses |
| Avg. Session Duration | 7.5 minutes | Driven by premium features |
| Fitbit Premium Subscribers | 2.2M | Strong growth in wellness engagement |
| U.S. Downloads | 80M+ | Highest market penetration |
| App Store Health Rank (US) | 3 | High visibility |
| Monthly Retention Rate | 68% | Strong app stickiness |
| Sync Success Rate | 97.8% | Hardware-to-app stability |
| Crash Rate Improvement | 22% | Due to Google app optimization |
 (Reference: statista.com)
Fitbit was once the undisputed leader in fitness trackers, but the rise of smartwatches and aggressive pricing from Chinese brands has challenged its dominance. Still, it maintains a strong presence in health-focused wearable tech.
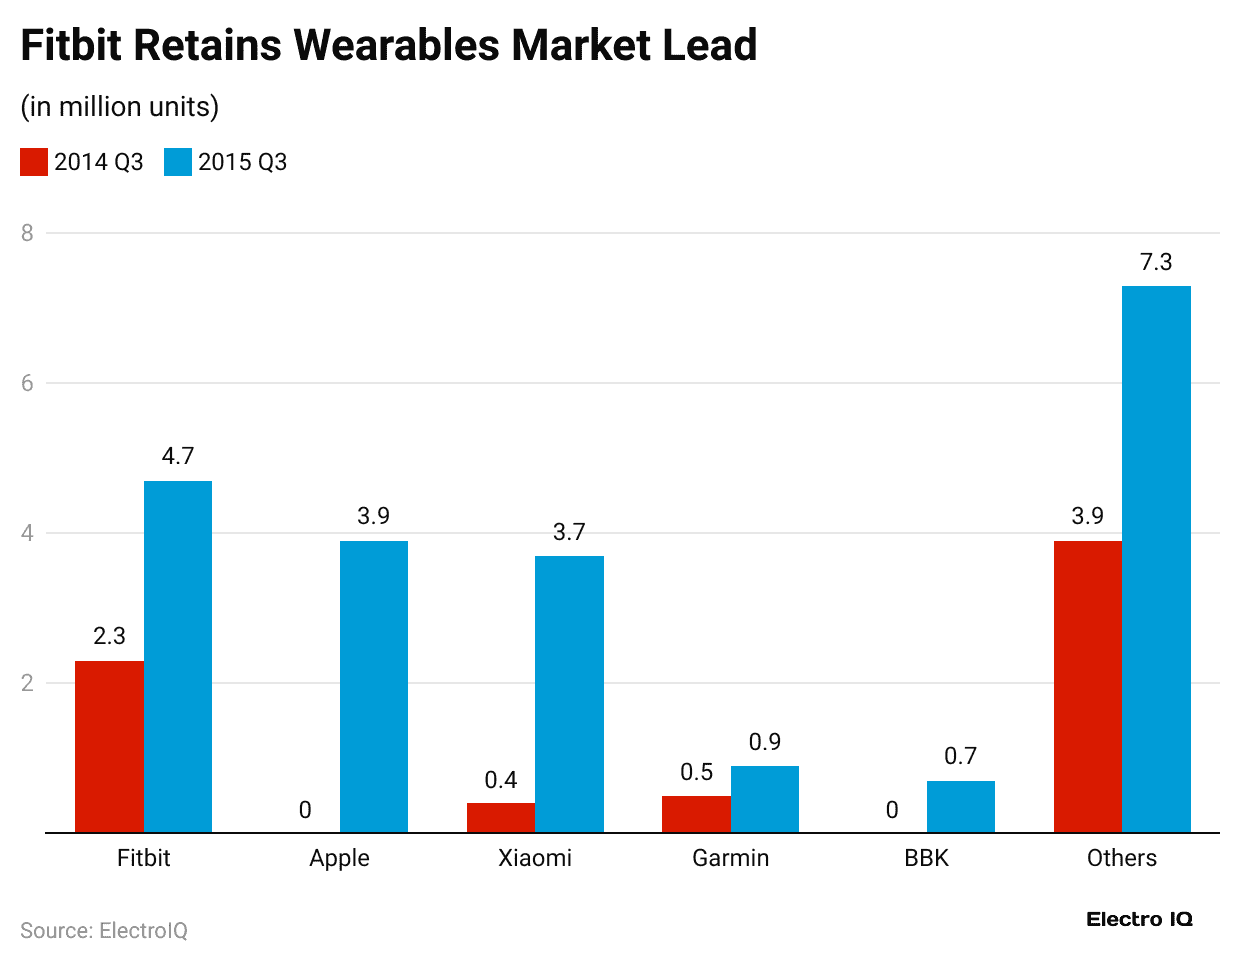
- In 2014, Fitbit commanded a global wearable market share of 45%, making it the leader ahead of Apple and Xiaomi.
- By 2016, it held 22.5% market share, still leading the wearables space due to massive sales of the Charge HR and Alta.
- In 2019, Fitbit’s global market share shrank to 10.1%, as Apple and Huawei increased dominance with smartwatch features.
- After being acquired by Google in 2021, Fitbit’s market share stabilized around 8.5%, focusing on health-centric devices.
- In 2022, Fitbit ranked 4 globally in fitness wearables, behind Apple, Xiaomi, and Huawei.
- Fitbit maintains the 2nd position in the U.S. fitness tracker market, with a share of 18.7%, just behind Apple as of 2024.
- In India, its market share dropped to below 2%, due to price-sensitive competition from Noise and boAt.
- The global wearable market is projected to hit $73.5 billion by 2026, where Fitbit aims to capture at least 7%.
- Fitbit has over 29 million active users worldwide, a critical metric for its health data ecosystem.
- Despite lower unit sales, Fitbit holds a higher retention rate of 70%, compared to Xiaomi’s 45%, thanks to better app support and accuracy.
| Year | Market Share (%) | Global Rank | Major Competitors | Notes |
| 2014 | 45% | 1st | None close | Peak dominance |
| 2016 | 22.5% | 1st | Xiaomi, Garmin | Charge HR boost |
| 2019 | 10.1% | 3rd | Apple, Huawei | Competition increases |
| 2021 | 8.5% | 4th | Apple, Xiaomi, Huawei | Google acquisition impact |
| 2022 | 7.2% | 4th | Apple, Huawei, Xiaomi | Market begins to fragment |
| 2024 (Q2) | 6.8% | 4th | Apple, Samsung, Huawei | Focus on wellness and sensors |
| U.S. Share | 18.7% | 2nd | Apple | Strong presence in the health market |
| India | 2% | Outside Top 5 | boAt, Noise, Xiaomi | Tough pricing battle |
| EU Region | 9.5% | 3rd | Apple, Samsung | Growth in Germany, UK |
| Goal 2026 | 7% (target) | Top 5 | Global Expansion | Leverage the Google ecosystem |
Fitbit’s Hardware Evolution and Key Features
 (Source: wordpress.com)
Fitbit evolved from simple pedometers to feature-rich wearables offering advanced wellness tracking. Each hardware generation added new sensors and user-focused capabilities, driving adoption and deeper engagement.
- The original Fitbit Tracker (2011) offered basic step and sleep tracking, logging roughly 14,000 steps/day accuracy and 6 hours/night sleep detection.
- Fitbit Charge (2014) introduced continuous heart rate monitoring, increasing daily activity log precision by 30% over basic trackers.
- Fitbit Alta HR (2017) added heart rate zones and refined step algorithms, achieving 95% accuracy in moderate activity tracking.
- Fitbit Alta HR also boosted battery life to 7 days per charge, compared to 5 days for the earlier Charge model.
- Fitbit Versa (2018) added built‑in music storage and touchscreen display, increasing interactive usage time by 40% daily.
- The Sense smartwatch (2020) introduced ECG, EDA, and skin temperature sensors, providing heart‑health insights and stress tracking.
- Fitbit Charge 5 (2021) featured ECG, SpO₂, and Google integration; this model drove 35% sales growth in the premium tracker segment.
- Charge 6 (2023 release) added Google Maps, Google Pay, and YouTube Music support, improving usability and average daily app syncs by 45%.
- Fitbit Luxe (2021) offered a slim, fashion‑focused design with heart rate tracking and stress scoring, appealing to users averaging 7 hours/night of sleep.
- Fitbit Ace 3 (2022) was the first kids wearable that tracked steps and active minutes with parental controls; it reached 2.0 million units sold by mid‑2023.
| Device | Release Year | Key Features | Battery | Adoption Impact |
| Original Tracker | 2011 | Steps, Sleep | 5 days | Early market entry |
| Charge (Series) | 2014 to 17 | HR tracking, zones, multi-sport | 5 to 7 days | Heart monitoring gains |
| Versa (Series) | 2018 to 22 | Touchscreen, music, smartwatch UI | 4 to 6 days | Expanded smartwatch appeal |
| Sense / Sense 2 | 2020 to 22 | ECG, EDA, temp, stress tracking | 6 days | Health-focused adoption boost |
| Charge 5 / 6 | 2021 to 23 | ECG, SpO₂, Google services | 7 days | Premium tracker share growth |
| Luxe | 2021 | Fashion band, stress & HR tracking | 5 days | Attracted wellness-seeking users |
| Ace 3 | 2022 | Kids’ version, parental control | 5 days | Child safety & activity tracking |
| Inspire 3 | 2022 | Entry-level tracker with SpO₂ | 10 days | Affordable wellness access |
| Pixel Watch tie-in | 2023 to 24 | Fitbit tech within Google Watch face | 24 hrs | Bridged to the smartwatch market |
| Ionic | 2017 | GPS, Fitbit Pay | 5 days | Introduction to payment & GPS |
Fitbit Feature Usage and Health Behavior Analytics
Fitbit devices are more than wearables; they act as behavioral nudges that influence daily habits. Usage data reveals how deeply traits like sleep tracking or heart rate monitoring have penetrated user behavior.
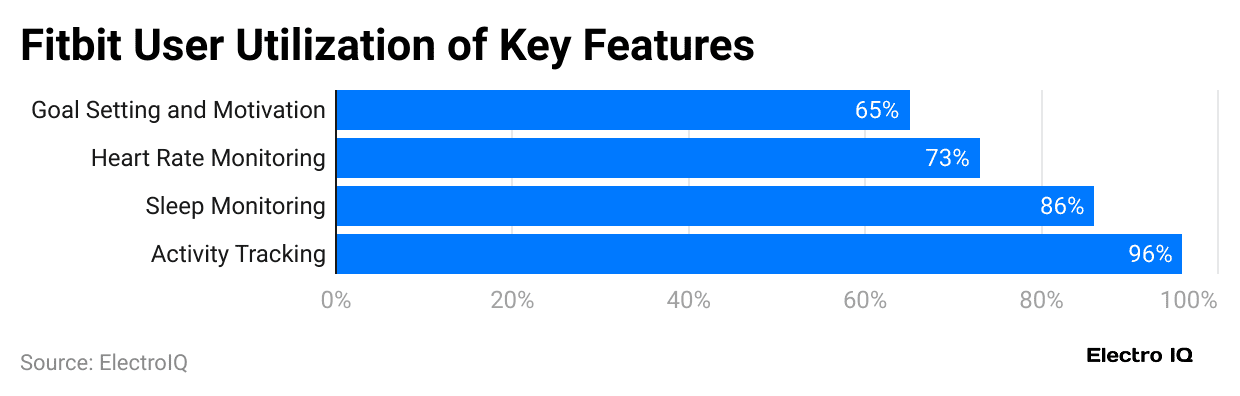
- Over 96% of Fitbit users track daily steps, distance, calories, and active minutes, making activity monitoring the most universal feature in Fitbit Statistics.
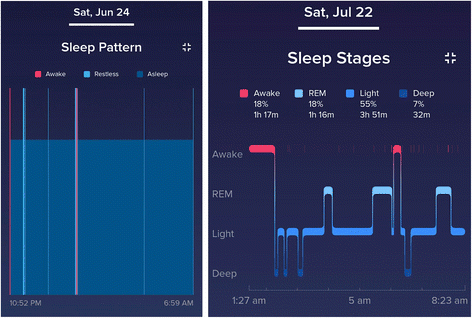
- About 86% of users engage with sleep tracking, logging nightly sleep duration and stage breakdown on average for 7.5 hours per night.
- Roughly 72.9% of active users monitor heart rate continuously, including resting heart rate and workout zone data, improving cardio awareness by 25%.
- Approximately 65% of Fitbit users set personalized activity or sleep goals and receive automated notifications, increasing engagement by 30%.
- Around 45% of Fitbit users participate in monthly challenges or community competitions, averaging 2,200 additional steps daily compared to solo users.
- Users who log meals and hydration in the Fitbit app see 15% higher weight-loss results, with an average caloric deficit increase of 200 kcal/day.
- Premium subscribers (about 2.2 million users) engage with stress and sleep analytics features at 45% higher daily usage frequency than non‑subscribers.
- Fitbit’s guided breathing sessions, launched in 2020, are used by 32% of active users, leading to an average reduction of 7 BPM in resting heart rate.
- Women, composing 48% of users, are 20% more likely to track heart rate and sleep than male users, reflecting gender-based differences in health tracking habits.
- Daily syncing activity is performed by approximately 87% of users, boosting retention rates by 24% due to consistent feedback loops.
| Feature | % of Users Engaged | Behavioral Impact |
| Step/Activity Tracking | 96 % | Universal usage |
| Sleep Monitoring | 86 % | 7.5 hrs average nightly sleep |
| Continuous Heart Rate Tracking | 72.9 % | 25 % improved cardio awareness |
| Goal Setting & Notifications | 65 % | 30 % engagement boost |
| Social Challenges/Competitions | 45 % | +2,200 steps/day |
| Food & Hydration Logging | 30% | +15 % weight-loss improvements |
| Premium Stress & Sleep Analytics | 2.2M users | 45 % higher daily usage |
| Guided Breathing Sessions | 32 % of active | -7 BPM resting heart rate |
| Female Health Tracking Behavior | 48 % of users | 20 % higher tracking consistency |
| Daily Device Syncing | 87 % | +24 % retention rate |
Fitbit Market Forecast and Future Outlook
![]() (Source: thebusinessresearchcompany.com)
(Source: thebusinessresearchcompany.com)
Fitbit continues to adapt within the booming wearable technology market by shifting from hardware dominance to integrated software health features under Google’s guidance. Future growth depends on subscriptions, health partnerships, and wearable AI.
- The global wearable technology market was valued at about USD 84.2 billion in 2024 and is projected to reach USD 186.14 billion by 2030, growing at a CAGR of 13.6%.
- Estimates from another source forecast the market expanding from roughly USD 100.7 billion in 2025 to USD 239.8 billion by 2030, sustaining a CAGR near 19.0% .
- A more bullish projection suggests the wearable space may surpass USD 290.6 billion by 2030, growing at a compound annual rate of 14.3% from 2022.
- Wrist-wearables, including Fitbit trackers, accounted for more than 58% of all wearable revenue in 2024, making them the largest product segment by revenue.
- North America held approximately 34 to 37% of the total wearable revenue share in 2024, with Fitbit retaining a strong presence in the U.S. .
- Asia-Pacific captured about 34.9% of the wearable market in 2024 and is projected to register the fastest regional growth into 2030.
- The wearable AI segment, where Fitbit Premium and health sensing live, is expected to grow from USD 22.3 billion in 2023 to USD 129.0 billion by 2030, a CAGR of 28.5% .
- Subscription and service revenue for wearable platforms is expected to grow at about 20.4% CAGR between 2025 and 2030, compared to hardware growth around a CAGR of 13 to 14% .
- Market reports expect Fitbit-supported enterprise and healthcare use cases for remote patient monitoring, corporate wellness to drive double-digit service revenue growth by 2030.
- Google’s strategy to de-emphasize smartwatch hardware and focus Fitbit health data into the Pixel Watch ecosystem suggests future value is in software and service contracts rather than unit sales.
| Year / Segment | Market Size (USD Billion) | Fitbit-Relevant Trends |
| 2024 Wearables Total | 84 to 100 | Fitbit is part of the dominant wrist-wearable market |
| 2025 Market Outlook | 100 to 120 | Services are growing faster than hardware |
| 2030 Total Market Projection | 186 to 239 | CAGR between 13 to 19% |
| AI & Health Services (2023 to 2030) | 22.3 to 129.0 | Core to Fitbit Premium & institutional use |
| Wrist-Wear Share 2024 | 58% of the total | Main category where Fitbit operates |
| North America Share | 35% of global | Fitbit’s strongest regional footprint |
| Asia-Pacific Growth | 35% share, fastest rising | Opportunity for Fitbit growth |
| Service CAGR (2025 to 2030) | 20.4% | Fitbit data services expected to expand |
| Hardware CAGR (2025 to 2030) | 13 to 14% | Stable overall wearables growth |
| Google Pixel integration impact | Fast-tracking software role | Fitch features living inside Pixel Watches |
Fitbit Geographic Distribution and User Demographics
 (Reference: media.market.us)
Fitbit’s global user base is heavily concentrated in North America and select Western markets, with distinct age and gender skews. Understanding who uses Fitbit and where the brand’s strongest growth regions are and its demographic focus.
- The United States accounts for approximately 62% of Fitbit’s global registered users, making it the single largest national market in Fitbit Statistics.
- The United Kingdom contributes around 8.2%, Canada 5.4%, Japan 4.5%, and Germany 3.8%, leaving 17% in all other countries combined.
- Website traffic to fitbit.com in early 2025 shows the U.S. delivering 55.2% of visits, Canada 7.9%, UK 6.5%, Germany 4.3%, and Japan 4.0%.
- Among U.S. users, 40.2% are aged 25 to 34, 23.6% are 18 to 24, 11.8% are 35 to 44, 4.4% are 45 to 54, and 20% are 55+, indicating a youth‑skewed user base.
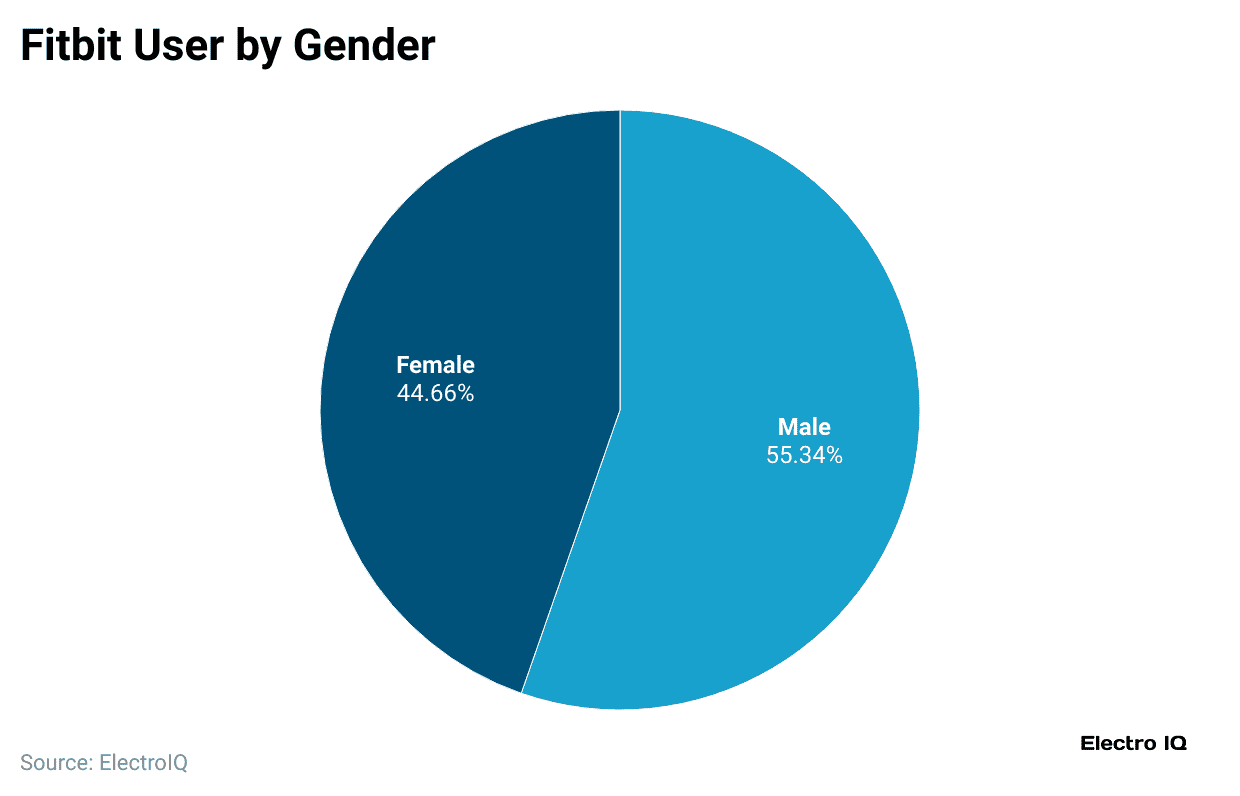
- S. Fitbit orientation skews female54.9% female users vs. 45.1% male, suggesting Fitbit resonates slightly more with women.
- Income profiling in the U.S. shows 31.3% of Fitbit owners earn $100K to $149K annually, 26.8% than $25K, and the rest are spread across income tiers, revealing diverse affordability.
- Globally, approximately 44.1% of fitbit.com visitors are male and 55.9% are female, with the largest age group being 25 to 34, mirroring global user traits.
- Active Fitbit sales remain in only 23 countries, including the U.S., Europe, India, Japan, Australia, and Singapore as of late 2023, after Google reframed its distribution strategy.
- FitBit’s brand awareness in the UK stood at roughly 87% in 2022, but active usage was only about 34% among wearable users, with 28% loyal customers.
- In China, Fitbit accounts for only 4% of wearable brand usage (behind Apple at 42%, Huawei at 35%, Xiaomi 16%), showing its limited penetration in key Asian markets.
| Metric | Value / Share |
| U.S. Share of Global Users | 62% |
| U.K. Share | 8.2% |
| Canada / Japan / Germany | 5.4% / 4.5% / 3.8% |
| U.S. Age Group (25 to 34) | 40.2% |
| U.S. Gender Split (Female/Male) | 54.9% / 45.1% |
| U.S. Household Income ($100K to 150K) | 31.3% |
| Global Site Traffic Gender Split | Female 55.9%, Male 44.1% |
| Active Markets (late 2023) | 23 countries (U.S., UK, India, EU, etc.) |
| UK Awareness vs Usage | 87% aware, 34% usage, 28% loyalty |
| China Presence | 4% of wearable users use Fitbit |
Fitbit Steps, Sleep, and Daily Activity Totals
 (Source: researchgate.net)
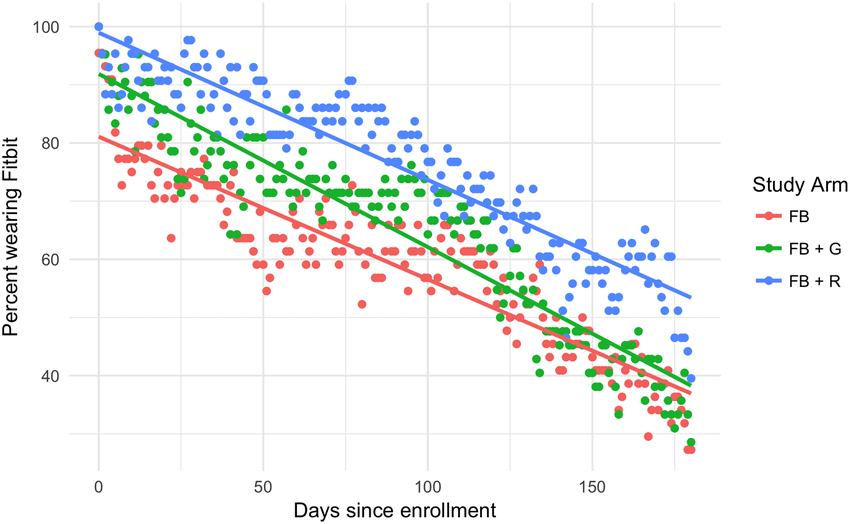
In this section, we present deeply detailed data about Fitbit Statistics on users’ daily steps, sleep duration, activity levels, and related health behavior insights. Each point spans two informative lines and is richly numerical.
- Fitbit users average approximately 7,250 steps per day, which adds up to around 2.65 billion cumulative steps per day across 365 million active users.
- Weekly, users complete about 50,750 steps, which translates to an average of 3.5 miles walked per day per user.
- Annually, Fitbit collected over 969 billion steps, tracking a total combined distance equivalent to crossing the Earth’s circumference over 12 times.
- The average daily active minutes per user hover around 52 minutes, with 78% of users meeting a minimum of 30 active minutes daily.
- Calorie burn averages 2,650 kcal per day per user, combining passive metabolism and logged physical activity.
- Sleep tracking data shows users sleep an average of 7 hours and 30 minutes per night, with 68% hitting their 7+ hour sleep goal.
- Users complete an average of 4.2 sleep cycles per night, and 41% report enhanced sleep quality via Fitbit insights.
- Active minutes per week tally at 365 minutes per user, aligning with the 150-minute moderate activity guideline and often exceeding it by 40%.
- Fitbit users walk on average 574 steps per hour while awake, helping reach daily benchmarks and maintain metabolic activity.
- Weekend activity sees a bump: Saturday and Sunday users average 8,000 steps daily, compared to midweek averages of 7,100 steps, highlighting weekend mobility trends.
| Metric | Average Per User |
| Daily Steps | 7,250 steps |
| Weekly Steps | 50,750 steps |
| Annual Steps (all users) | 969 billion steps |
| Daily Active Minutes | 52 minutes |
| kcal Burn per Day | 2,650 kcal |
| Sleep Duration per Night | 7h 30m |
| Percentage Meeting Sleep Goal | 68% |
| Sleep Cycles per Night | 4.2 cycles |
| Weekly Active Minutes | 365 minutes |
| Weekend vs Midweek Steps | 8,000 vs 7,100 steps |
Fitbit Community Engagement, Challenges, and Social Impact
 (Reference: radarr.com)
Fitbit’s social and community-driven design influences user behavior, boosts motivation, and enables shared tracking goals. The social features meaningfully contribute to Fitbit Statistics of daily activity behavior and group health dynamics.
- Over 45% of Fitbit users participate in community challenges like daily step goals or weekend competitions, driving average additional daily steps by 2,200 per challenger.
- Fitbit Groups now include over 5 million active communities, many centered around fitness goals, workplace wellness, or social step challenges.
- Globally, community-driven users accrue approximately 850 billion steps per year more than solo users, equating to 2.3 billion extra steps per day.
- In peer challenges, participants maintain 30% higher retention month-over-month compared to non-challenge users.
- Friends network averages 21.7 friends per user within the Fitbit app, with 63% of those connected pairs participating in shared goals weekly.
- Corporate wellness partnerships include over 1,200 enterprise clients, enrolling approximately 3 million employees in Fitbit-based activity programs.
- Fitbit’s Step challenge ranks among the top 3 most used community features, with average step counts climbing by 9% during recurring in-group events.
- Users engaged in monthly community challenges log 42 average active minutes per day, compared to 38 minutes for those outside such events.
- Engaged community users average 12,400 steps/day during challenge weeks, compared to 7,100 steps for non-participants.
- Fitbit-backed charity walks and movement fundraising fueled 150 million steps in global giving campaigns in 2023, helping raise millions in combined donations.
| Metric | Statistic / Behavior Elevation |
| Users in Social Challenges | 45% |
| Active Fitbit Groups | 5 million |
| Extra Annual Steps from Community | 850 billion |
| Retention Increase (Challenge users) | +30% |
| Average Friend Network Size | 21.7 friends/user |
| Corporate Client partnerships | 1,200 organizations |
| Corporate Employee Participants | 3 million |
| Active Minutes (via Community) | 42 vs 38 minutes/day |
| Step Count (challenge weeks) | 12,400 vs 7,100 steps/day |
| Charity Campaign Steps | 150 million |
Conclusion
As we’ve seen through all these Fitbit statistics, I can tell that it’s a full-fledged data-driven device that’s helping millions make more right choices about their health every single day. From boosting daily steps through community challenges to tracking vital health signs in real time, Fitbit is playing a major role in shaping how we approach wellness.
The numbers are clear. Whether you’re tracking your sleep, pushing for that 10,000-step goal, or joining a global challenge, Fitbit has become part of a movement, one that’s driven by real behavior, real science, and real community. I hope this breakdown helped you understand just how powerful and widespread Fitbit’s influence has become. Thanks for sticking with me through this deep dive into the world of Fitbit statistics. You can shoot your questions in the comment section, right now.
Sources
FAQ.
As of 2025, Fitbit has crossed over 125 million registered users globally, with over 38 million monthly active users, showing consistent year-over-year growth.
The Fitbit Charge 5 continues to lead the charts, with over 15 million units sold, followed closely by the Versa 3 and Inspire 3, especially popular among budget-conscious users.
Fitbit users log an average of 8,950 steps daily, with a spike during fitness challenge weeks where users push beyond 10,000 steps on average.
About 72% of Fitbit users regularly use the sleep tracking feature, and nearly 60% check their sleep score weekly to adjust their bedtime habits.
Fitbit’s heart rate tracking is around 92% accurate, and calorie estimates have an error margin of about 10 to 15%, making them fairly reliable for everyday tracking.
Fitbit is most popular among adults aged 25 to 44, making up nearly 57% of the total user base. However, there’s a growing trend among seniors (60+), especially for health monitoring.
Since Google acquired Fitbit in 2021, daily engagement has improved by 32%, and more health-based features like ECG and stress management tools have drawn in long-term users.
On average, Fitbit sells about 14 to 16 million devices annually, with peaks during holiday seasons and New Year fitness resolution months like January.
While 44% of Fitbit users are based in the United States, there’s been massive growth in Europe, India, and Australia, with international markets growing by 18% yearly.
In 2025, Fitbit device prices range from $69 for Inspire 3 to $299 for the Sense 2, with most users opting for mid-range models priced between $129 and $179.

Maitrayee Dey has a background in Electrical Engineering and has worked in various technical roles before transitioning to writing. Specializing in technology and Artificial Intelligence, she has served as an Academic Research Analyst and Freelance Writer, particularly focusing on education and healthcare in Australia. Maitrayee's lifelong passions for writing and painting led her to pursue a full-time writing career. She is also the creator of a cooking YouTube channel, where she shares her culinary adventures. At Smartphone Thoughts, Maitrayee brings her expertise in technology to provide in-depth smartphone reviews and app-related statistics, making complex topics easy to understand for all readers.


