Internal Revenue Service Statistics By Budget Spending, Usage, Website Traffic And Facts (2025)
Updated · Oct 01, 2025


Table of Contents
- Introduction
- Editor’s Choice
- Internal Revenue Service Statistics by Budget Spending
- Number of Federal Employees Working for the Internal Revenue Service
- TREAS Net Spending Statistics by Division
- Federal Net Spending by the Internal Revenue Service’s
- IRS Key Performance Analysis by Top Measures, 2024
- By Top Indicator Results
- IRS Website Usage Statistics
- IRS Correspondence Inventory and Late Responses
- IRS’s Website Traffic Statistics
- By Country
- By User Demographics
- By Device
- By Marketing Channels Distribution
- By Social Media
- Conclusion
Introduction
Internal Revenue Service Statistics: The Internal Revenue Service (IRS) is a U.S. government body that manages federal taxes. Formed in 1862, its main duties include collecting taxes, reviewing tax returns, issuing refunds, and carrying out audits to make sure rules are followed. Besides enforcement, the IRS also guides individuals and businesses so they can meet their tax responsibilities.
Over time, it has become one of the nation’s most significant agencies, shaping both economic policies and daily financial activities. This article looks at key statistics that show the IRS’s size, efficiency, and the role it plays in the lives of taxpayers across the United States.
Editor’s Choice
- According to usafacts.org, in the financial year 2024, the Internal Revenue Service spent USD 230 billion.
- This made up 17.4% of the Treasury’s USD 1.3 trillion budget, or 19.5% of federal spending.
- As of 2024, the Internal Revenue Service accounted for the largest net spending within the Department of the Treasury, reaching about USD 230 billion.
- In 2024, the IRS made up 3.4% of the total federal government spending.
- In the same duration, states and local governments received 7.9% of the Internal Revenue Service’s total spending.
- Besides, the Internal Revenue Service employed 99,001 federal workers, marking a 4.8% increase since 2010.
- As mentioned on irs.gov, in FY 2024, the IRS supported 62.2 million taxpayers through phone, mail, and in-person help.
- Its volunteer programs, with 72,367 volunteers, prepared nearly 2.8 million tax returns.
- The Taxpayer Advocate Service handled 256,737 new cases and resolved 232,504 overall.
- Additionally, the IRS reviewed 136,323 applications for tax-exempt status and approved 87% of them.
- The IRS collected USD 565.1 billion in business income taxes before refunds.
- Around 219.9 million forms were filed electronically, making up 82.5% of total filings, with 93.3% of individual returns filed online.
- The agency issued 117.6 million refunds worth over USD 461.2 billion, including 14.3 million with the child tax credit and 21.4 million with the earned income tax credit.
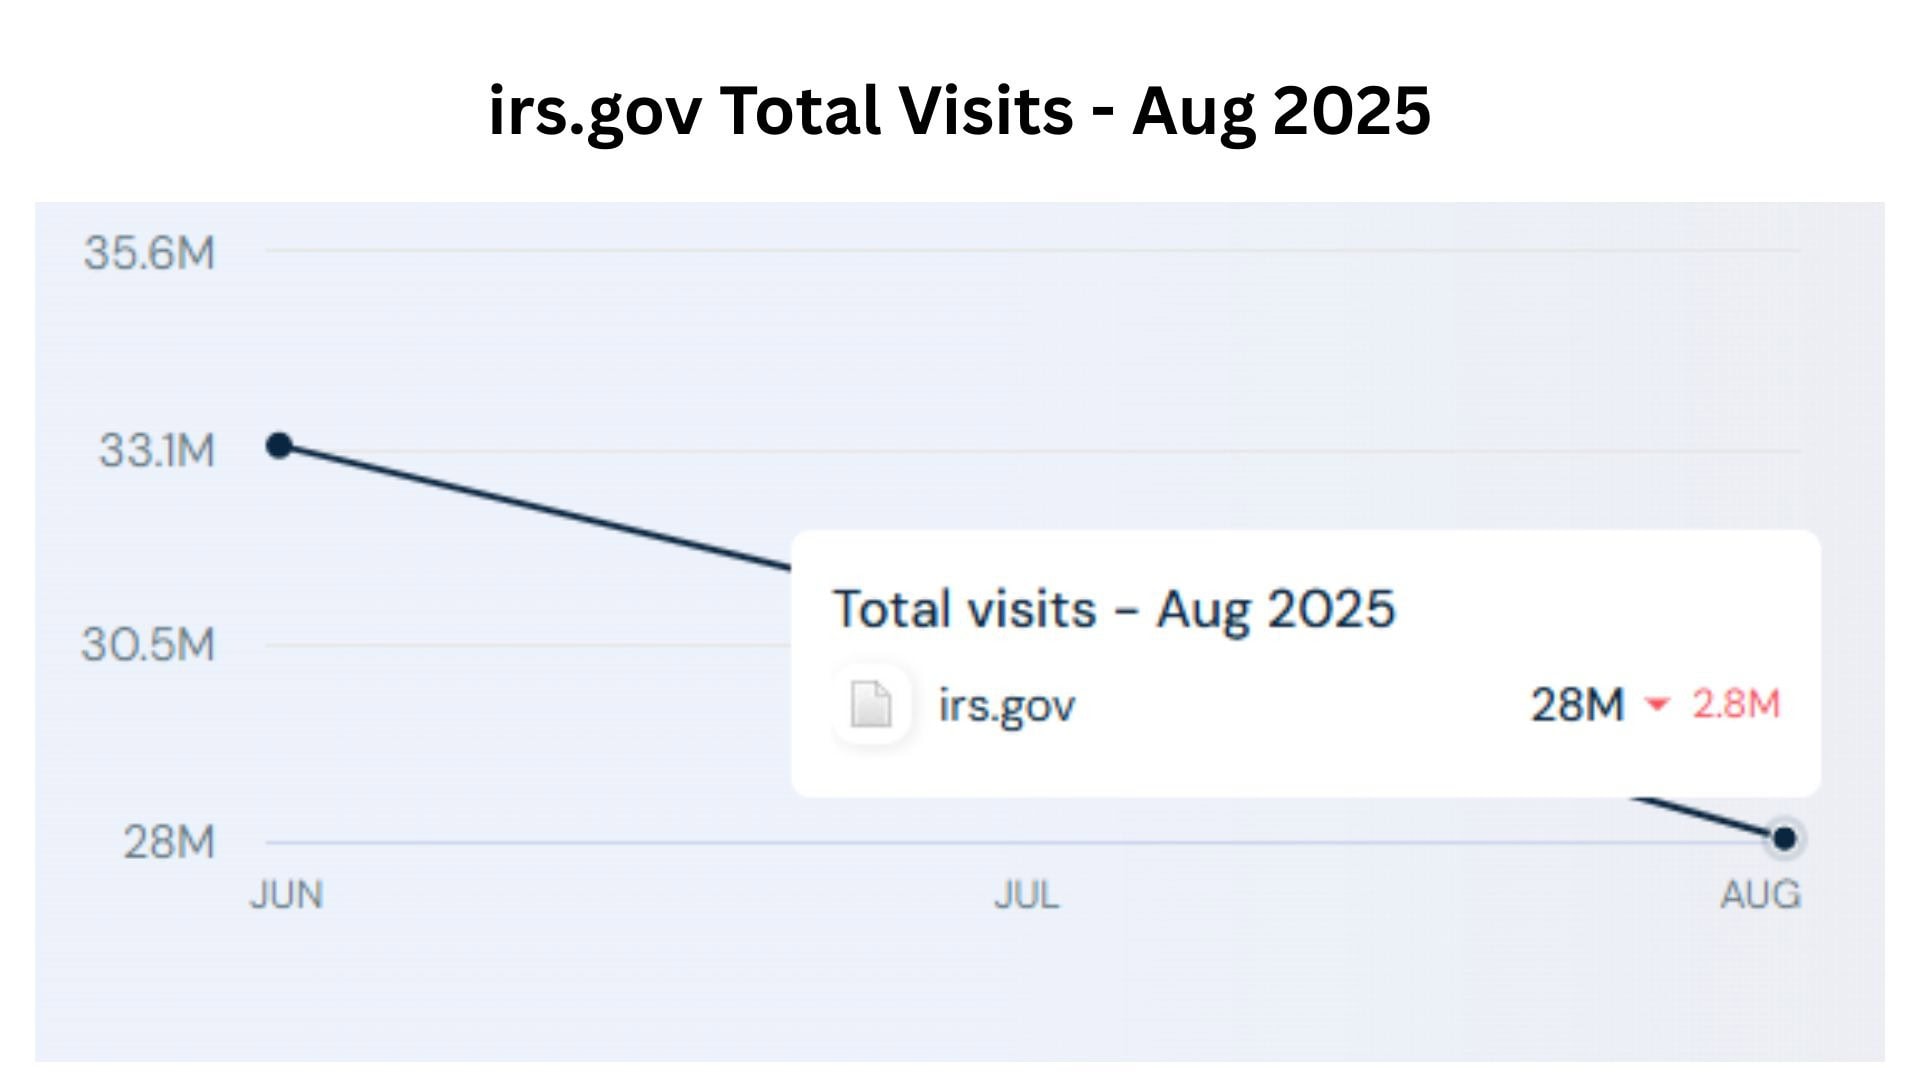
- According to Similarweb reports, in August 2025, the total number of visits to irs.gov was approximately 28 million, representing a 9.05% decrease from the previous month.
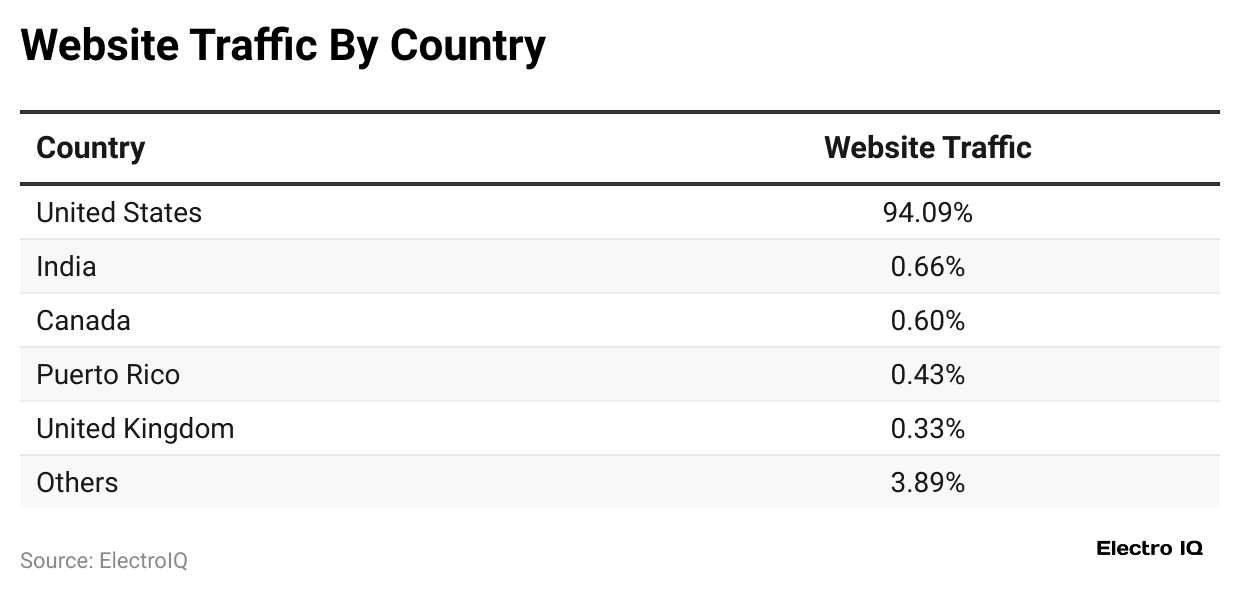
- The United States of America accounted for the highest share of the IRS website, at 94.09%.
- The total number of IRS website users aged 25 to 34 years accounted for the highest share, at 22.9%.
- The top traffic sources for irs.gov were direct search with a traffic share of 48.28%, followed by organic search (45.25%).
- On irs.gov, about 33.68% of visits come from desktops, while 66.32% are from mobile devices.
Internal Revenue Service Statistics by Budget Spending
 (Source: usafacts.org)
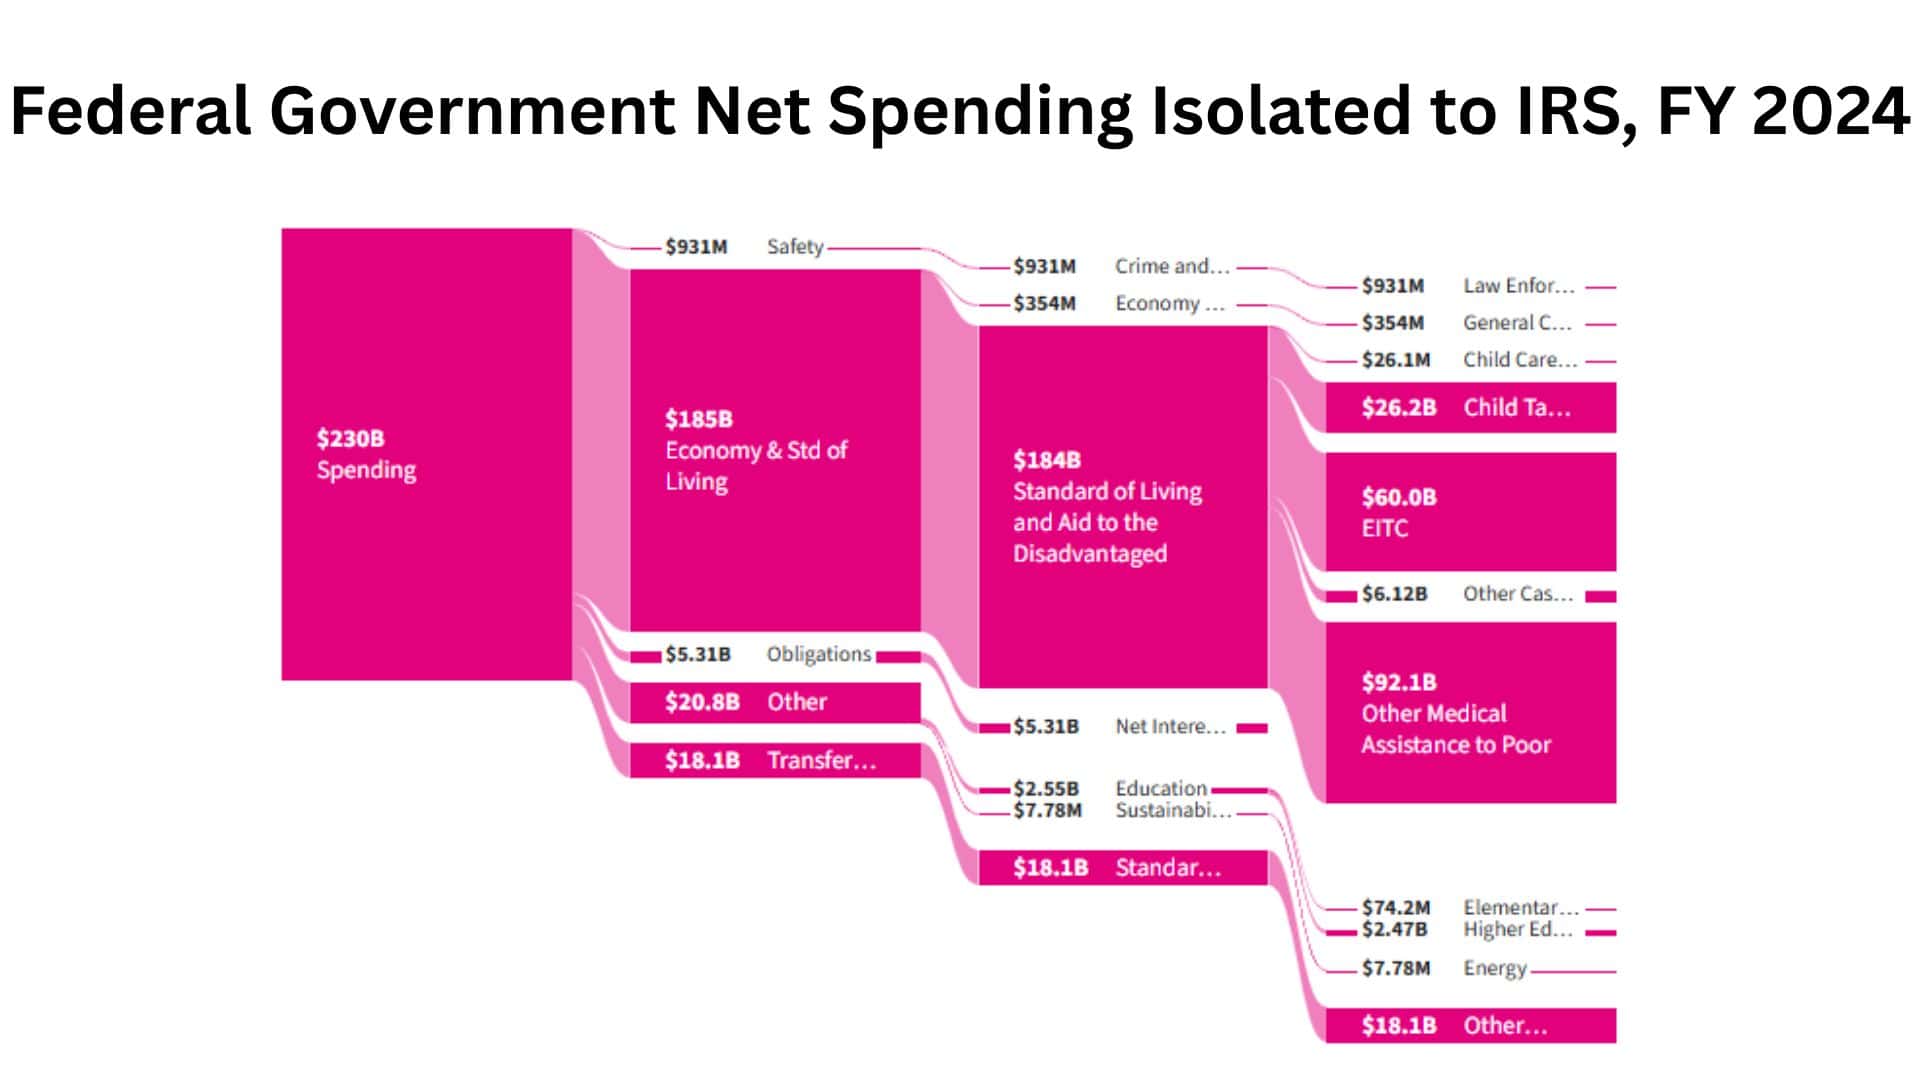
- In 2024, the Internal Revenue Service (IRS) managed a budget of USD 230 billion.
- About USD 185 billion was spent in this area, including USD 148 billion for supporting living standards and aid for disadvantaged groups.
- A large portion went to programs like the Earned Income Tax Credit (USD 60 billion), Child Tax Credit (USD 26.2 billion), and medical assistance for people experiencing poverty (USD 92.1 billion).
- Other allocations included USD 931 million for safety, USD 5.31 billion for net interest, and USD 18.1 billion for other categories.
Number of Federal Employees Working for the Internal Revenue Service
 (Reference: usafacts.org)
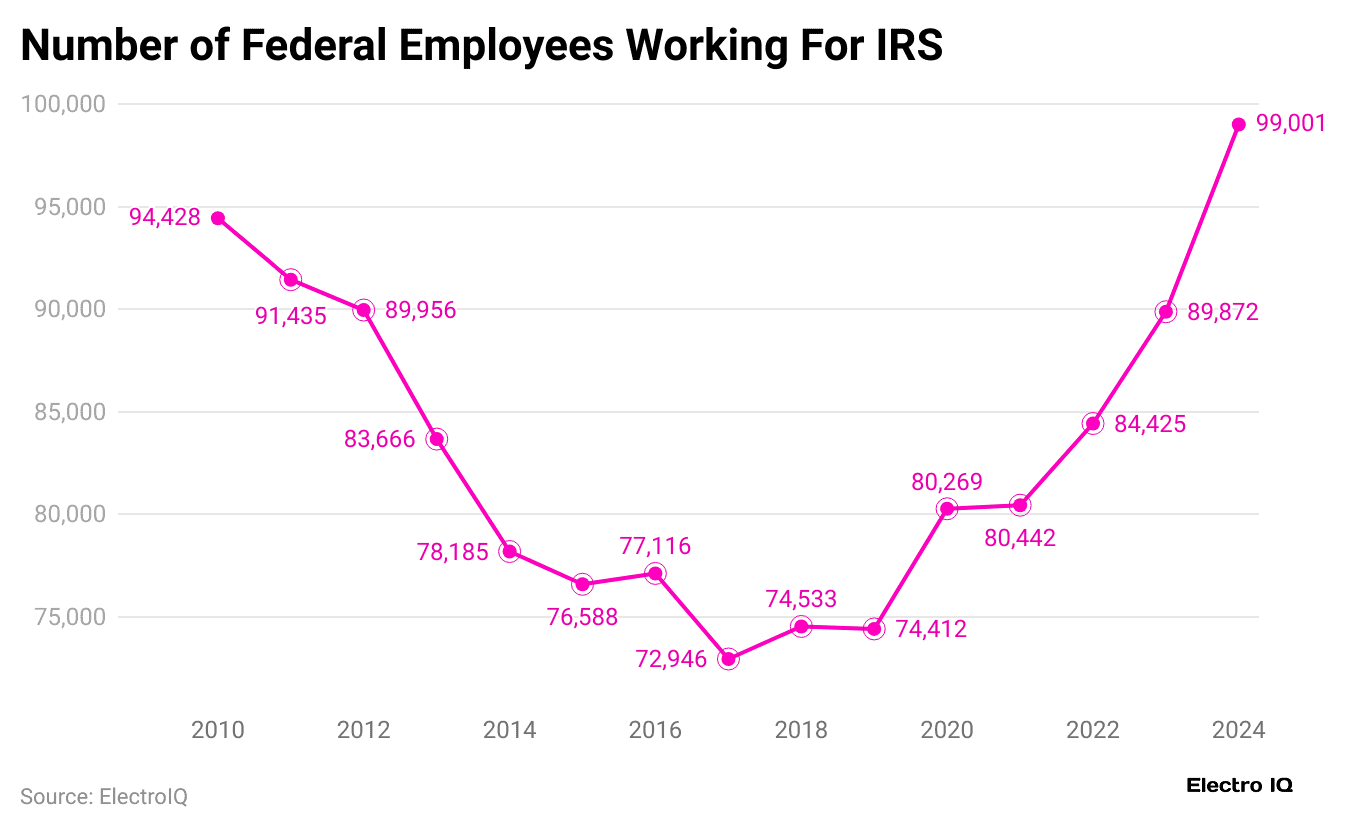
- In 2024, the Internal Revenue Service sector employed 99,001 federal workers, which is an 8% increase since 2010.
- The latest data shows that the IRS makes up 4.3% of the workforce, which is higher than its 3.4% share of the budget.
Furthermore, other historic employee counts in the IRS are mentioned in the table below:
| Year | Employee Count |
| 2023 |
89,872 |
|
2022 |
84,425 |
| 2021 |
80,442 |
|
2020 |
80,269 |
| 2019 |
74,412 |
|
2018 |
74,533 |
| 2017 |
72,946 |
|
2016 |
77,116 |
| 2015 |
76,588 |
|
2014 |
78,185 |
| 2013 |
83,666 |
|
2012 |
89,956 |
| 2011 |
91,435 |
|
2010 |
94,428 |
TREAS Net Spending Statistics by Division
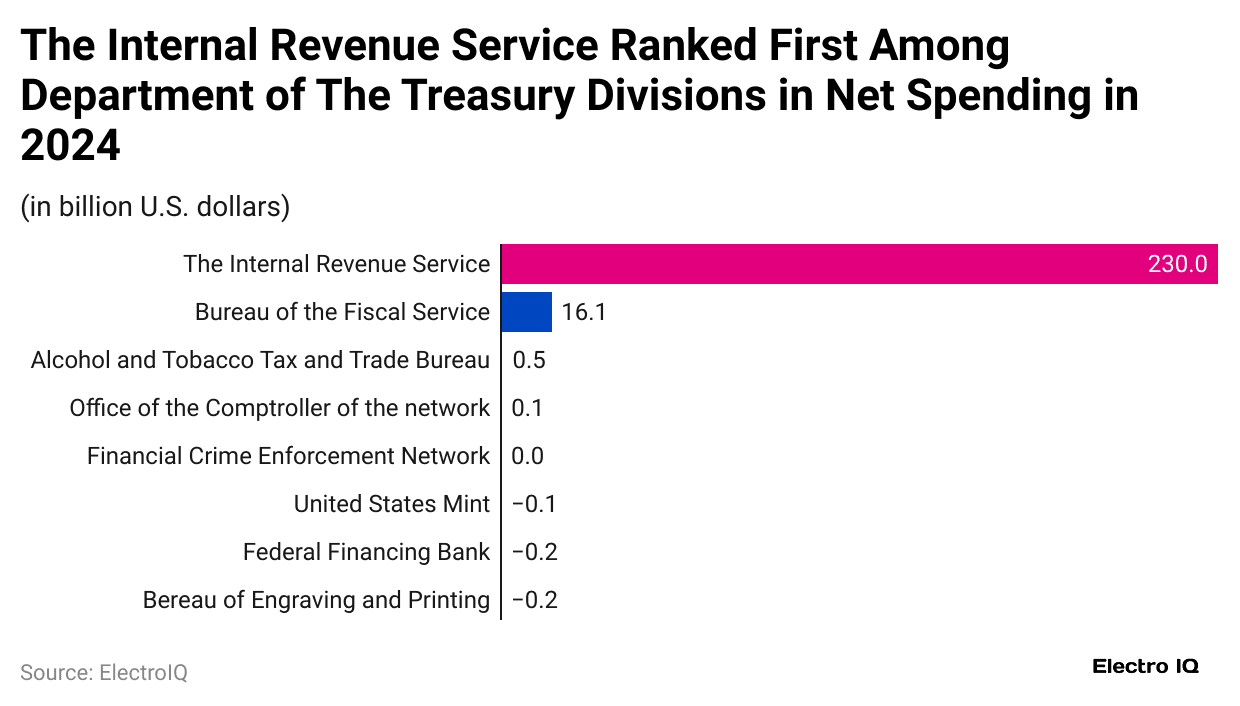
- As of 2024, the Internal Revenue Service accounted for the largest spending in the Department of the Treasury, resulting in USD 230 billion.
- The Bureau of the Fiscal Service followed with USD 16.1 billion.
- Meanwhile, the Alcohol and Tobacco Tax and Trade Bureau and the Office of the Comptroller of the Currency recorded USD 0.5 billion and USD 0.1 billion, respectively.
- The Financial Crimes Enforcement Network remained at zero spending.
- On the other hand, some agencies such as the United States Mint, the Federal Financing Bank, and the Bureau of Engraving and Printing posted negative net spending, ranging from USD (- -0.1 to -0.2) billion.
Federal Net Spending by the Internal Revenue Service’s
 (Source: usafacts.org)
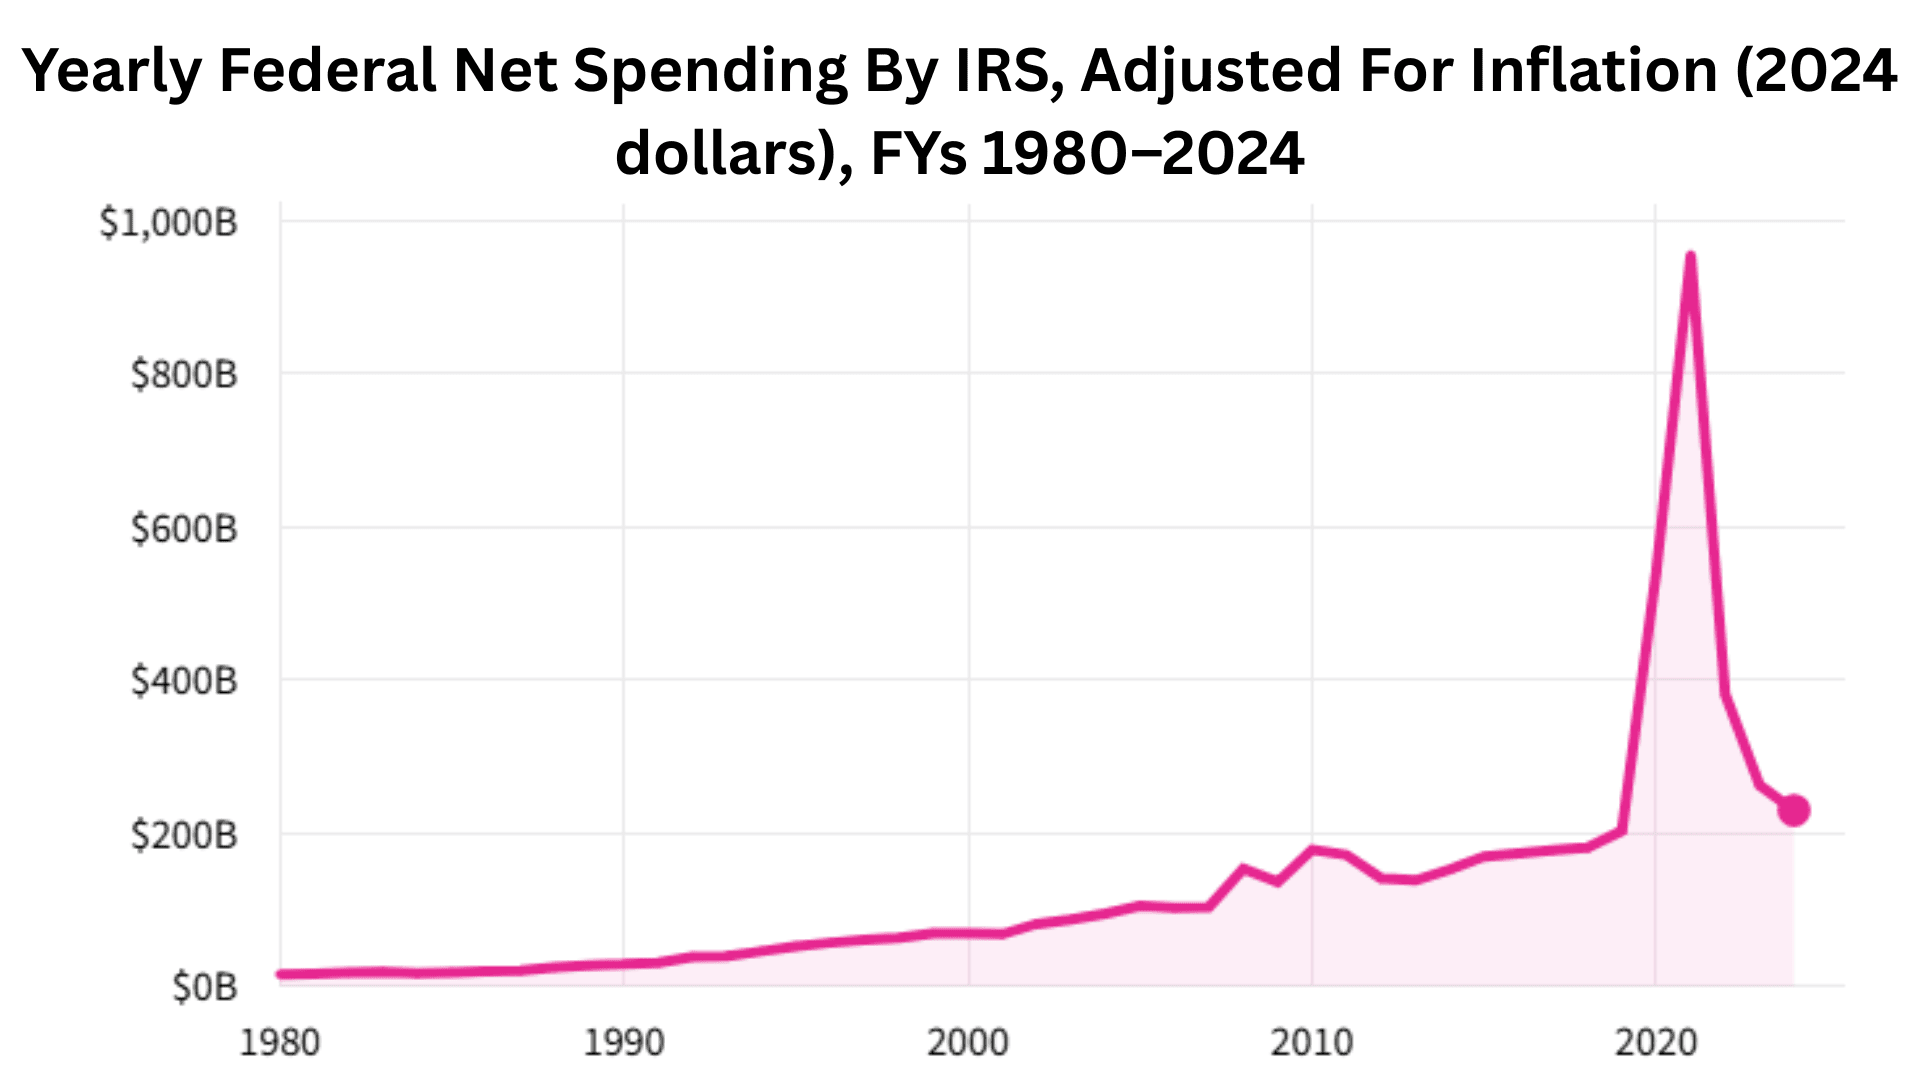
- The above graph shows that, when adjusted for inflation, IRS federal spending rose from USD 16 billion in 1980 to USD 230 billion in 2024.
- Since 1980, IRS spending has grown by 1,335%, while total government spending rose 193.7%.
- In 2024, the IRS made up 3.4% of the total federal government spending.
Furthermore, other historic numbers are stated in the table below:
| Year | Spending (USD billion) | Spending Share |
| 2023 | 262.8 | 4.1% |
| 2022 | 381.3 | 5.5% |
| 2021 | 955.3 | 11.9% |
| 2020 | 542.2 | 6.8% |
| 2019 | 203.3 | 3.7% |
| 2018 | 181.2 | 3.5% |
| 2017 | 178.3 | 3.5% |
| 2016 | 173.6 | 3.4% |
| 2015 | 169.6 | 3.4% |
| 2014 | 153.2 | 3.3% |
| 2013 | 138.6 | 3% |
| 2012 | 141.3 | 2.9% |
| 2011 | 171.9 | 3.4% |
| 2010 | 178.6 | 3.6% |
| 2009 | 136.8 | 2.6% |
| 2008 | 153.7 | 3.5% |
| 2007 | 104 | 2.5% |
| 2006 | 103.1 | 2.5% |
| 2005 | 105.3 | 2.6% |
| 2004 | 95.5 | 2.4% |
| 2003 | 87.7 | 2.3% |
| 2002 | 81.8 | 2.1% |
| 2001 | 68.4 | 2.1% |
| 2000 | 69.3 | 2.1% |
IRS Key Performance Analysis by Top Measures, 2024
| Metrics | Target | Actual |
| Customer Service Representative Level of Service | 60% | 65.1% |
| Level of Service (A) | 65% | 76.5% |
| Customer Accuracy – Tax Law (Phones) | 90% | 90.4% |
| Customer Accuracy – Accounts (Phones) | 89% | 90.2% |
| Timeliness of Critical Individual Filing Season Tax Products to the Public | 89% | 96.6% |
| Timeliness of Critical Tax Exempt and Government Entities & Business Tax Products to the Public | 87% | 94.8% |
| Enterprise Self-Assistance Participation Rate | 94% | 95.8% |
By Top Indicator Results
| Key Indicators | Actual Valuations | |
| 2023 | 2024 | |
| Taxpayers are satisfied with the IRS | 75 | – |
| Total ending inventory (in thousands) | 2,923 | 3,242 |
| Share of closures compared to receipts | 93.8% | 96.5% |
IRS Website Usage Statistics
 (Reference: irs.gov)
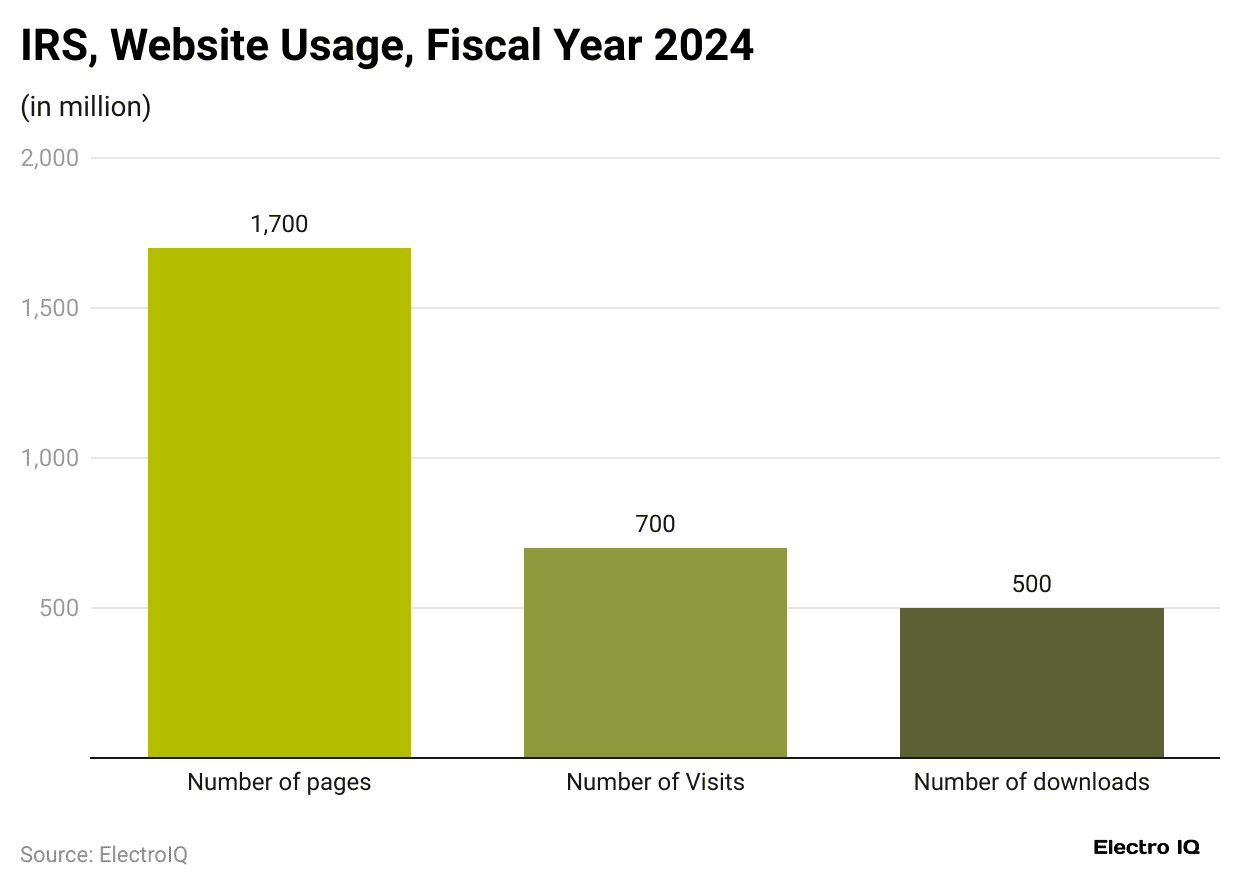
- As of 2024, the IRS website recorded 1.7 billion page views.
- It also had about 700 million visits, while the number of file or document downloads reached nearly 500 million.
IRS Correspondence Inventory and Late Responses
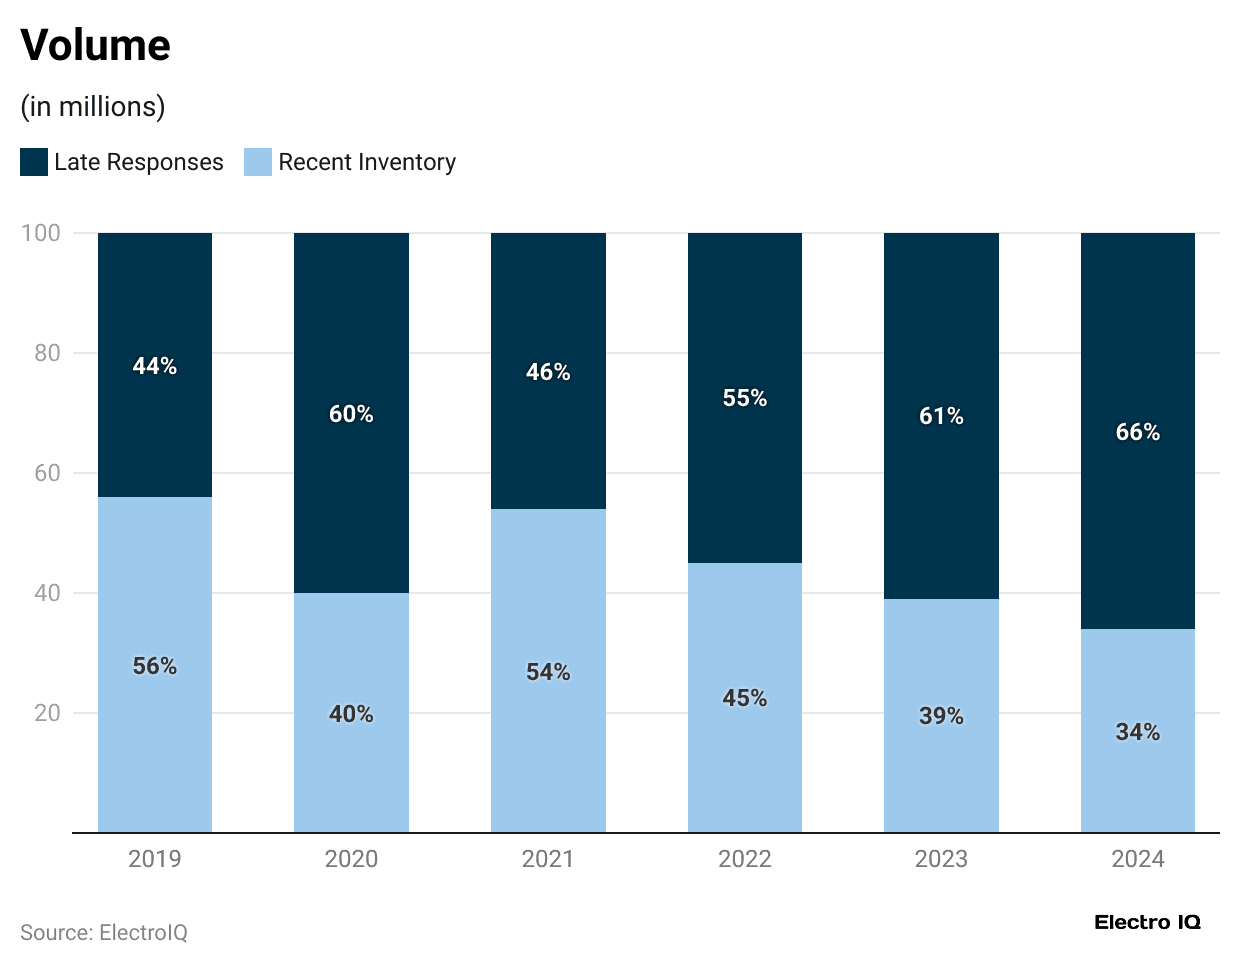
- In 2019, there were about 2 million cases, with 44% late responses.
- As of 2021, the volume increased to around 6 million, with 55% late responses.
- Meanwhile, in 2022 and 2023, there were around 7 million cases, with 45% and 39% recent inventory, respectively.
- In 2024, the total inventory reached 6 million, and 66% of cases were late responses.
IRS’s Website Traffic Statistics
 (Source: similarweb.com)
- As of August 2025, the total number of visits to irs.gov was around 28 million, with a decrease of 9.05% from the previous month.
- The bounce rate of the website accounted for 37.69% in the same period.
- Meanwhile, the average number of pages per visit was 5.32, and the average visit duration was 5 minutes and 17 seconds.
- Moreover, the IRS’s website ranks globally at #1,369, while in the United States ( #289), and within its category ( #6).
By Country
 (Reference: similarweb.com)
- The United States of America accounted for the highest share of the IRS website, at 94.09%, in August 2025, representing a 9.53% decrease from the previous month.
- The following are the top five countries by website traffic share: India: 0.66% +4.53%3), Canada: 0.6% (+1.93%), Puerto Rico: 0.43% (-14.14%), United Kingdom: 0.33% (-7.96%).
- The rest of the countries captured a share of 3.89% the IRS.gov website traffic.
By User Demographics
 (Reference: similarweb.com)
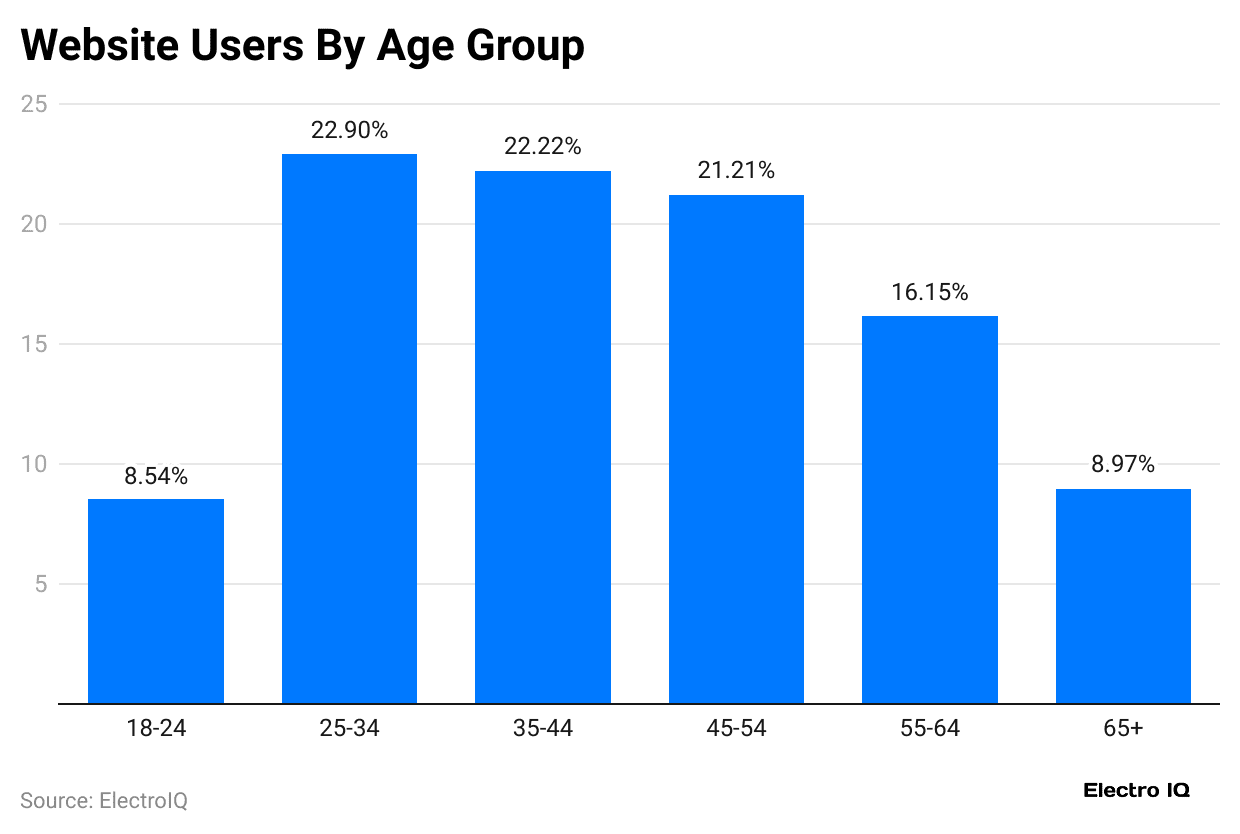
- In the same period, the total number of IRS website users aged 25 to 34 years accounted for the highest share, at 22.9%, followed by those aged 35 to 44 years at 22.22%.
- Furthermore, the age distribution of other users is as follows: 45 to 54 years (21.21%), 55 to 64 years (16.15%), 65 years and older (8.97%), and 18 to 24 years (8.54%)
- Based on gender, approximately 54.65% of IRS users were female, and 45.35% were male.
By Device
 (Source: semrush.com)
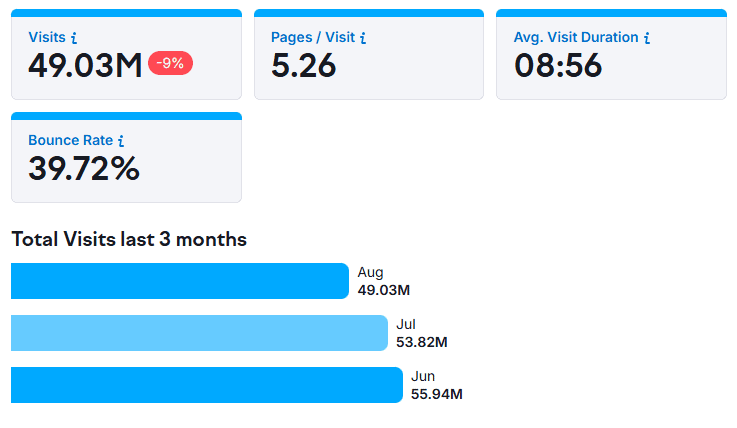
- The above graph states that in August 2025, irs.gov received 49.03 million visits, with the bounce rate accounting for 39.72%
- The average visit duration was 8 minutes and 56 seconds, and the average number of pages per visit was 4.45.
- On irs.gov, about 33.68% of visits come from desktops, while 66.32% are from mobile devices.
| Country | Visitor’s Share | All devices | Desktop | Mobile |
| United States | 95.77% | 46.96M | 32.36% | 67.64% |
| India | 0.58% | 284.79K | 50.53% | 49.47% |
| Canada | 0.3% | 145.19K | 83.72% | 16.28% |
| United Kingdom | 0.23% | 113.7K | 59.64% | 40.36% |
| Mexico | 0.23% | 112.81K | 33.99% | 66.01% |
By Marketing Channels Distribution
 (Source: similarweb.com)
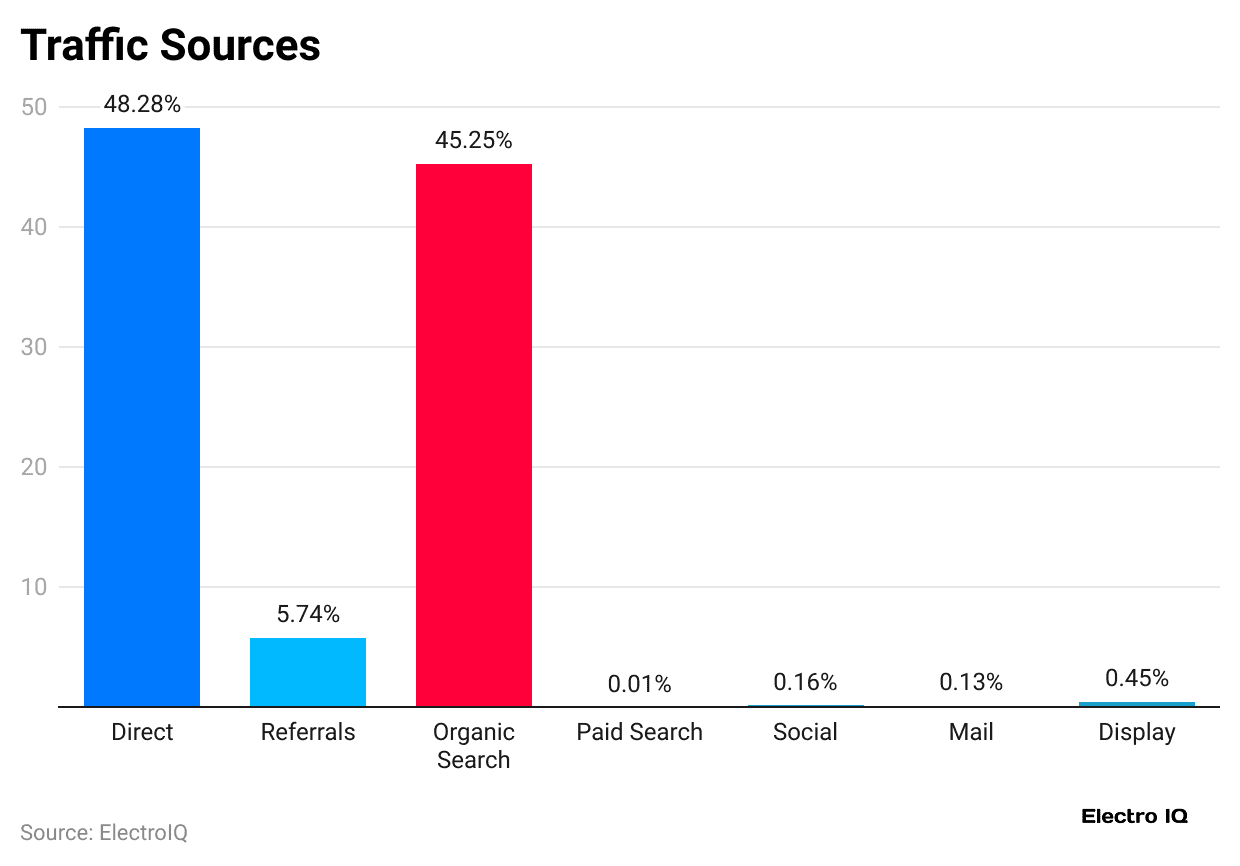
- According to Similarweb reports, in August 2025, the top traffic sources for irs.gov were direct search with a traffic share of 48.28%, followed by organic search (45.25%).
- Moreover, other marketing channel distributions are followed by referrals (5.74%), paid search (<0.01%), social (0.16%), mail (0.13%), and display (0.45%).
By Social Media
 (Reference: similarweb.com)
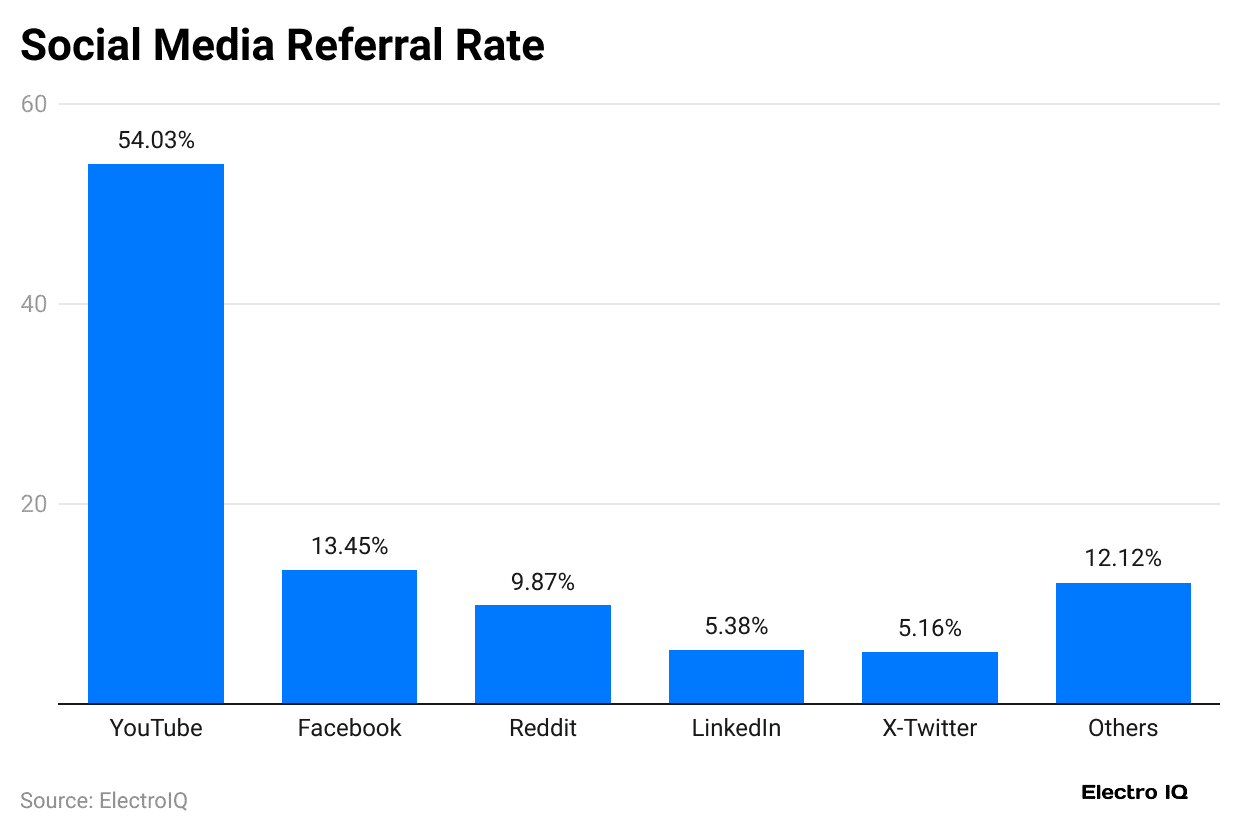
- At the same time, the social network traffic accounted for by the IRS websites remained the highest on YouTube, holding shares of 50.03%, followed by Facebook with a share of 13.45%.
- Other social media traffic sources include Reddit (9.87%), LinkedIn (5.38%), X-twitter (5.16%), and the rest (12.12%).
Conclusion
After completing the article on the Internal Revenue Service Statistics, it can be concluded that the IRS is an effective part of the financial system of America, making sure taxes are collected and laws are applied fairly. It handles tax returns, gives refunds, checks compliance through audits, and provides help to taxpayers. The numbers linked to the IRS show how large its work is and the challenges it faces.
Looking at these statistics helps people and businesses understand the role the IRS plays in daily finances and national policies. In the end, the IRS is not just about taxes, as it is a central agency that keeps the U.S. economy running smoothly.
FAQ.
Most individuals and businesses earning income in the United States are required to file taxes.
The IRS provides guidance, resources, and programs to help individuals and businesses meet tax responsibilities.
The IRS handles about 155 million returns yearly and issues 1.6 million math error notices.
After processing an amended return, the IRS sends a refund, usually within 8 to 12 weeks.
In fiscal year 2024, the IRS collected more than $5.1 trillion in federal tax revenue.

Maitrayee Dey has a background in Electrical Engineering and has worked in various technical roles before transitioning to writing. Specializing in technology and Artificial Intelligence, she has served as an Academic Research Analyst and Freelance Writer, particularly focusing on education and healthcare in Australia. Maitrayee's lifelong passions for writing and painting led her to pursue a full-time writing career. She is also the creator of a cooking YouTube channel, where she shares her culinary adventures. At Smartphone Thoughts, Maitrayee brings her expertise in technology to provide in-depth smartphone reviews and app-related statistics, making complex topics easy to understand for all readers.