iPhone vs Android User Statistics and Facts
Updated · Nov 07, 2025

Table of Contents
- Introduction
- Editor’s Choice
- Mobile Operating System Share
- Apple Revenue Worldwide
- iOS Market Share
- iOS Version by Market Share
- Leading iPhone Apps
- Free vs Paid Android Apps
- Android Phone’s Average Price
- Android Version By Market Share
- Tablet Shipment Worldwide
- iOS Version History
- Android Version History
- Android vs iOS Comparison
- Conclusion
Introduction
iPhone vs Android User Statistics: In the dynamic world of mobile technology, the rivalry between iPhone and Android has shaped the global smartphone landscape for over a decade. Going through the iPhone vs Android User Statistics, we can dive deep into the intricate statistics and comparative insights of two dominant mobile operating systems that have transformed how we communicate, work, and interact with technology.
Accordingly, we will be able to understand key metrics such as market share, device pricing, app availability, and technological advancements.
Editor’s Choice
- Android dominates the global market share at 71.65% as of Q1 2024.
- Global mobile subscriptions reached 8.8 billion in 2023.
- The United States leads with 503 5G-enabled cities.
- South Korea boasts the highest 5G download speed at 432.5 Mbps.
- Apple‘s revenue soared to 383.23 USD billion in 2023.
- iOS market share stabilized around 20.7% in Q1 2024.
- iOS 17.0 is the most prevalent version, with 62.47% usage.
- DouYin leads iPhone app downloads with 372.08 million.
- 98% of Android apps are free.
- The average Android smartphone price is 305 USD.
- Android 14 holds 31.14% market share.
(Reference: statista.com)
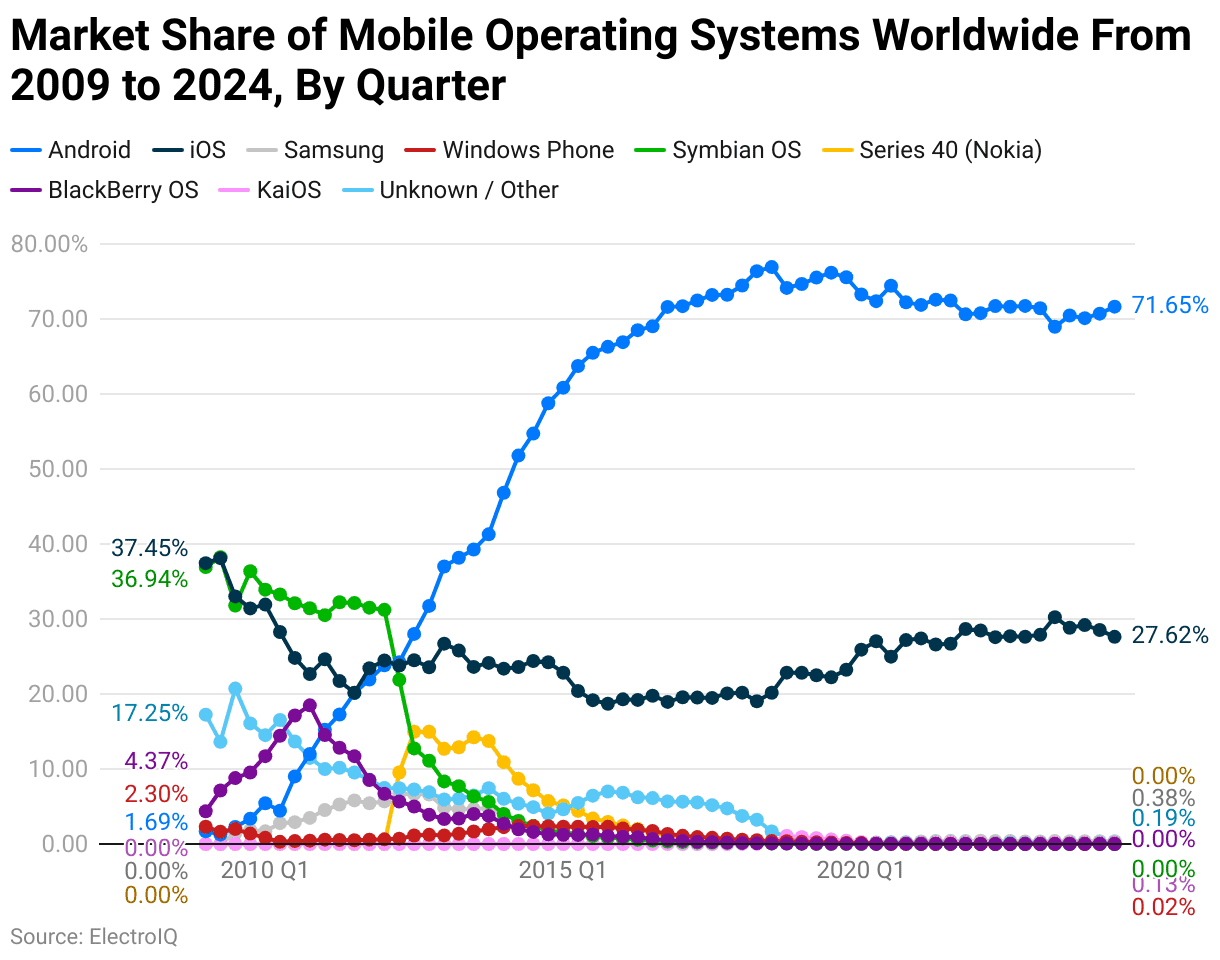
- iPhone vs Android User Statistics show that Android has been the leading operating system in market share for a considerable time.
- In Q1 2009, iOS was the leading smartphone OS with a 37.45% market share, and Android’s market share was 1.69%.
- As of Q1 2024, Android’s market share was 71.65%, and iOS’s market share was 27.62%.
Apple Revenue Worldwide
(Reference: statista.com)
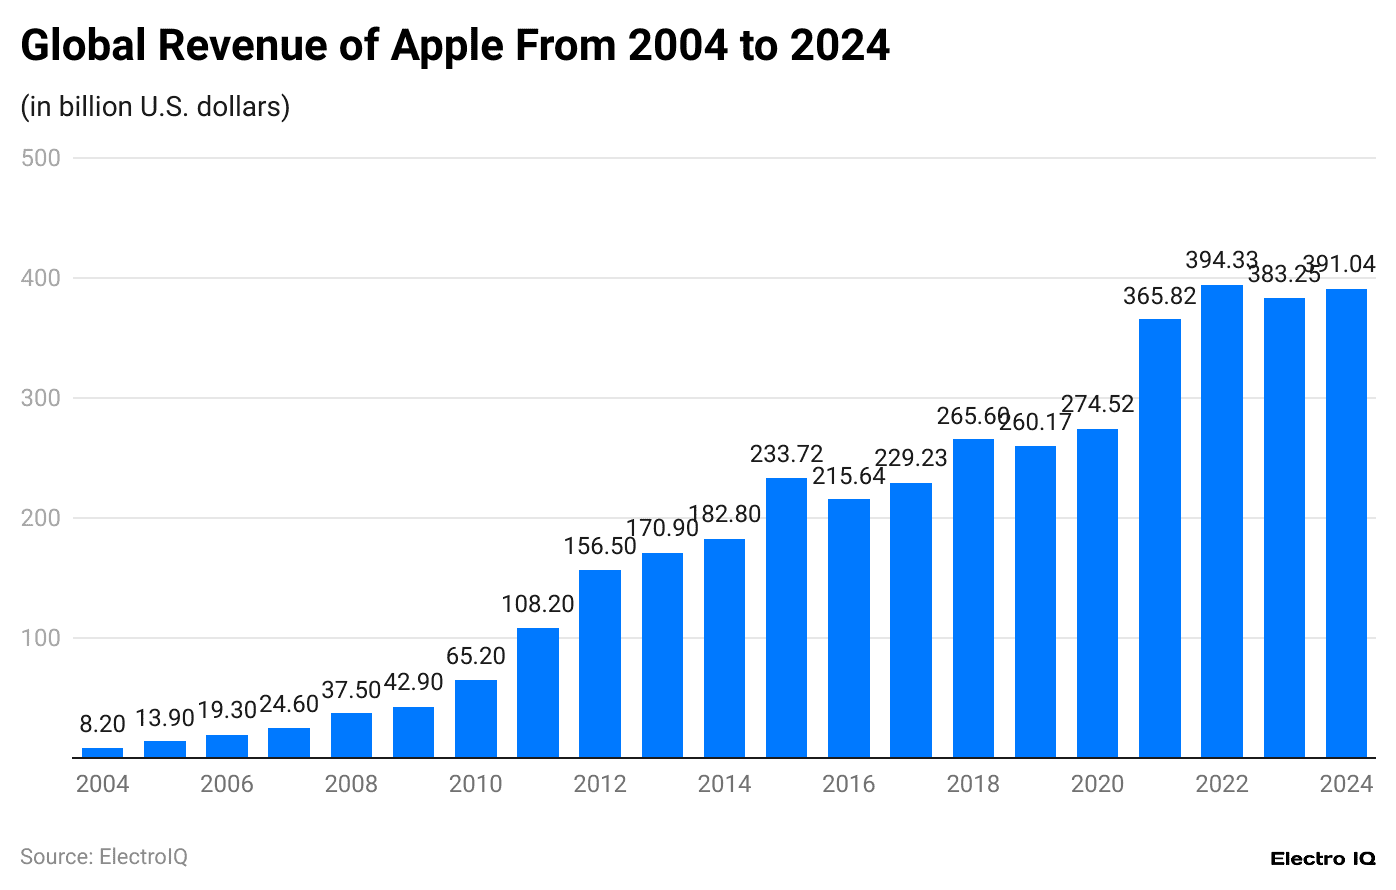
- iPhone vs Android User Statistics show that Apple’s revenue has steadily increased.
- In 2004, the iPhone generated revenue of 8.2 billion USD.
- By the end of 2023, Apple’s revenue was 383.23 billion USD.
(Reference: statista.com)
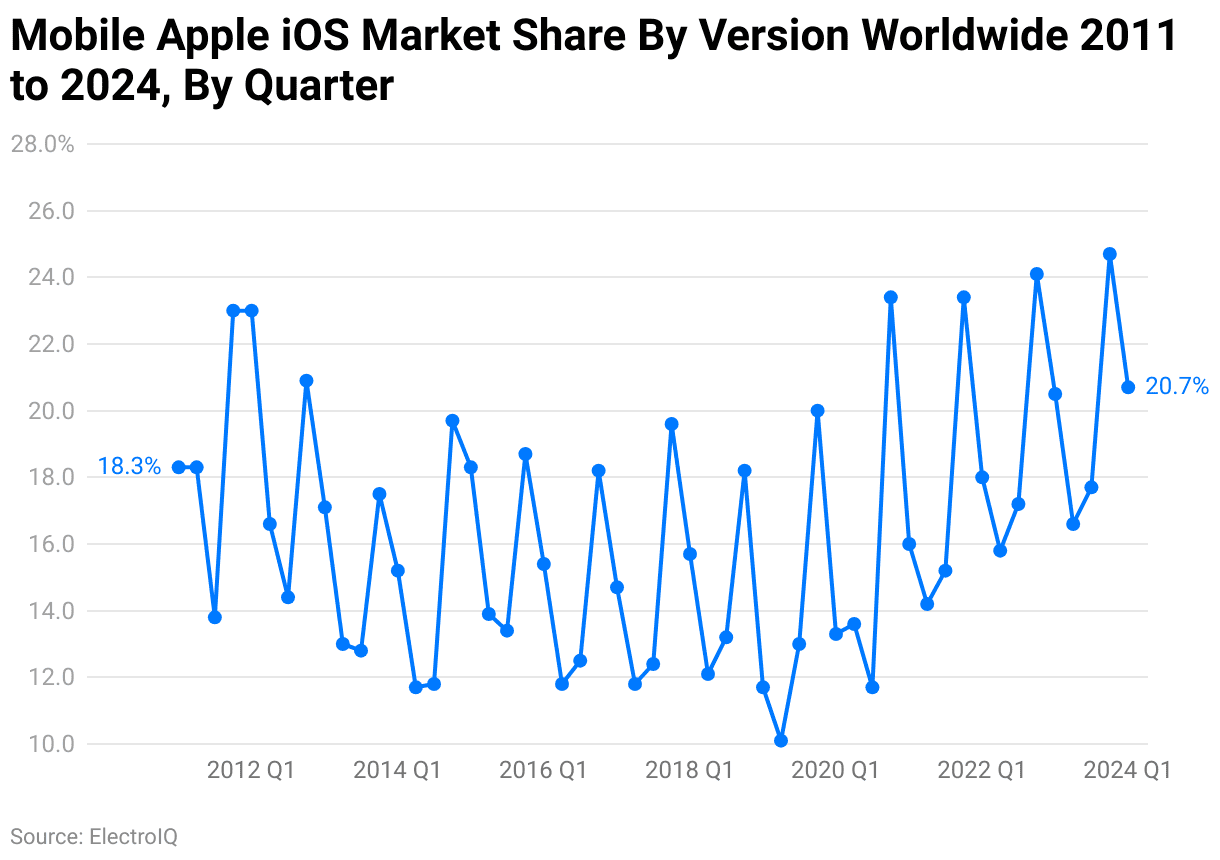
- iPhone vs Android User Statistics show that the mobile iOS market share has fluctuated.
- In Q1 2011, the market share of iOS was 18.3%.
- As of Q1 2024, the iOS market share was 20.7%.
- Between Q1 2011 and Q1 2024, the highest market share of iOS was 24.7%.
(Source: statista.com)
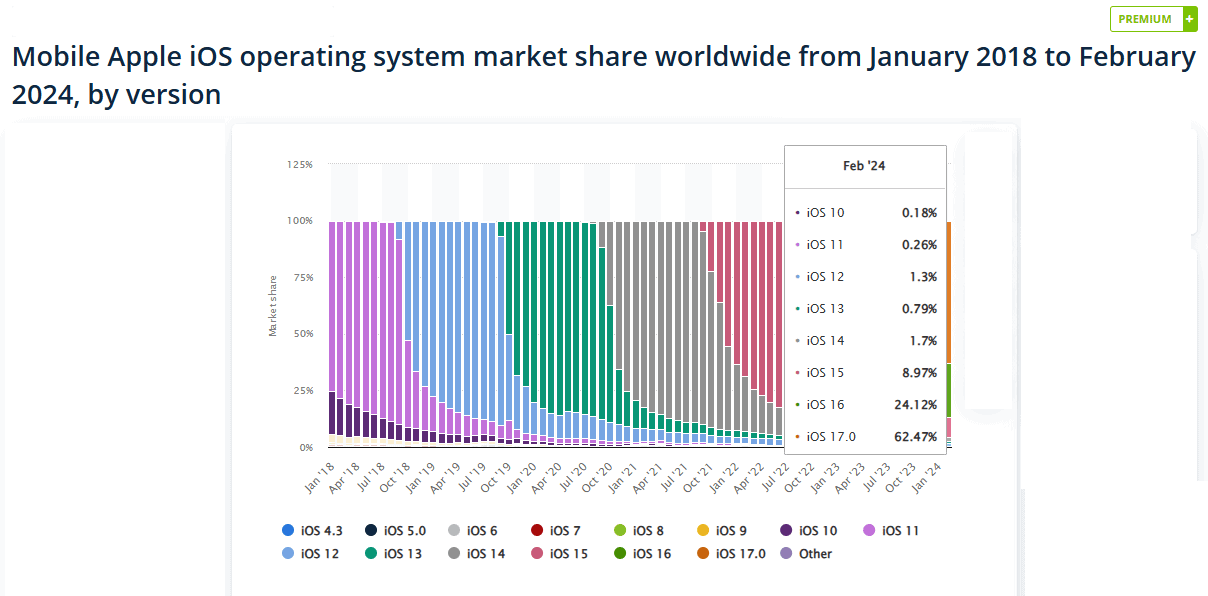
- iPhone vs Android User Statistics show that as of Jan 201,8, iOS 11 had the highest share of Apple users with 75.13%.
- As of January-February 2024, iOS 17.0 has the highest proportion of Apple users with 62.47%.
Leading iPhone Apps
(Reference: statista.com)
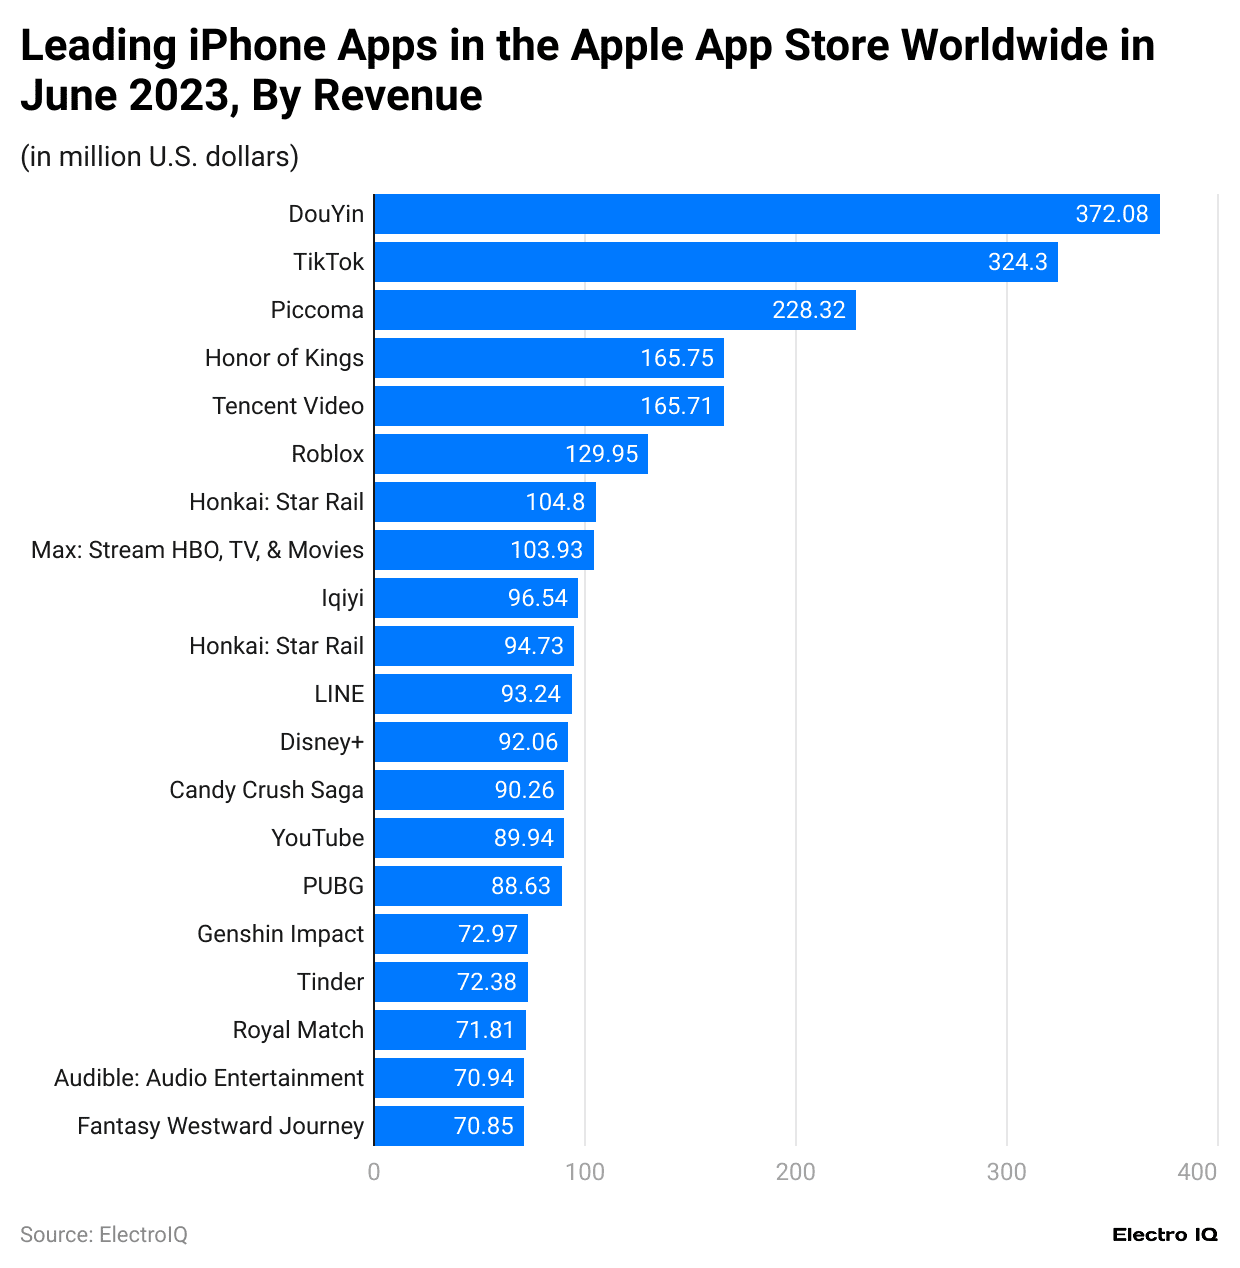
- iPhone vs Android User Statistics show that DouYin is the leading iPhone app in the Apple App Store, with 372.08 million downloads.
- TikTok has the second-highest downloads, with 324.3 million.
- Piccoma has the third-highest downloads, with 228.32 million.
- Honor of Kings has the 4th highest number of downloads, with 165.75 million.
- Tencent Video has the 5th highest downloads among iPhone apps, with 165.7 million.
Free vs Paid Android Apps
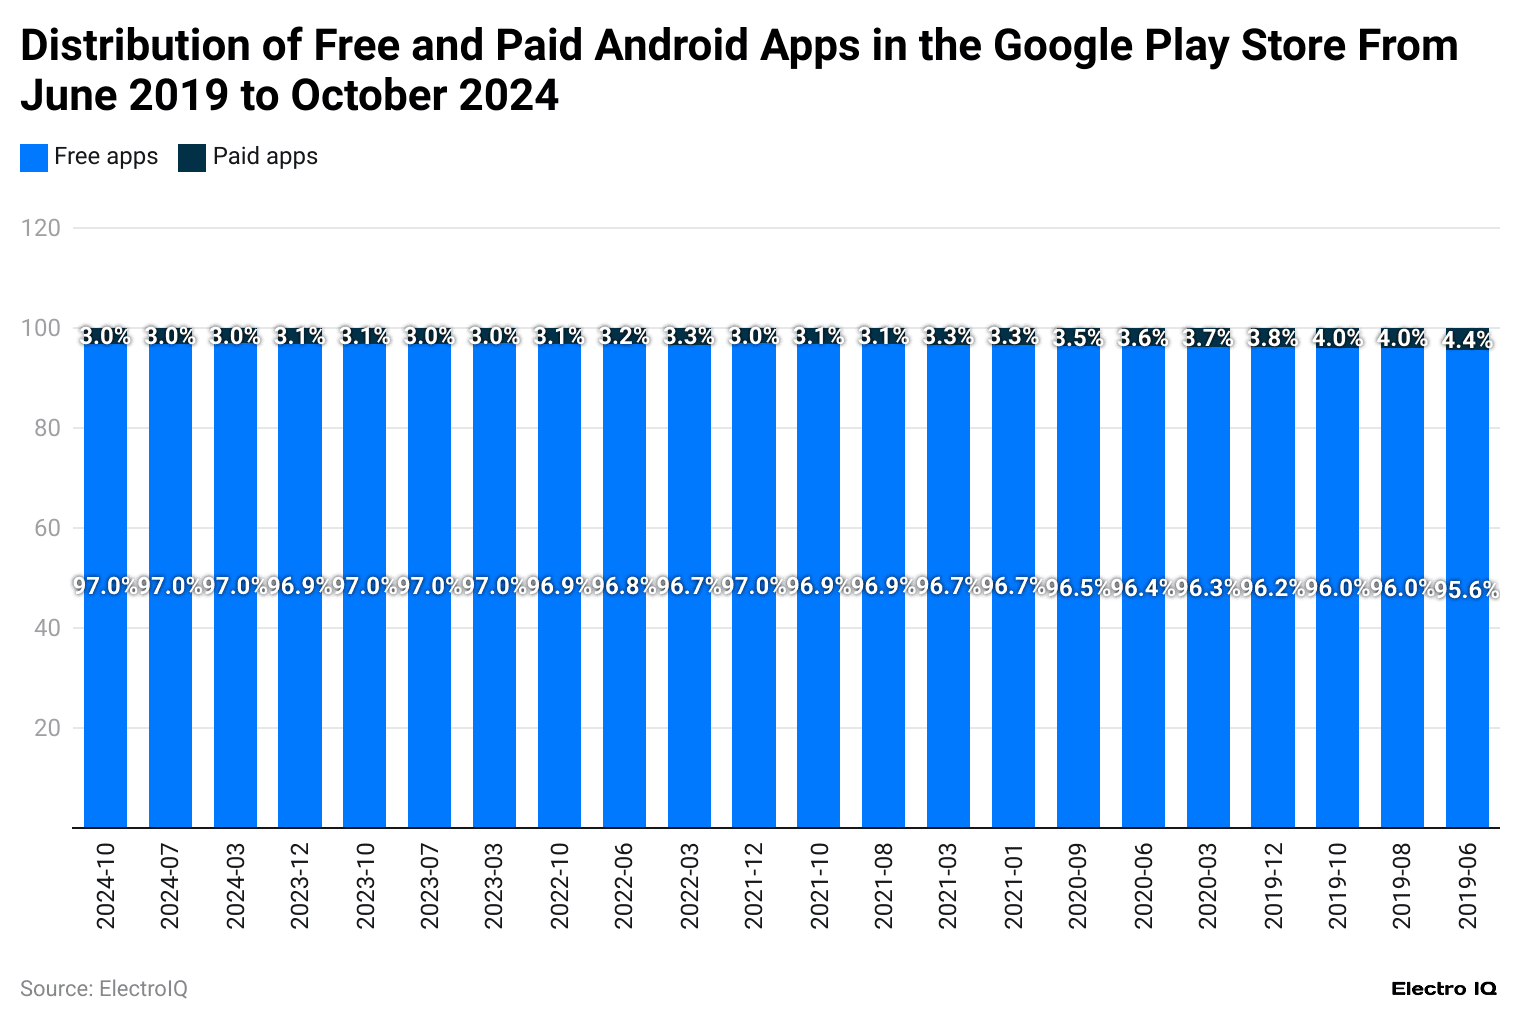
(Reference: statista.com)
- iPhone vs Android User Statistics shows that the proportion of free vs paid Android has been consistent over time.
- In June 2019, free apps comprised 95.6% of all Android apps, while paid apps accounted for 4.4%.
- As of October 2024, free apps made up 96.98% of Android apps, and paid apps made up 3.02% of all Android apps.
Android Phone’s Average Price
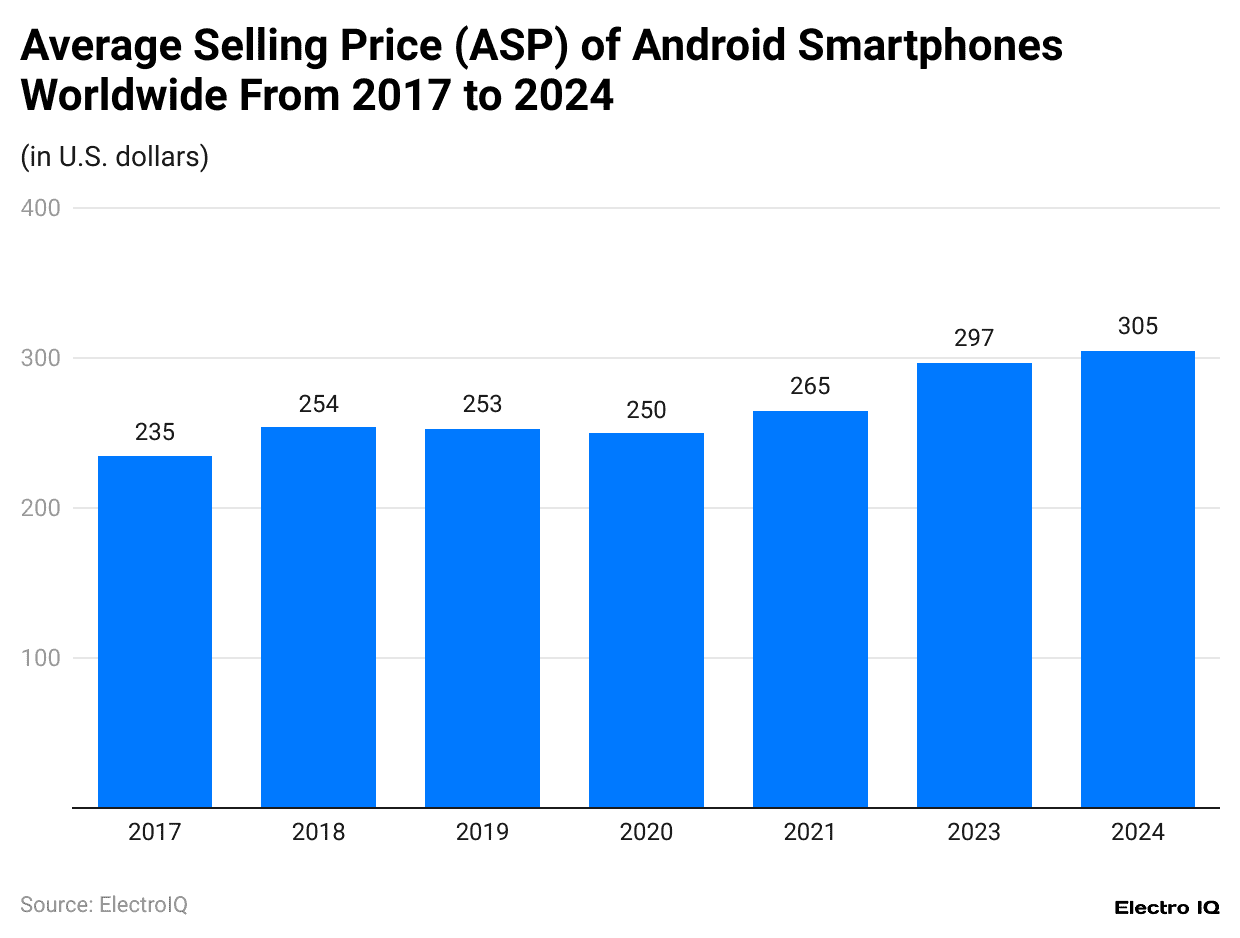
(Reference: statista.com)
- iPhone vs Android User Statistics shows that the average selling price of Android phones has increased over time.
- In 2017, the average selling price of an Android phone was 235 USD.
- As of 2024, the average price of an Android phone is 305 USD.
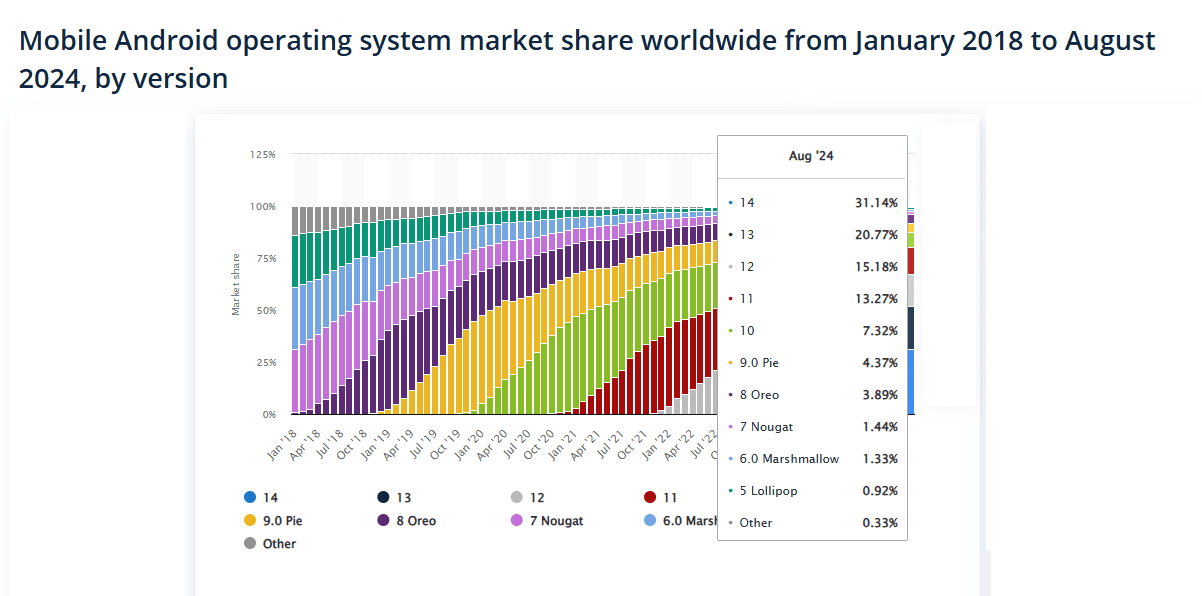
(Source: statista.com)
- iPhone vs Android User Statistics shows that in Jan 2018, Android version 7 (Nougat) had the highest market share with 30.14% of all Android phones.
- As of August 2024, Android version 14 has the highest share, with 31.14% of all Android phones.
Tablet Shipment Worldwide
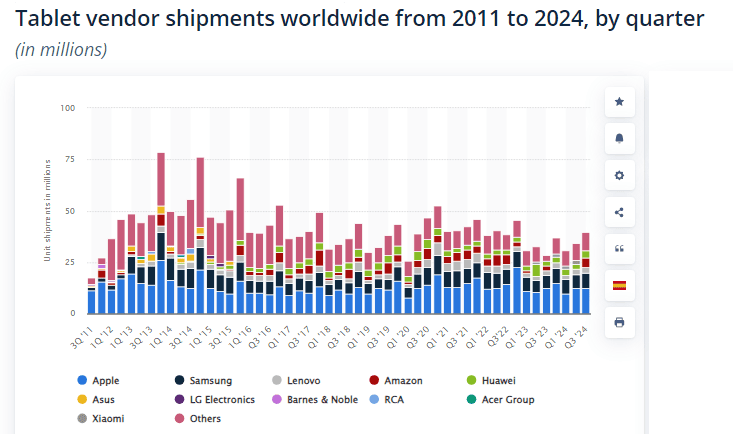
(Source: statista.com)
- iPhone vs Android User Statistics shows that in Q3 2011, Apple was the leader in smart tablet shipments with 11.12 million.
- As of Q3 2024, Apple is still the leader among smart tablets, with 12.6 million shipments.
iOS Version History
- iPhone OS 1: Latest release date – July 15, 2008
- iPhone OS 2: Latest release date – January 27, 2009
- iPhone OS 3: Latest release date – August 11, 2010
- iOS 4: Latest release date – July 25, 2011
- iOS 5: Latest release date – May 25, 2012
- iOS 6: Latest release date – February 21, 2014
- iOS 7: Latest release date – June 30, 2014
- iOS 8: Latest release date – August 13, 2015
- iOS 9: Latest release date – July 22, 2019
- iOS 10: Latest release date – July 22, 2019
- iOS 11: Latest release date – July 9, 2018
- iOS 12: Latest release date – January 23, 2023
- iOS 13: Latest release date – September 1, 2020
- iOS 14: Latest release date – October 26, 2021
- iOS 15: Latest release date – July 29, 2024
- iOS 16: Latest release date – August 7, 2024
- iOS 17: Latest release date – November 19, 2024
- iOS 18: Latest release date – November 19, 2024
- iOS 18.2 RC: Latest release date – December 5, 2024
(Source: wikipedia.org)
Android Version History
- Android 1.0: Version number – 1.0, Release date – September 23, 2008
- Android 1.1 (Petit Four): Version number – 1.1, Release date – February 9, 2009
- Android Cupcake: Version number – 1.5, Release date – April 27, 2009
- Android Donut: Version number – 1.6, Release date – September 15, 2009
- Android Eclair: Version numbers – 2.0, 2.0.1, 2.1, Release dates – October 27, 2009, December 3, 2009, January 11, 2010
- Android Froyo: Version numbers – 2.2 – 2.2.3, Release date – May 20, 2010
- Android Gingerbread: Version numbers – 2.3 – 2.3.7, Release dates – December 6, 2010, February 9, 2011
- Android Honeycomb: Version numbers – 3.0, 3.1, 3.2 – 3.2.6, Release dates – February 22, 2011, May 10, 2011, July 15, 2011
- Android Ice Cream Sandwich: Version numbers – 4.0 – 4.0.4, Release dates – October 18, 2011, December 16, 2011
- Android Jelly Bean: Version numbers – 4.1 – 4.3.1, Release dates – July 9, 2012, November 13, 2012, July 24, 2013
- Android KitKat (Key Lime Pie): Version numbers – 4.4 – 4.4W.2, Release dates – October 31, 2013, June 25, 2014
- Android Lollipop (Lemon Meringue Pie): Version numbers – 5.0 – 5.1.1, Release dates – November 4, 2014, March 2, 2015
- Android Marshmallow (Macadamia Nut Cookie): Version number – 6.0 – 6.0.1, Release date – September 29, 2015
- Android Nougat (New York Cheesecake): Version numbers – 7.0 – 7.1.2, Release dates – August 22, 2016, October 4, 2016
- Android Oreo (Oatmeal Cookie): Version numbers – 8.0 – 8.1, Release dates – August 21, 2017, December 5, 2017
- Android Pie (Pistachio Ice Cream): Version number – 9, Release date – August 6, 2018
- Android 10 (Quince Tart): Version number – 10, Release date – September 3, 2019
- Android 11 (Red Velvet Cake): Version number – 11, Release date – September 8, 2020
- Android 12 (Snow Cone): Version number – 12, Release date – October 4, 2021
- Android 12L (Snow Cone v2): Version number – 12.1, Release date – March 7, 2022
- Android 13 (Tiramisu): Version number – 13, Release date – August 15, 2022
- Android 14 (Upside Down Cake): Version number – 14, Release date – October 4, 2023
- Android 15 (Vanilla Ice Cream): Version number – 15, Release date – October 15, 2024
- Android 16 (Baklava): Version number – 16 DP1, Release date – November 19, 2024
(Source: wikipedia.org)
Android vs iOS Comparison
| Feature | Android | iOS |
|
Developed by |
Google, Open Handset Alliance | Apple Inc. |
| Market Share | 77% |
19% |
|
License |
Open source with proprietary elements | Proprietary |
| Current Version | Android 15 |
iOS 17.5.1 |
|
Current Version Release Date |
September 3, 2024 | May 20, 2024 |
| OS Family | Modified Linux kernel-based |
Darwin |
|
Supported CPU Architectures |
ARM (32-bit & 64-bit), x86, x86-64 | 64-bit ARMv8-A only |
| Programmed In | C, C++, Java, Kotlin |
C, C++, Objective-C, Swift |
|
Default App Store |
Google Play | App Store |
| Cost to Publish Apps | $25 one-time fee |
$99 per year |
|
Per-app Internet Access |
No (requires third-party software) | Available from iOS 7+ |
| Wireless System Updates | Yes |
Yes |
|
Split-screen App Usage |
Yes | Only on iPads with iOS 9+ |
| File Manager | Available (6.0+) |
Available (11+) |
|
Device Encryption |
Yes (varies by version and hardware) | Yes |
| Privacy of Synchronization | Possible via third-party software |
Locally or via iCloud |
|
Voice Commands |
Yes | Siri (iOS 5+) |
| Default Browser | Chrome for Android | |
|
Offline Maps |
Available through third-party apps | Available with Apple Maps (iOS 6+) |
| Parental Controls | Available (4.3+) |
Available |
|
Notification Center |
Yes | Yes |
| Cut, Copy, and Paste | Yes |
Available from iOS 3+ |
|
Screen Orientation Lock |
Yes | Yes |
| Multitasking | Yes |
Limited (Improved from iOS 4 onwards) |
|
Direct File Transfer Over Bluetooth |
Yes (2+) | AirDrop is available (iOS 7+) |
| Call Recorder | Yes (varies by device or app) |
Available in certain regions |
|
Per-app Notifications |
Yes (4.1+) | Yes |
| File Upload in Browser | Available from Android 2.2+ |
Limited (iOS 9+) |
(Source: wikipedia.org)
Conclusion
The smartphone ecosystem continues to demonstrate remarkable dynamism and innovation. Android and iOS represent more than competing operating systems; they embody distinct technological philosophies and user experiences. iPhone vs Android User Statistics show that sophisticated features, enhanced connectivity, and user experiences increasingly characterize the mobile landscape.
As we look forward, the competition between Android and iOS will likely drive further innovation. Emerging technologies like advanced AI integration improved 5G capabilities, and more sophisticated user interfaces will shape the next generation of mobile experiences.
FAQ.
Over 8.8 billion mobile phone subscriptions by the end of 2023.
Android has 71.65%, while iOS has 27.62% as of Q1 2024.
South Korea, with an average of 432.5 Mbps.
305 USD in 2024.
503 cities have 5G availability.
305 USD in 2024.
Expected to reach over 82.5%.
iOS 17.0, with 62.47% usage as of February 2024.
383.23 USD billion.
12.6 million tablet shipments.

Joseph D'Souza founded ElectroIQ in 2010 as a personal project to share his insights and experiences with tech gadgets. Over time, it has grown into a well-regarded tech blog, known for its in-depth technology trends, smartphone reviews and app-related statistics.