Open Source Statistics And Facts (2025)
Updated · Oct 08, 2025

Table of Contents
- Introduction
- Editor’s Choice
- General Open Source Statistics
- Global Open Source Market Size Analysis
- Open-Source License Type Comparison
- Total Open Source Projects Adoption Statistics
- By Regional Distribution
- By Industry
- By Organization Size
- Most Popular Open Source Databases Statistics
- Open Source Database Popularity by Model
- Use of Open Source Software Statistics
- Conclusion
Introduction
Open Source Statistics: Open source software has moved from being a small idea to becoming an important part of the world’s technology system. Today, both developers and companies around the globe work together on open source projects that support everything from phone apps to large cloud platforms. Open source is based on sharing, teamwork, and openness, making it a key force in digital growth.
Platforms like GitHub host more than 100 million repositories. In recent years, governments, companies, and startups have rapidly used open source. This article on Open Source Statistics includes several statistical analyses and current trends from different insights that will reveal the market’s rising impact on technology, security, and business globally.
Editor’s Choice
- According to market.us, the global open-source market size accounted for USD 34.4 billion in 2024 and is projected to reach about USD 40 billion by 2025.
- According to IMARC Group, the media sector makes up 31.0% of the open source intelligence market.
- In terms of techniques, security analytics hold the largest share at 32.0%.
- By end users, cybersecurity organisations accounted for 29.8% in 2024.
- Regionally, North America dominated the market with a 36.0% share.
- In 2024, GitHub reported more than 5.2 billion contributions across over 518 million both on public and private open source projects.
- According to openlogic.com, as of 2024, the adoption of open source projects showed a balanced regional spread, in which Europe led with 25.86%.
- In the same period, the technology sector represented the largest share of open source adoption with 28.01% of survey respondents.
- A report published by db-engines.com in June 2024, MySQL continued as the leading open source database, recording a score above 900 and holding the second position in the overall database list.
- As of September 2025, open source licensing is strongest in Vector DBMS at 88.3% and Spatial DBMS at 83.3%.
- Meanwhile, around 38% of respondents said they increased their use of open source, while 25.71% reported a sudden rise.
General Open Source Statistics
- According to market.us, in 2023, open-source projects had about 2.5 million active contributors worldwide, showing nearly 15% growth from 2022.
- Today, about 80% of companies use open-source software in some way.
- Around 60% of organisations also plan to spend more on open-source services in 2024.
- Meanwhile, 40% of open-source contributors are tech professionals, while 30% are students or future tech workers.
- GitHub alone hosted over 100 million repositories in 2023, supported by 40 million active users working together on projects.
- Mordor Intelligence report shows that AI and machine learning automation play the biggest role, adding about +4.2% to CAGR growth.
- Cybersecurity needs also push the market forward with +2.5%, while quantum-risk mapping initiatives contribute +2.4%.
- Other factors include national security budget increases at +2.1%, the rising flow of social media data at +1.8%, and supply-chain due diligence mandates at +1.5%.
Global Open Source Market Size Analysis
 (Source: shortpixel.ai)
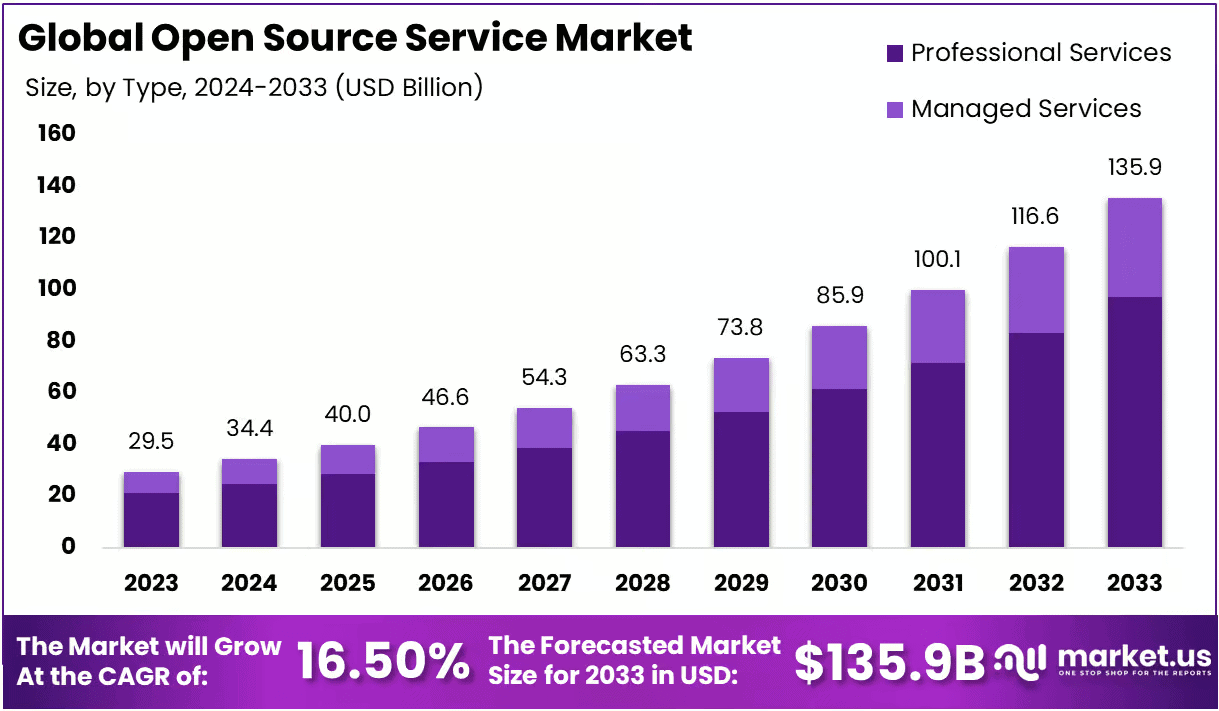
- The global open-source market size accounted for USD 34.4 billion in 2024 and is projected to reach about USD 40 billion by 2025.
- Furthermore, the market size in the coming years is estimated as USD 46.6 billion (2026), USD 54.3 billion (2027), USD 63.3 billion (2028), USD 73.8 billion (2029), USD 85.9 billion (2030), USD 100.1 billion (2031), USD 116.6 billion (2032), and USD 135.9 billion (2033).
- The overall market will grow at a 16.50% CAGR from 2025 to 2033.
- A report published by Mordor Intelligence shows that in 2024, data analytics was the largest segment, making up 34% of the open source intelligence market, while AI-driven security is expected to expand at an 18.5% CAGR.
- From a technology view, social media analytics led with 42.6%, whereas geospatial tools are projected to grow at a 16.8% CAGR by 2030.
- Besides, social media streams contributed 46.2%, and dark web or deep web feeds are set to rise by 23.8% CAGR.
- On the industry side, government intelligence agencies took the lead with 39.1%, while financial services and fintech will grow at a 15.2% CAGR.
- Deployment-wise, cloud-based platforms held 66.5%, with a 16.3% CAGR, and geographically,
- North America dominated with 44.8%, while Asia-Pacific will expand by 14.3% CAGR through 2030.
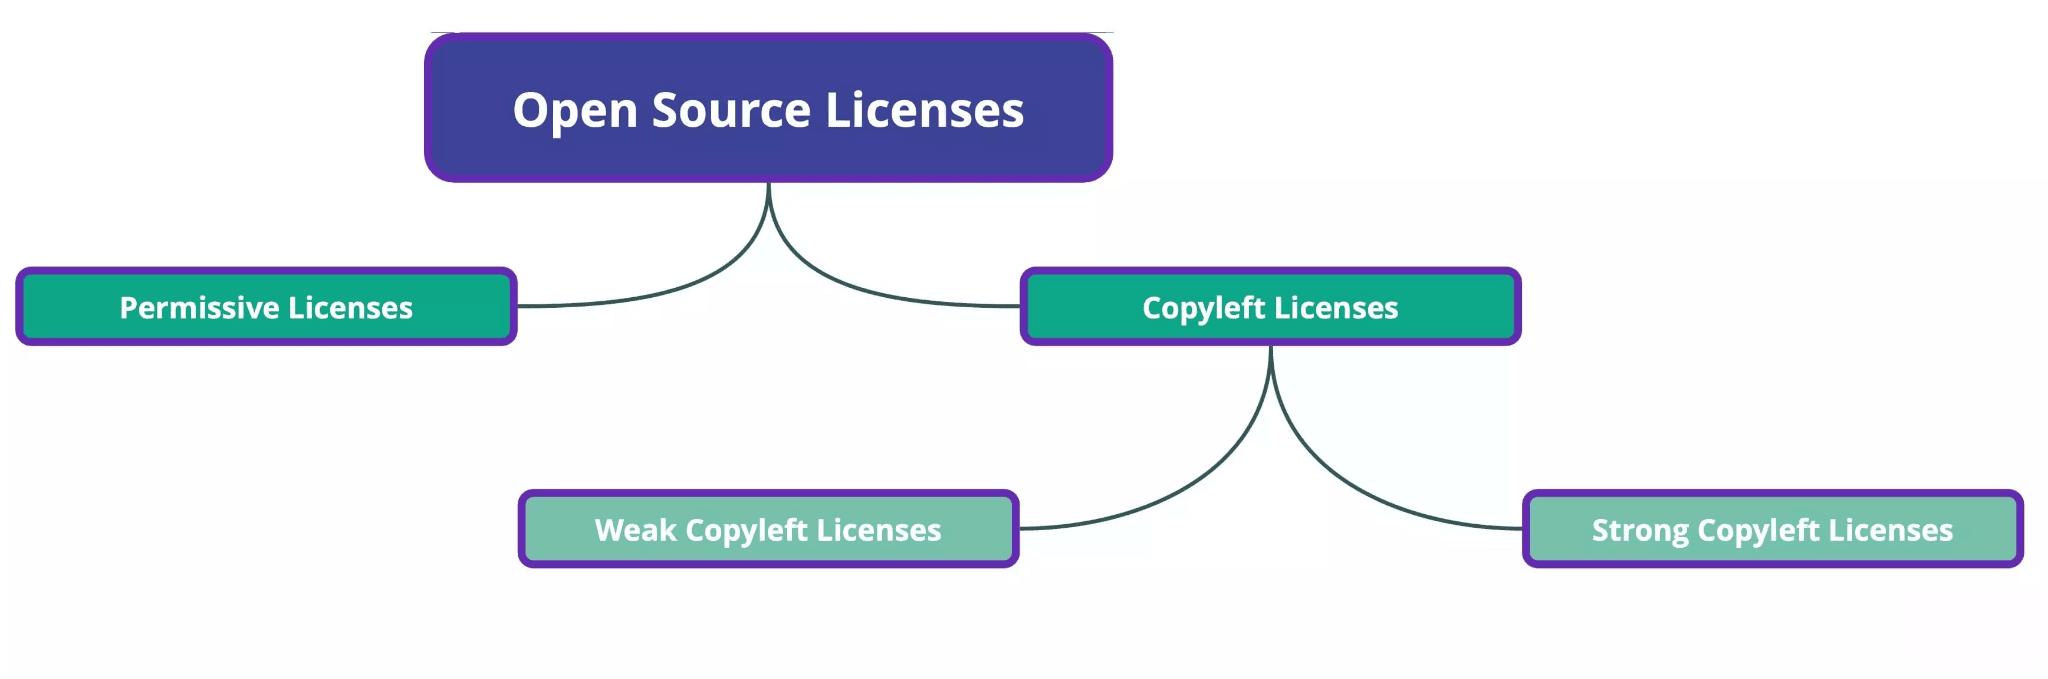
Open-Source License Type Comparison
| Type | Detailed | Example Licenses |
| Permissive Licenses | ● These licenses are very flexible. ● They allow anyone to use, change, and share the software freely. ● People can even include it in closed-source projects without many rules. |
MIT License, Apache License, BSD License, and Unlicense. |
|
Copyleft Licenses |
● These licenses keep the software open.
● If someone modifies or shares the software, they must also share their changes under the same open license. ● This ensures future versions stay free and open. |
GNU General Public License, GNU Lesser General Public License, Mozilla Public License, and Eclipse Public License. |
Total Open Source Projects Adoption Statistics
- In 2024, GitHub’s report stated that almost 5.2 billion contributions were made over 518 million on both public and private open source projects.
- According to Sonatype, the total number of open source projects grew by about 11% in 2023.
- A Synopsys study revealed that 96% of commercial codebases in 2024 contained open source elements.
- The Open Source Initiative’s 2025 report found that 96% of organisations continued or expanded their use of open source software.
- Among them, 26% reported a significant increase in adoption.
By Regional Distribution
 (Reference: openlogic.com)
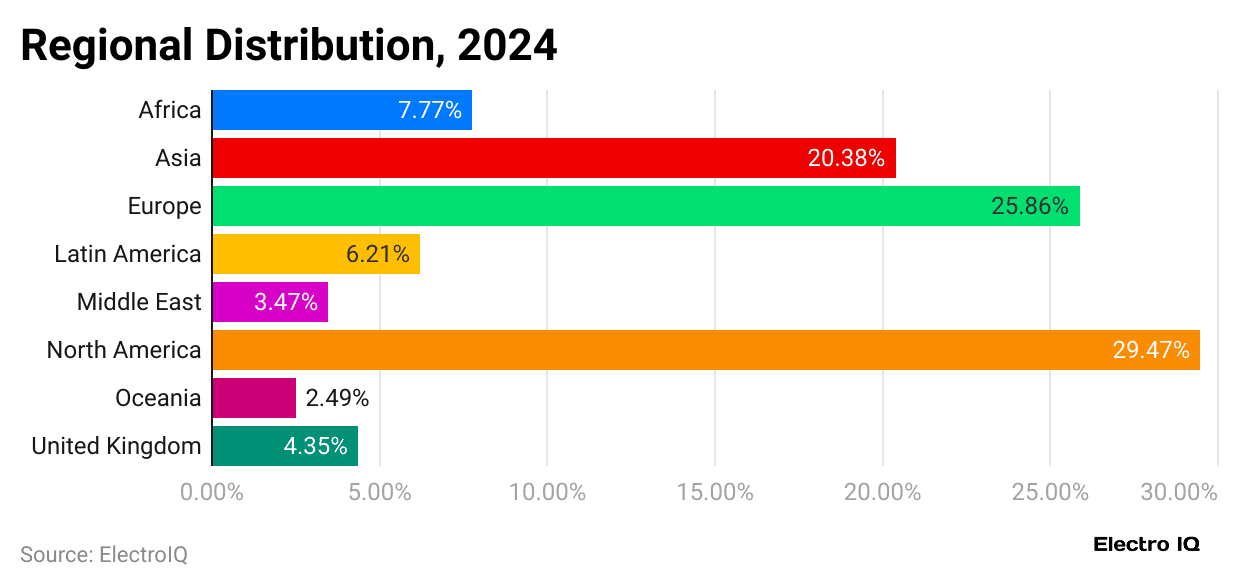
- According to openlogic.com, as of 2024, the adoption rate of open source projects showed a balanced regional spread, in which Europe led with 25.86%, followed by Asia at 20.38% and North America at 29.47%.
- Other regions contributed as well, with Africa at 7.77%, Latin America at 6.21%, the United Kingdom at 4.35%, the Middle East at 47% and Oceania at 2.49%.
By Industry
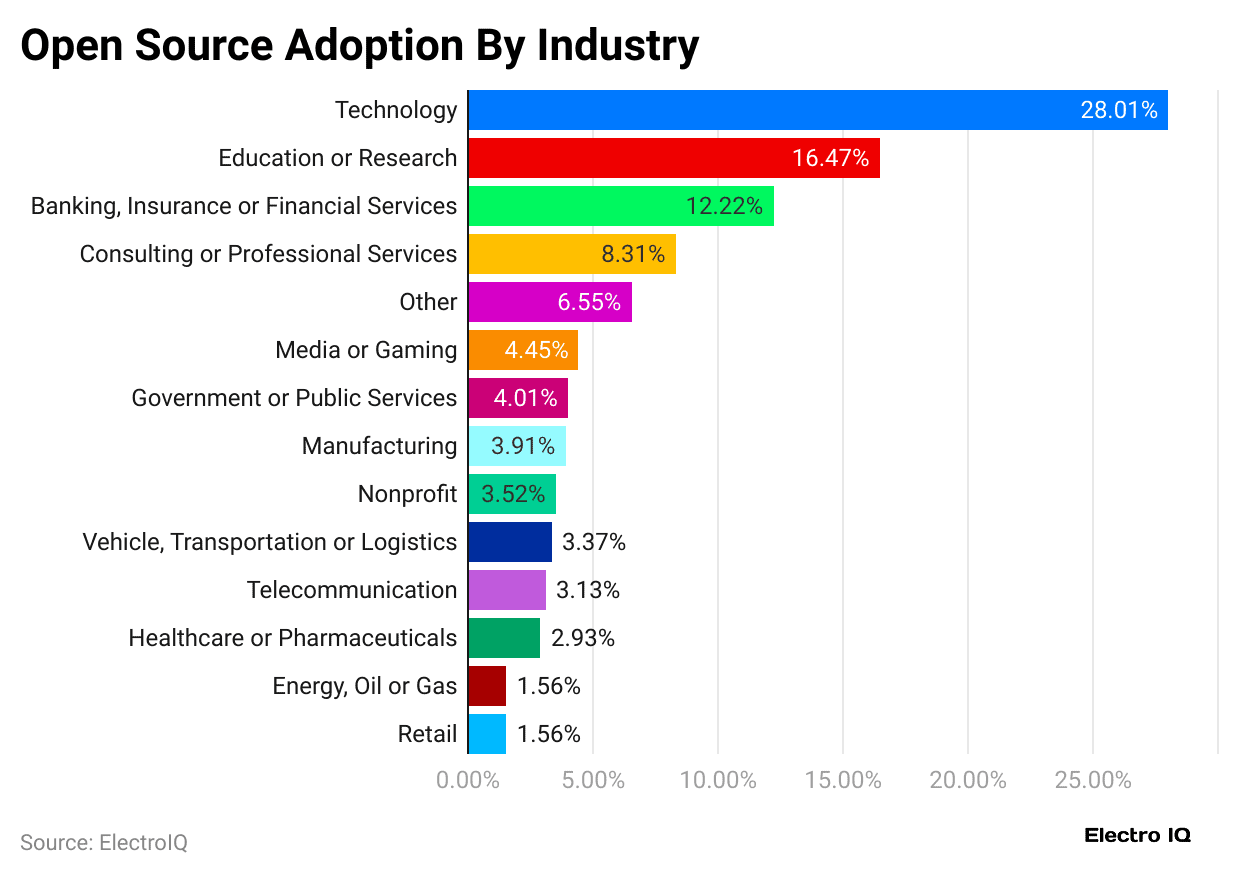
- In 2024, the technology sector represented the largest share of open source adoption with 28.01% of survey respondents.
- This was followed by education or research at 16.47% and banking, insurance, or financial services at 12.22%.
- Open source adoption followed by consulting or professional services at 8.31%, other industries at 6.55%, media or gaming at 4.45%, government and public services at 4.01%, manufacturing at 3.91%, nonprofit organizations at 3.52%, vehicle, transportation, or logistics at 3.37%, telecommunications at 3.19%, healthcare or pharmaceuticals at 2.93%, and the lowest shares in energy, oil, or gas and retail at 1.56% each.
By Organization Size
 (Source: openlogic.com)
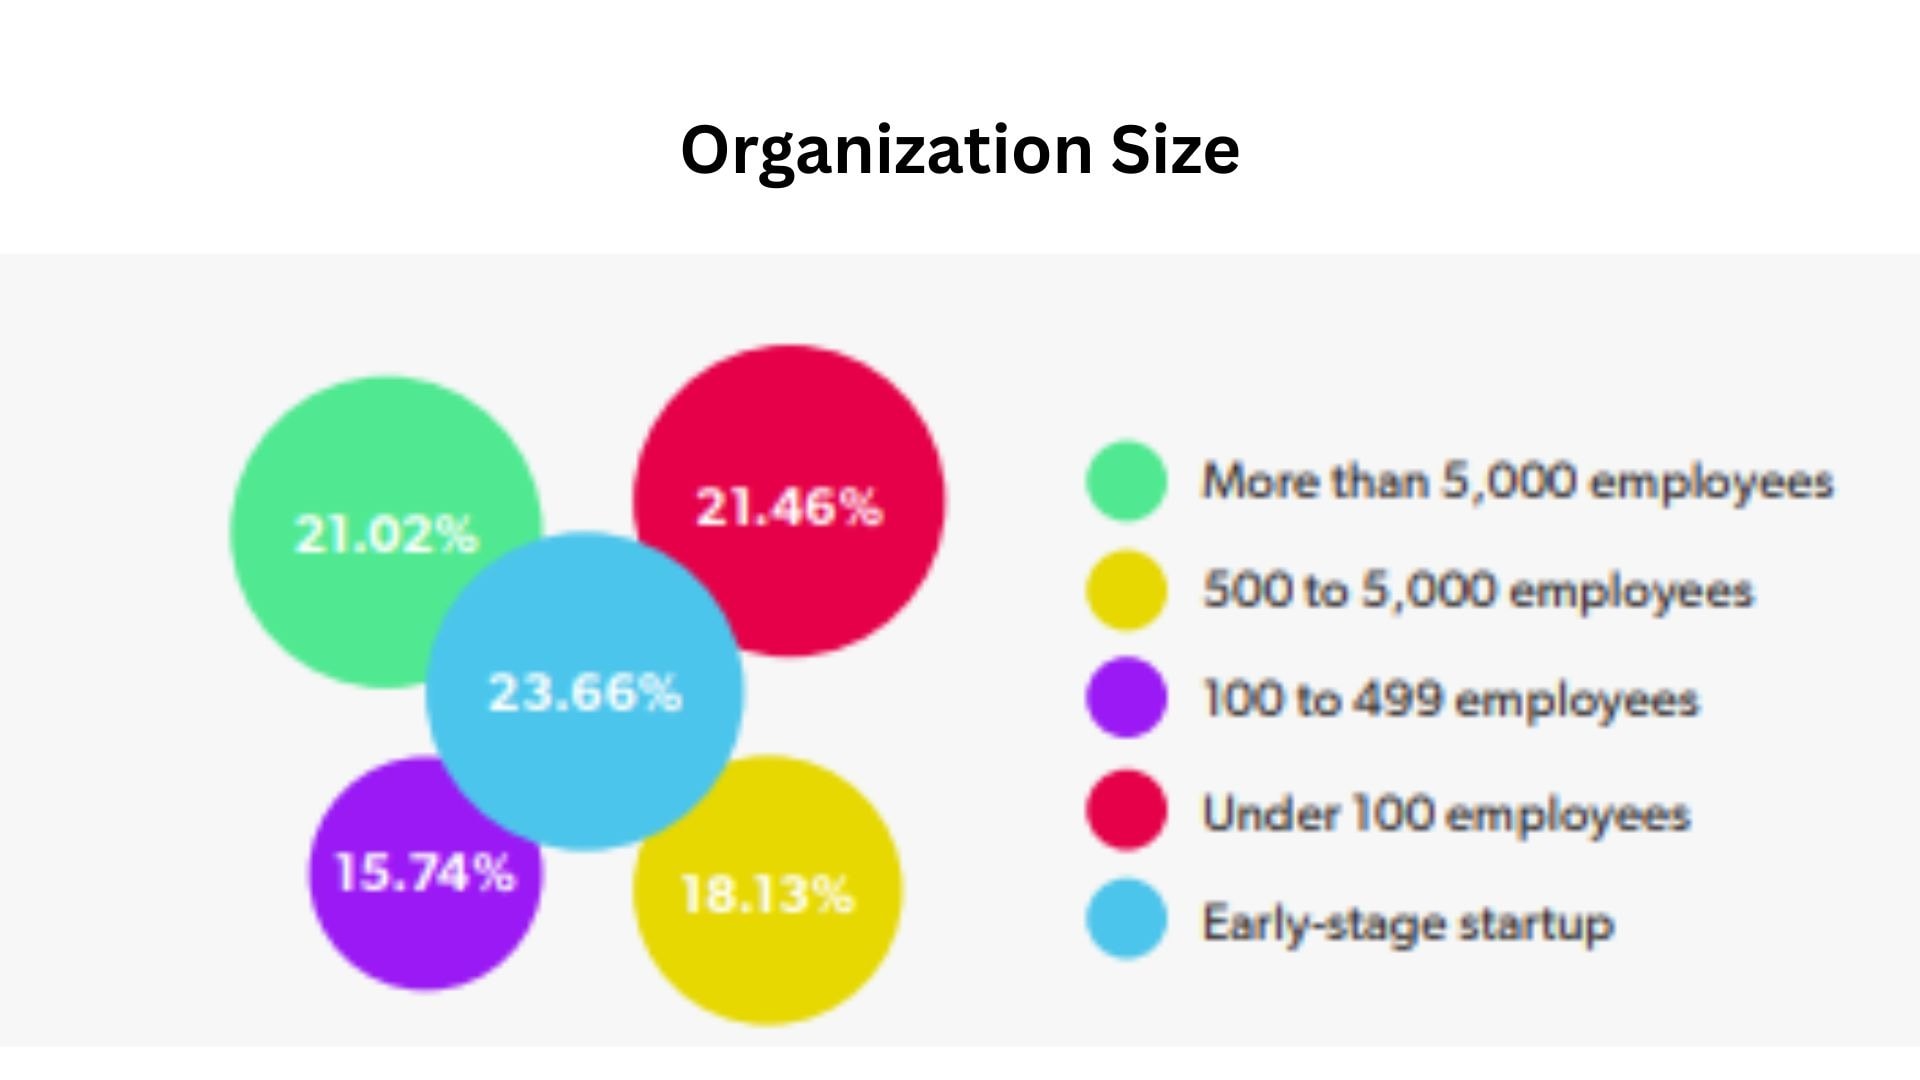
- In 2024, the largest open source adoption rate was made up by early-stage startup companies, making up 23.66%.
- Furthermore, other adoption rates are followed by companies with less than 100 employees (21.46%), big enterprises with more than 5,000 employees ( 21.02%), mid-sized companies with 00 to 5,000 employees (18.13%), and 100 to 499 employees (5.74%).
Most Popular Open Source Databases Statistics
- A db-engines.com report further claimed that in June 2024, MySQL led the open source database, with a score above 90,0 and secured second position in the overall database list.
- PostgreSQL achieved a score between 650 and 700 and secured fourth position globally.
- Meanwhile, MongoDB held the third position among open source databases, scoring around 380 to 400 and ranking fifth overall globally.
- Redis maintained steady growth, scoring roughly 140 to 160 and placing seventh in the rankings.
- At the same time, Elasticsearch secured a score of about 100 to 130, giving it the tenth spot among all database platforms.
The table below includes the top 5 open source systems as of September 2025:
| System | Score | Rank |
| MySQL | 892 | 2 |
| PostgreSQL | 657 | 4 |
| MongoDB | 381 | 5 |
| Redis | 145 | 7 |
| Elasticsearch | 118 | 10 |
Open Source Database Popularity by Model
 (Reference: db-engines.com)
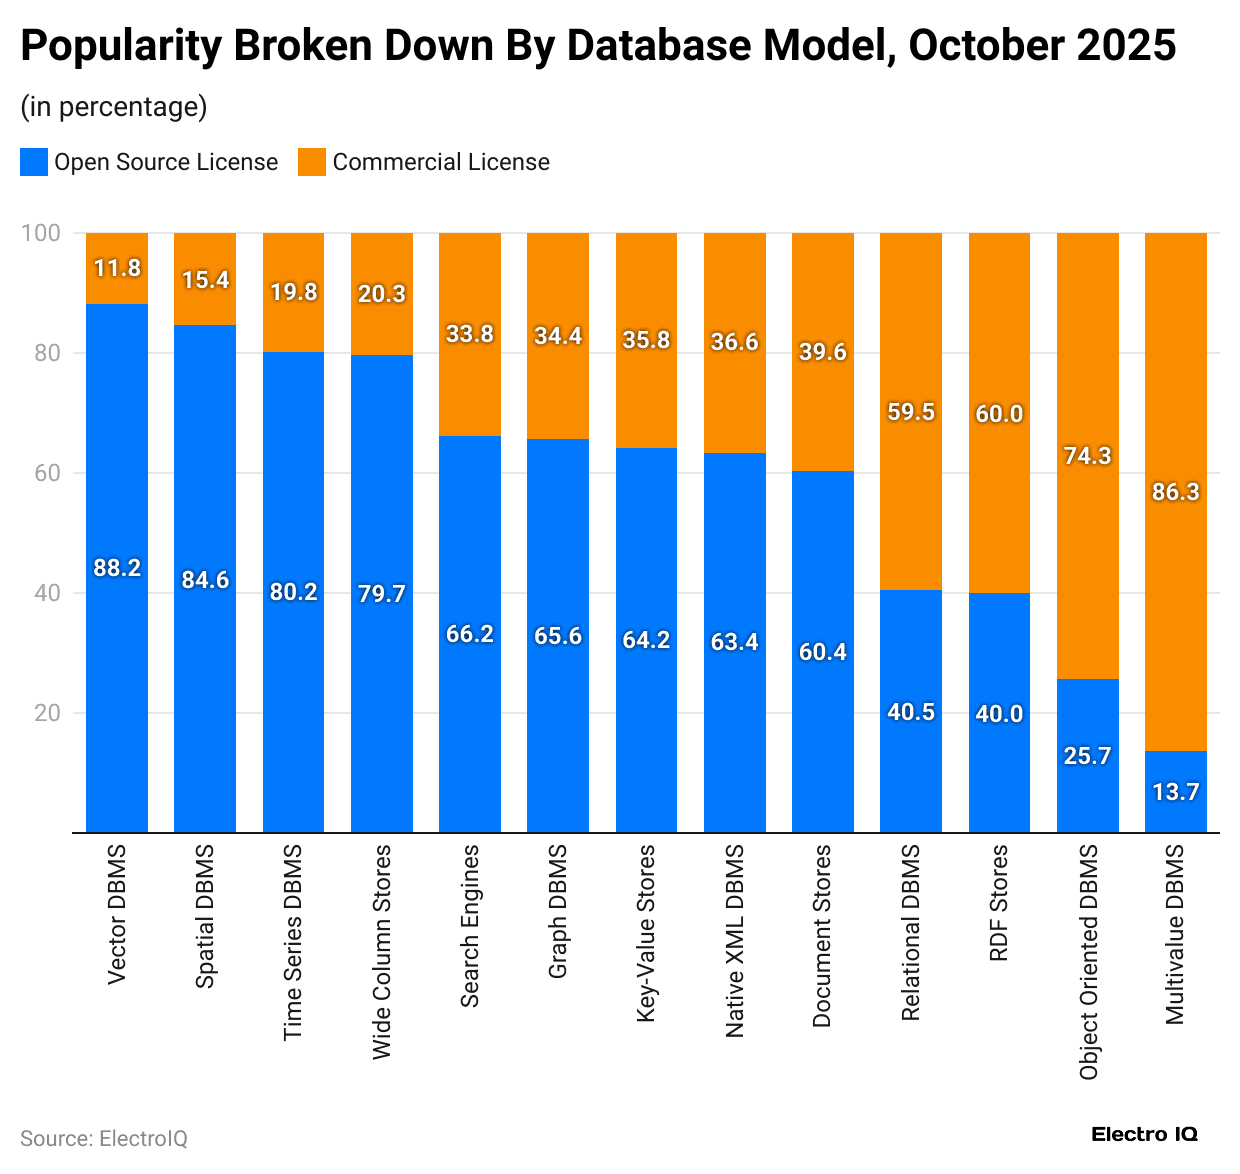
- As of September 2025, open source licensing remained strongest in Vector DBMS at 88.3% and Spatial DBMS at 83.3%.
- Time Series DBMS shows strong adoption with 80.2% open source usage, followed by Wide Column Stores at 79.3%, Search Engines at 66.1%, Graph DBMS at 64.8%, Key-Value Stores at 63.5%, Native XML DBMS at 61.9% whereas each Document and Relational DBMS secured at 61%
- Specialized databases show less adoption: RDF Stores 41.3%, Object-Oriented 24.9%, and Multivalue only 14%.
Use of Open Source Software Statistics
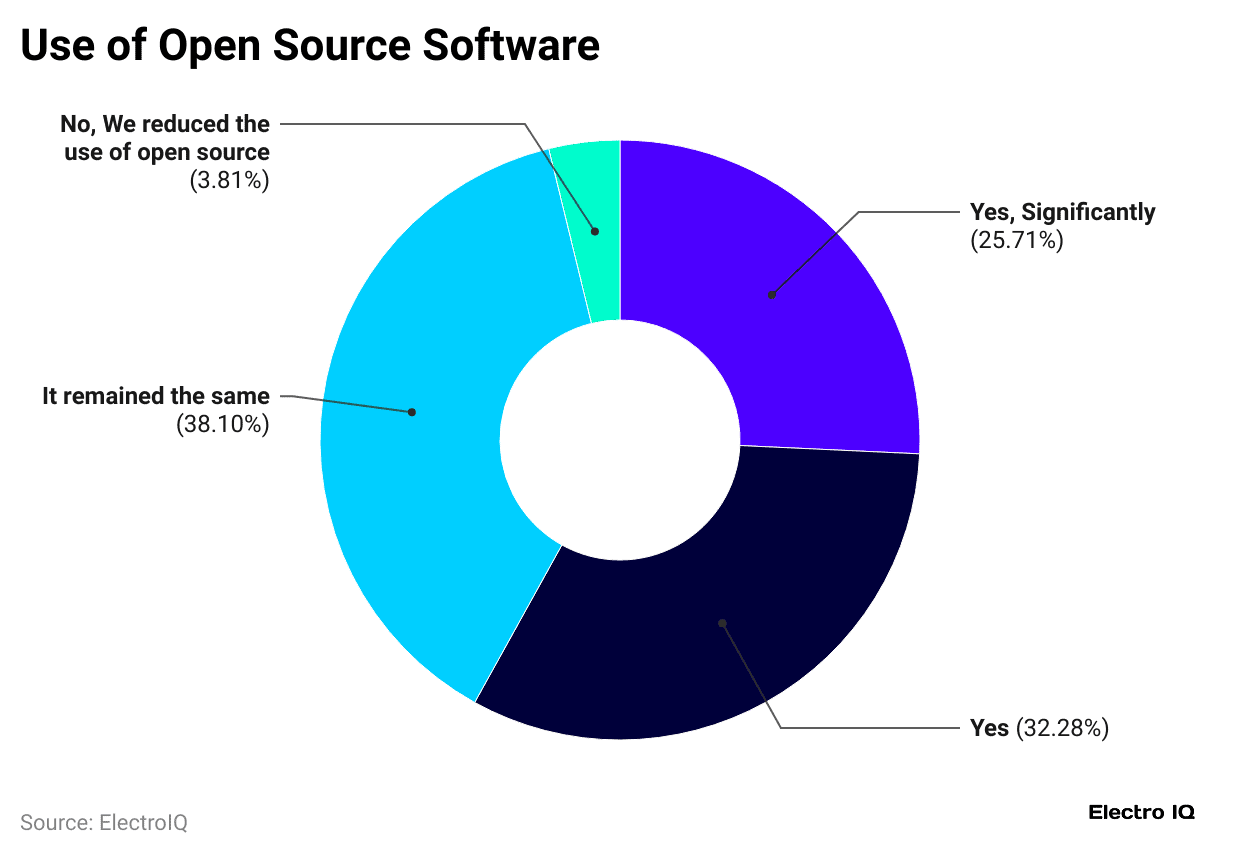
- The above chart states that around 38% of respondents said they increased their use of open source, while 25.71% reported a sudden rise.
- At the same time, 38.10% mentioned their usage remained unchanged, and only 3.81% stated that they reduced their reliance on open source software.
Conclusion
In conclusion, open source is no longer just an alternative option but has become the strongest segment of today’s digital world. Open source supports mobile apps, cloud platforms, AI, and cybersecurity, reaching almost every part of technology. With more contributors and projects, it shows worldwide teamwork in building fresh ideas and solutions.
Research shows that governments, companies, and individuals choose open source not only for cost savings but also for its speed, security, and flexibility. All these statistics make it clear that open source will continue to shape and drive the future of technology.
Sources
FAQ.
 (Source: amplience.net)
The two main types of open source are permissive licenses and copyleft licenses.
Open source improves security by allowing quick bug fixes, builds resilience as projects can be forked or adapted, and encourages collaboration where global contributors work together to create stronger, innovative solutions.
Limitations include a lack of official support, potential security risks, compatibility issues, steep learning curves, and uncertain long-term project sustainability.
Open source software is not controlled by one company; it is managed collectively by global communities and contributors.
Yes, open source is freely available, allowing anyone to use, modify, and share software openly.
Common open-source licenses are MIT, Apache 2.0, GPL, LGPL, and BSD.

Maitrayee Dey has a background in Electrical Engineering and has worked in various technical roles before transitioning to writing. Specializing in technology and Artificial Intelligence, she has served as an Academic Research Analyst and Freelance Writer, particularly focusing on education and healthcare in Australia. Maitrayee's lifelong passions for writing and painting led her to pursue a full-time writing career. She is also the creator of a cooking YouTube channel, where she shares her culinary adventures. At Smartphone Thoughts, Maitrayee brings her expertise in technology to provide in-depth smartphone reviews and app-related statistics, making complex topics easy to understand for all readers.