Panasonic Statistics By Sales, Operating Profit And Expenditure
Updated · Oct 01, 2024
Table of Contents
- Introduction
- Editor’s Choice
- Panasonic Net Sales
- Panasonic Net Sales By Segment
- Sales Of Panasonic Electronics By Region
- Panasonic Operating Profit
- Panasonic Operating Profit By Segment
- Panasonic Net Income
- Panasonic Total Assets
- Panasonic Research And Development Expenditure
- Panasonic Employees Data
- Leading Japanese Electronic Goods Companies
- Global Digital Camera Manufacturer Market Share
- EV Manufacturers Worldwide
- Panasonic Malaysia Profit After Tax
- Panasonic Overview
- Conclusion
Introduction
Panasonic Statistics: Panasonic is a Japanese multinational company headquartered in Kadoma. In addition to consumer electronics, it provides various products and services, such as rechargeable batteries, avionic systems, and industrial parts. It is essential to review Panasonic statistics and learn about the company’s relevant aspects and rise in popularity among consumers.
The readers will get key insights into Panasonic’s financial performance, market position, and strategic initiatives, offering a comprehensive overview of the company’s current state and prospects in the ever-changing tech landscape.
Editor’s Choice
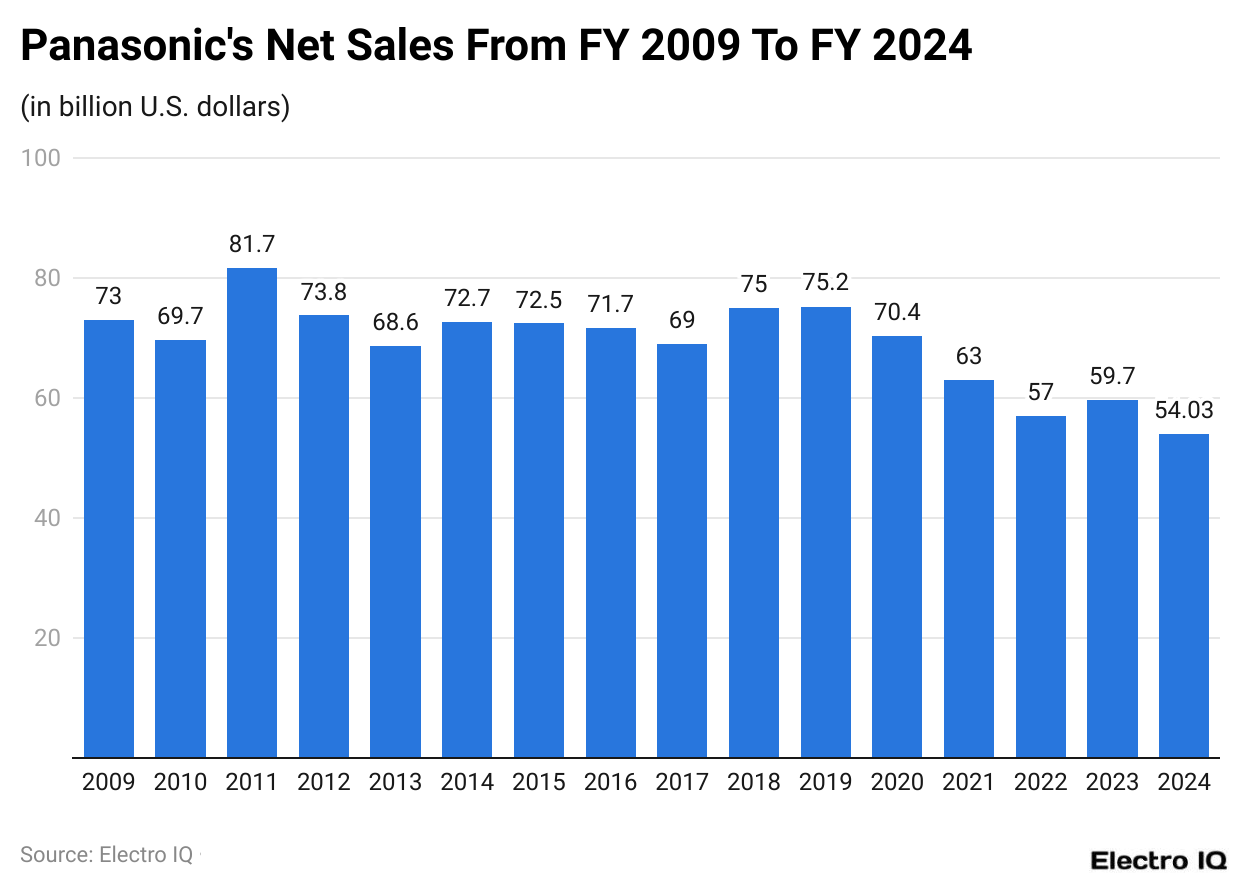
- Panasonic’s net sales have consistently decreased over the last 15 years.
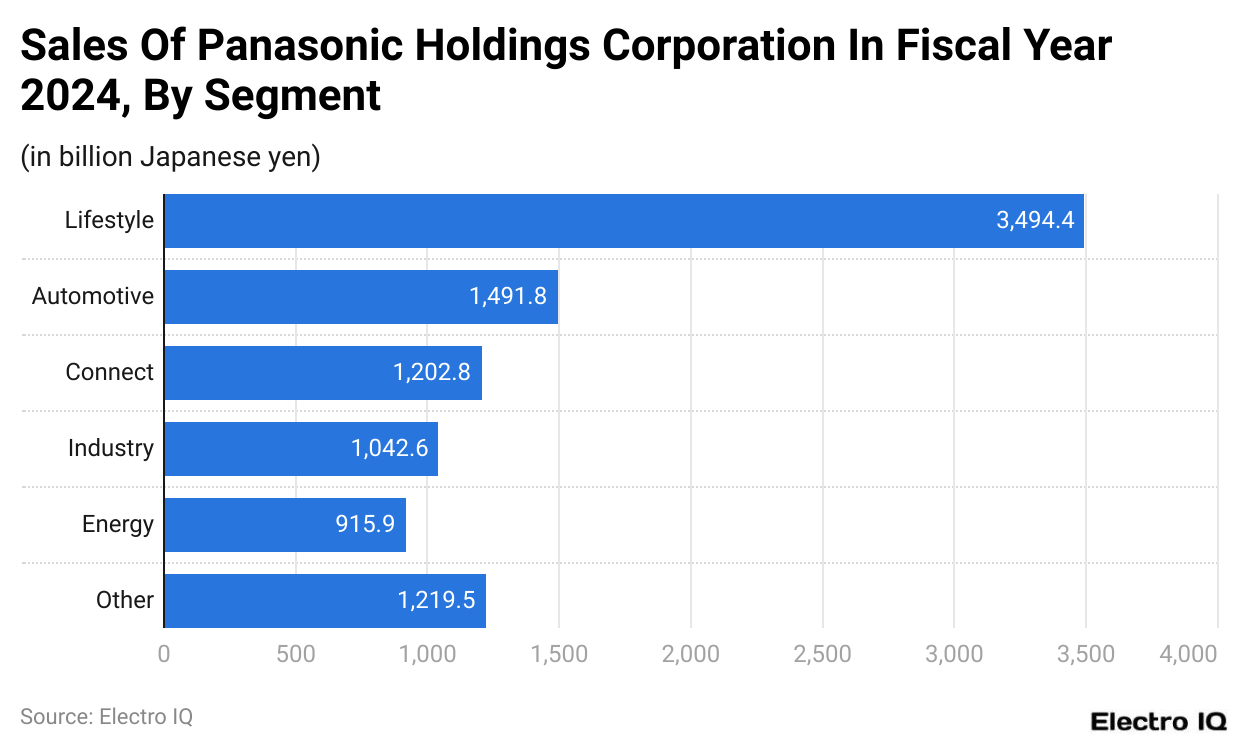
- The Lifestyle segment generates the highest sales for Panasonic at 3494.4 billion Yen.
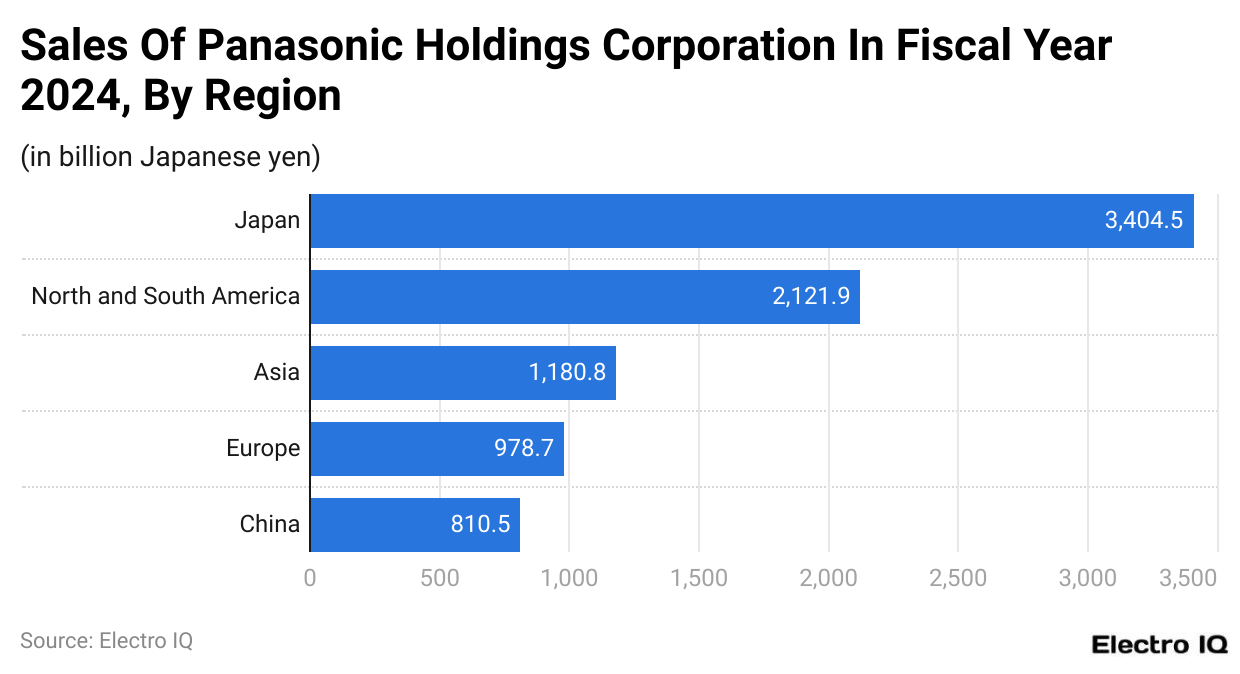
- Japan is Panasonic’s highest sales region with 3404.5 billion Yen.
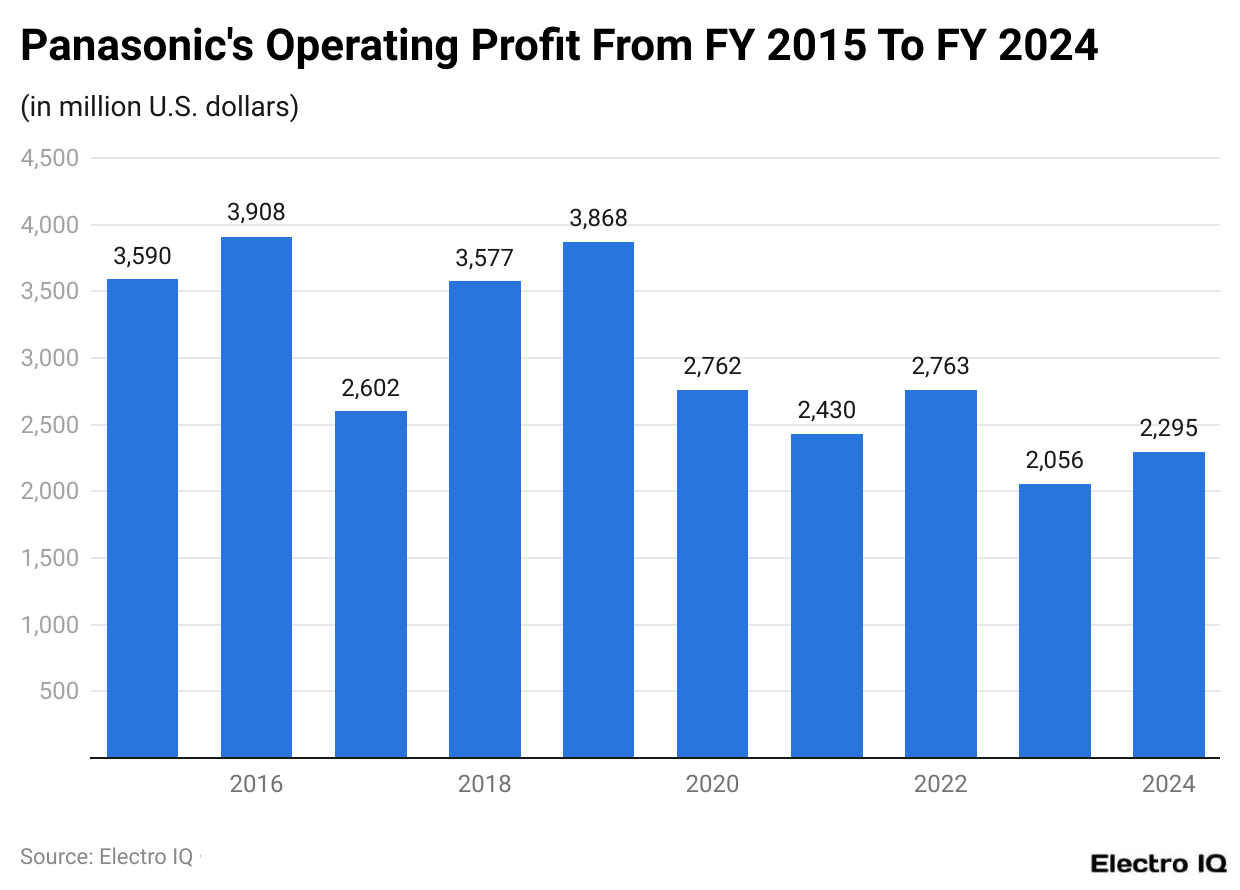
- Panasonic’s operating profit peaked in 2016 at USD 3908 million between 2015-2024.
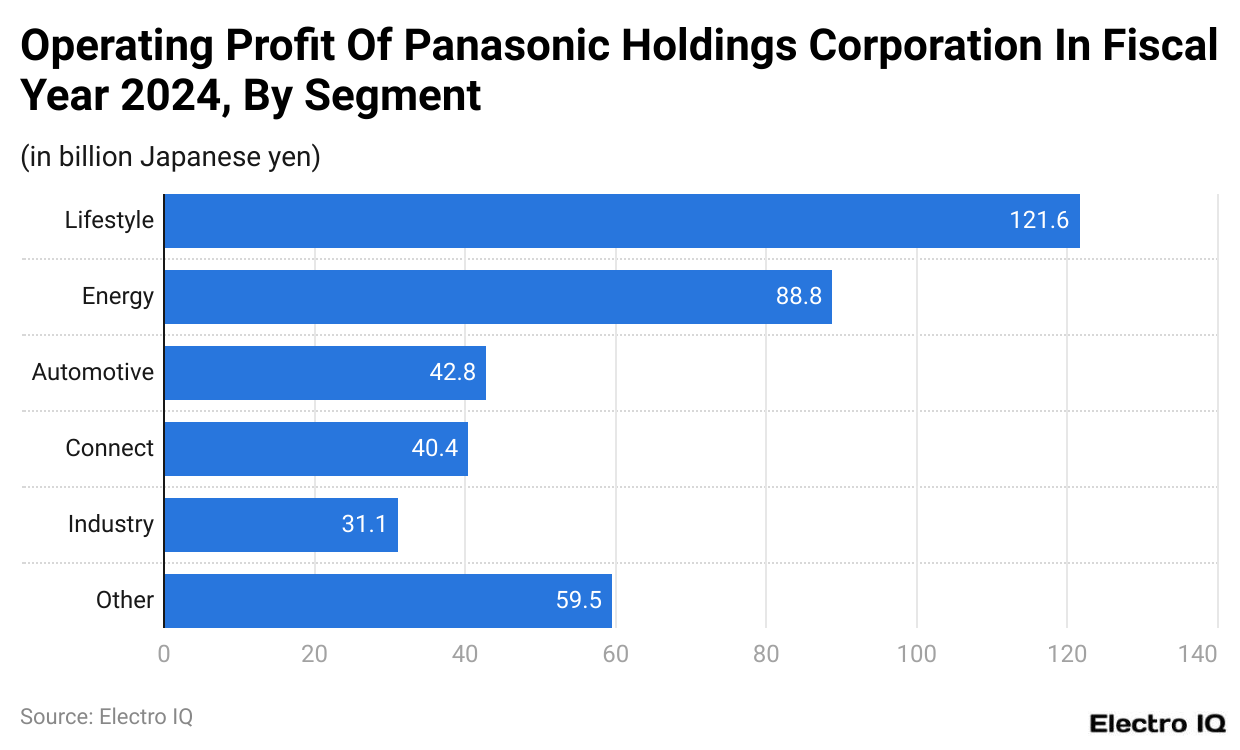
- The Lifestyle segment has the highest operating profit at 121.6 billion Japanese yen.
- Panasonic’s net income has been positive since 2014.
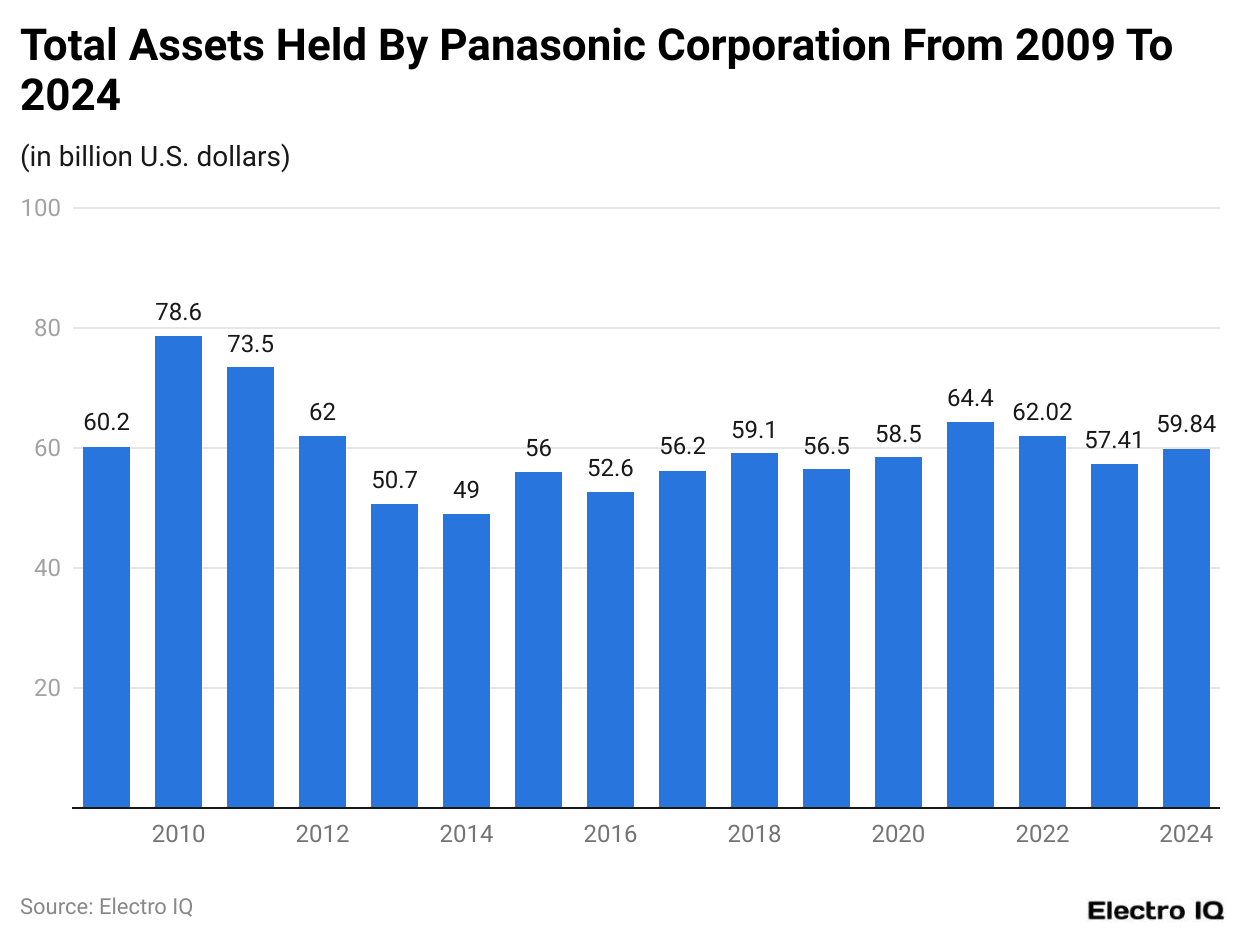
- Panasonic’s total assets peaked in 2010 at USD 78.4 billion between 2009-2024.
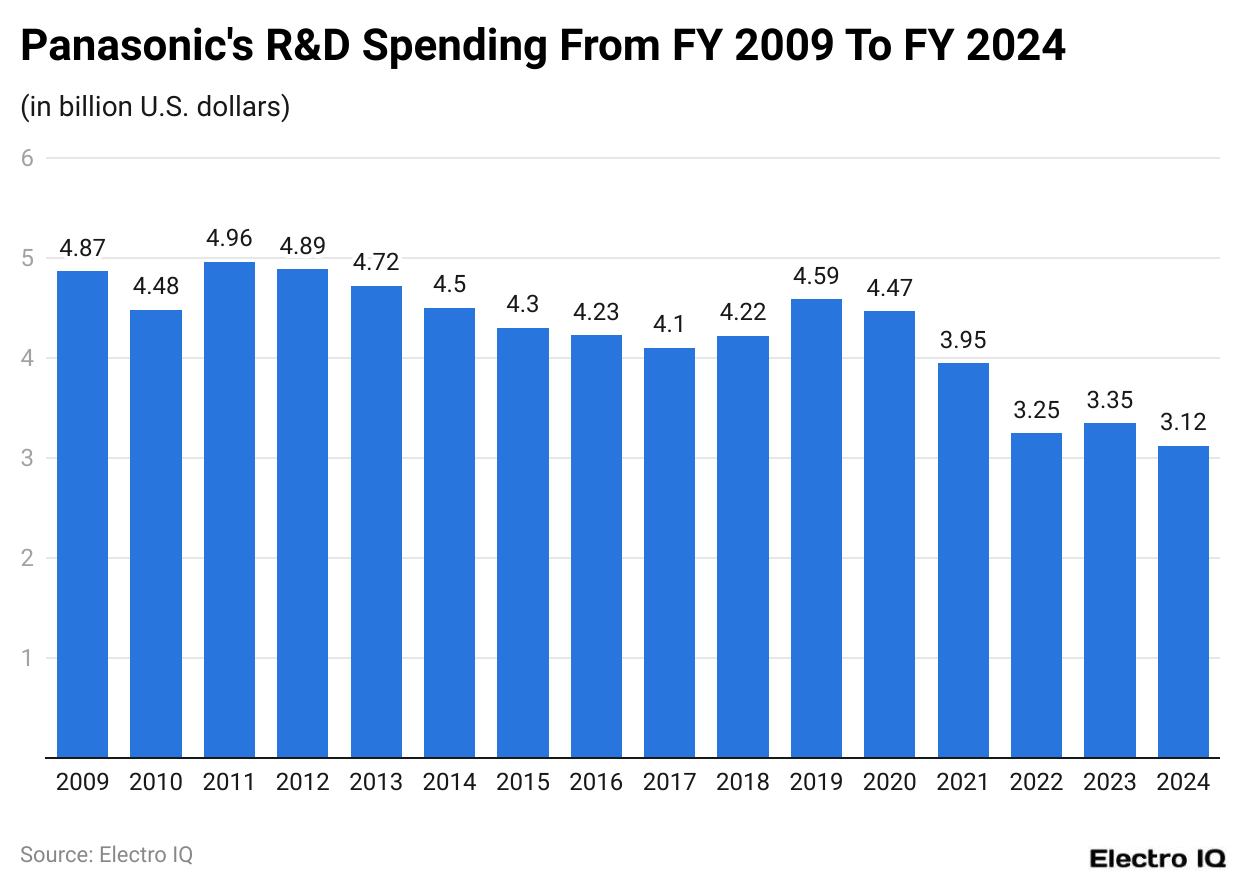
- R&D spending peaked in 2011 at USD 4.96 billion between 2009-2024.
- The number of Panasonic employees has been consistently reducing.
- Sony Group has the highest assets among Japanese electronics companies.
- Canon dominates the global digital camera market with a 46.5% share.
- CATL of China has the highest market share among EV battery manufacturers.
- Panasonic Malaysia’s profit after tax peaked in FY 2016 at 146.9 Malaysian ringgit.
- Panasonic’s Energy Solutions division generated around USD 25 billion in revenue in 2023.
- Panasonic aims for a 5% annual growth rate, mainly from automotive and energy solutions segments.
Panasonic Net Sales
(Reference: Statista.com)
- The Panasonic statistics showcase that the company’s net sales have consistently decreased in the last 15 years.
- Between 2009 and 2024, the highest revenue was recorded at $81.7 billion.
Panasonic Net Sales By Segment
(Reference: Statista.com)
- Panasonic statistics showcase that the revenue from Panasonic holdings can be categorized into six categories: lifestyle, Automotive, Connect, Industry, Energy, and others.
- Lifestyle has the highest category when it comes to sales with 3494.4 billion Yen, Automotive follows it with 1,491.9 billion yen, Other with 1,219.5 billion yen, Connect with 1,202.8 billion yen, Industry with 1,042.6 billion yen, Energy with 915.9 billion yen.
Sales Of Panasonic Electronics By Region
(Reference: Statista.com)
- Panasonic statistics showcase that Asia, China, Europe, North and South America, and Japan rank among the regions with the highest sales.
- Japan has the highest sales with 3404.5 billion Yen, followed by North and South America with 2,121.9 billion yen, Asia with 1,180.8 billion yen, Europe with 978.7 billion yen, and China with 810.5 billion yen.
Panasonic Operating Profit
(Reference: Statista.com)
- Panasonic statistics reveal that the operating profit of the company was highest in 2016 between the period (2015 – 2024) with $3908 million.
- By the end of 2024, Panasonic’s operating profit is predicted to be $2,295 billion.
Panasonic Operating Profit By Segment
(Reference: Statista.com)
- Going through the Panasonic statistics the profit-holding aspects of the company can be divided into the following: lifestyle, Automotive, Connect, Industry, Energy, and others.
- Lifestyle has the highest operating profit with 121.6 billion Japanese yen, followed by Energy at 88.8 billion yen, Other at 59.5 billion yen, Automotive at 42.8 billion yen, Connect at 40.4 billion yen, and Industry at 31.1 billion yen.
Panasonic Net Income
(Reference: Statista.com)
- Going through the Panasonic statistics, it is evident that net income has been positive since 2014.
- By the end of 2024, it is predicted that the net income of the company is expected to be around $3000 million.
- Between the period (2009 – 2024), the lowest net profit was recorded at -$7258.4 billion.
Panasonic Total Assets
(Reference: Statista.com)
- Going through the Panasonic statistics, one would see that the total assets held by the company were highest at $78.4 billion in 2010 between the period (2009 – 2024)
- By the end of 2024, Panasonic’s assets will be $59.8 billion.
Panasonic Research And Development Expenditure
(Reference: Statista.com)
- The Panasonic statistics showcase that the research and development spending of the company is growing at a steady pace.
- Between the period 2009 and 2024, the highest amount of research and development spending was recorded in 2011, with $4.96 billion.
- By the end of 2024, the research and development spending of Panasonic was $3.12 billion.
Panasonic Employees Data
(Reference: Statista.com)
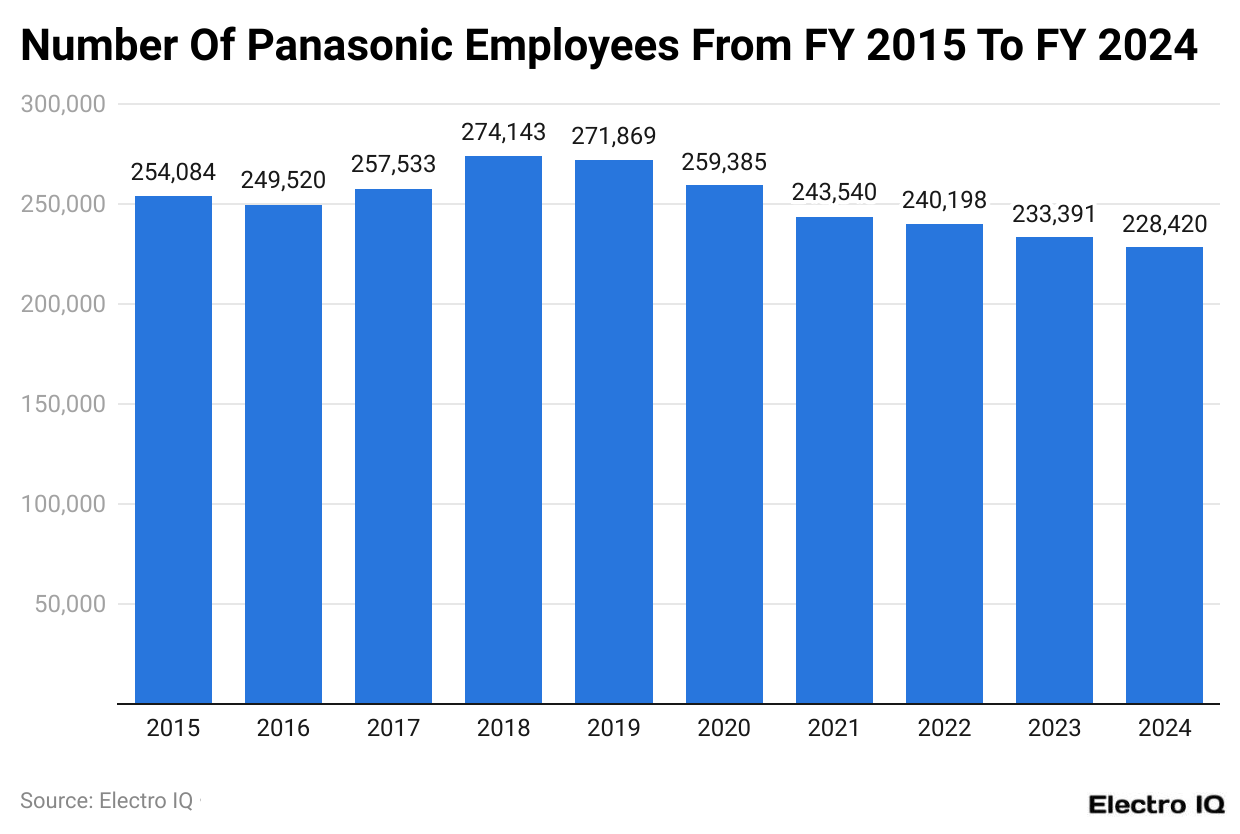
- Going through the Panasonic statistics, it is evident that the number of Panasonic employees is consistently reducing.
- At the end of 2024, the number of Panasonic employees was 228,420.
- Between the period (2015 – 2024) the highest number of employees of Panasonic was 274,143.
Leading Japanese Electronic Goods Companies
(Reference: Statista.com)
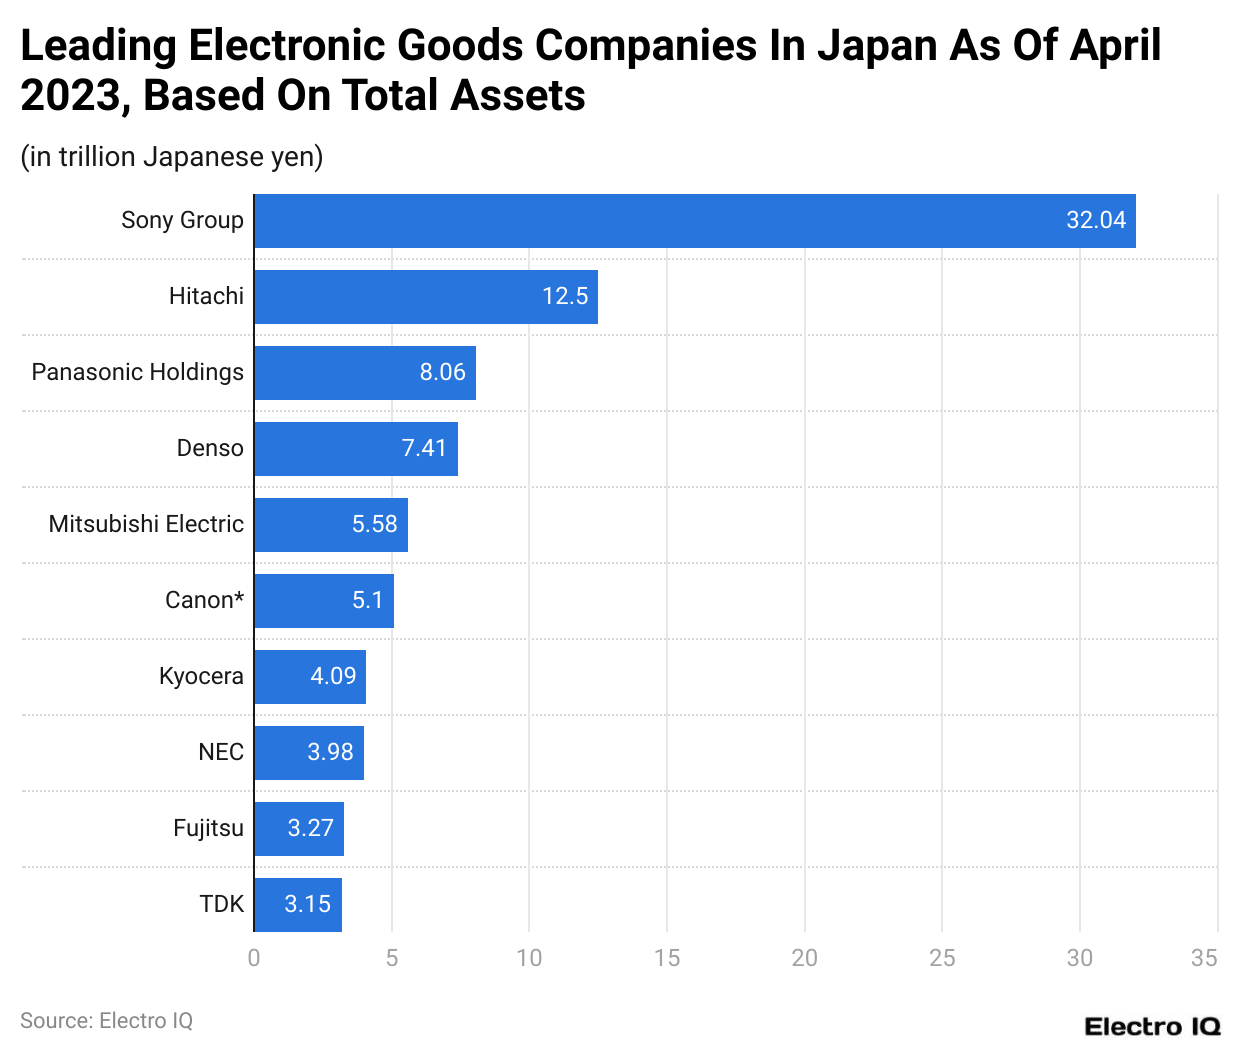
- Going through the Panasonic statistics, it is evident that Sony Group has the highest assets among Japanese electronics companies, with 32.04 trillion Japanese Yen.
- It is followed by Hitachi with 12.5 trillion yen, Panasonic Holdings with 8.06 trillion yen, Denso with 7.41 trillion yen, Mitsubishi Electric with 5.58 trillion yen, Canon with 5.1 trillion yen, Kyocera with 4.09 trillion yen, NEC with 3.98 trillion yen, Fujitsu with 3.27 trillion yen, TDK with 3.15 trillion yen.
(Reference: Statista.com)
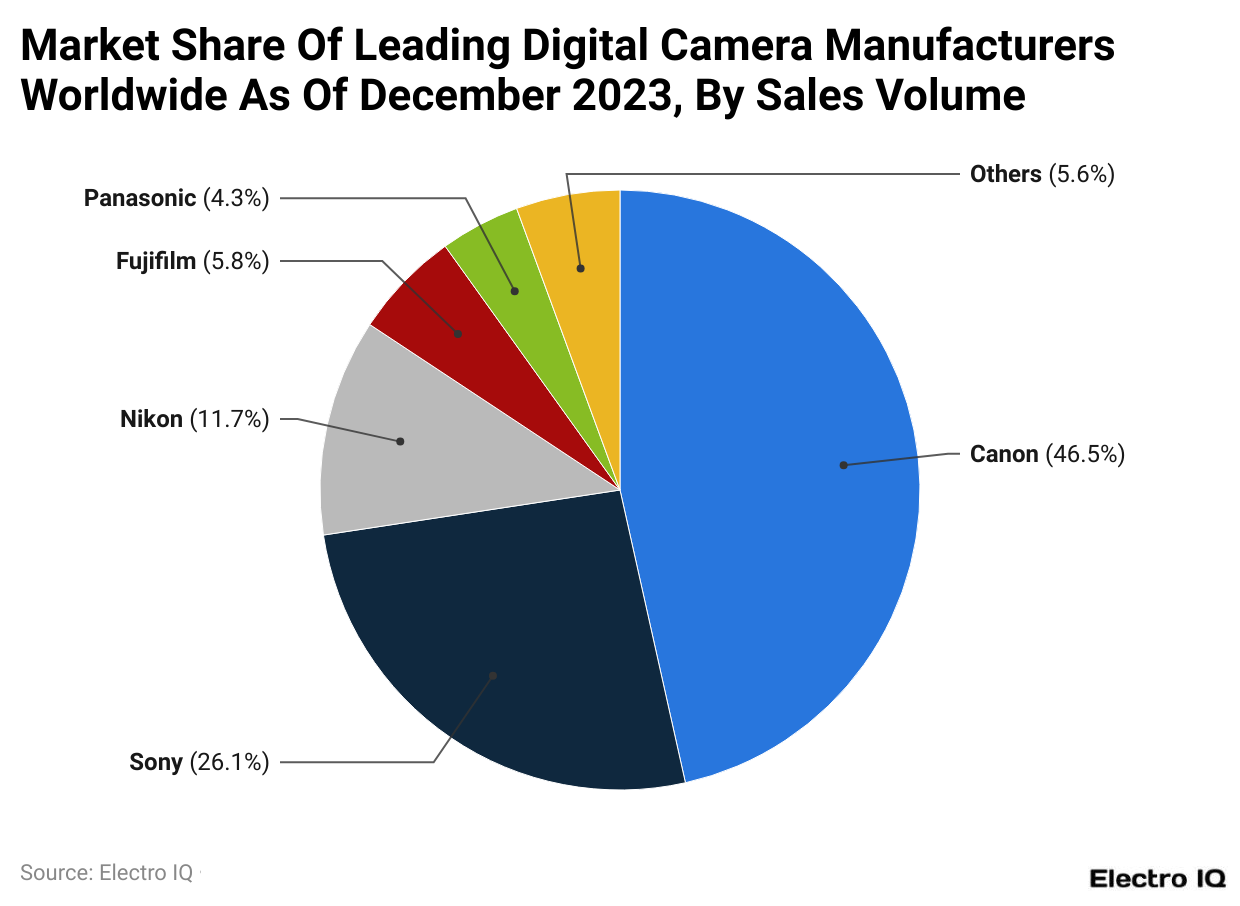
- Panasonic statistics show that Canon has the highest market share among digital camera manufacturers, with 46.5%.
- It is followed by Sony with 26.1%, Nikon with 11.7%, Fujifilm with 5.8%, Other companies with 5.6%, and Panasonic with 4.3%.
EV Manufacturers Worldwide
(Reference: Statista.com)
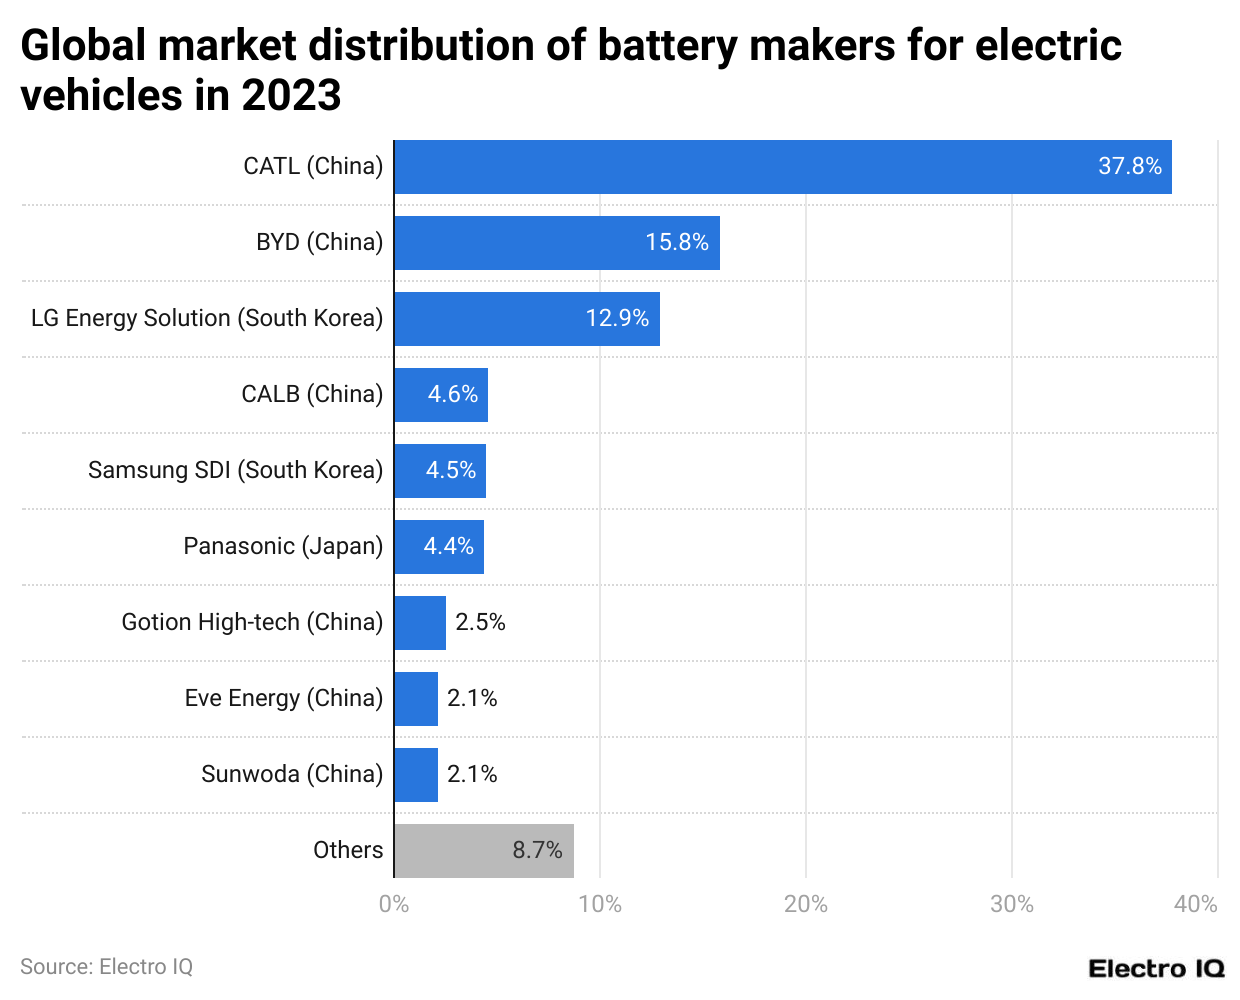
- The Panasonic statistics reveal that CATL of China has the highest market share among EV vehicles.
- It is followed by LG Energy Solution in South Korea at 12.9%, SK On in South Korea at 4.8%, CALB in China at 4.6%, Samsung SDI in South Korea at 4.5%, Panasonic in Japan at 4.4%, Gotion High-tech of China with 2.5%, Eve Energy of China with 2.1%, Sunwoda of China with 2.1%, Others with 8.7%.
Panasonic Malaysia Profit After Tax
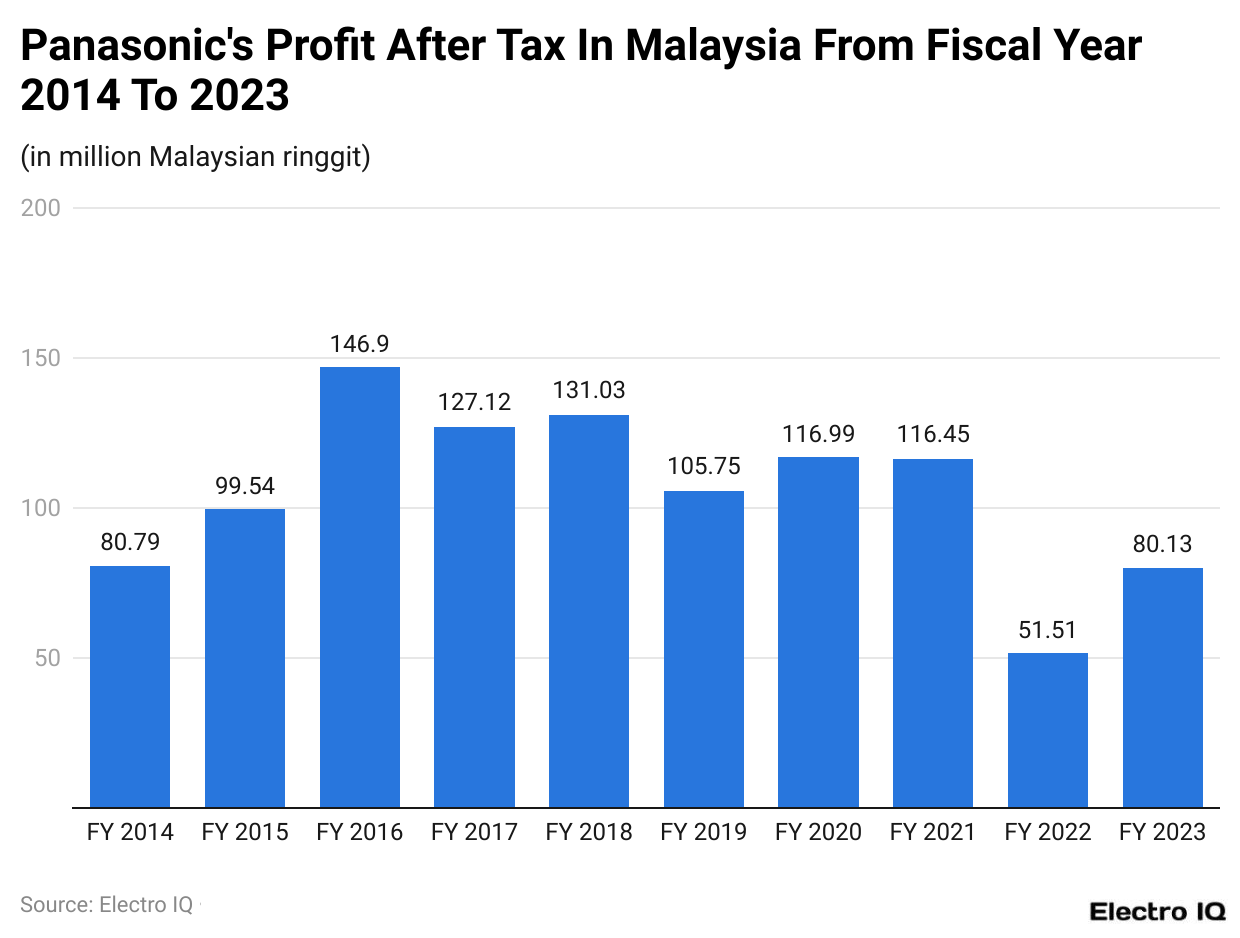
(Reference: Statista.com)
- Panasonic statistics showcase that the profit after tax for Panasonic Malaysia has been variable.
- The highest profit after tax of Panasonic was recorded in FY 2016, with 146.9 Malaysian ringgit.
- By the end of FY 2023, Panasonic’s profit after tax was 80.13 Malaysian Ringgit.
Panasonic Overview
Panasonic Corporation, a global leader in consumer electronics and technology, has remained a significant player in various industries, ranging from home appliances to automotive solutions and batteries. In 2023 and 2024, Panasonic has seen steady growth, particularly in sectors like automotive batteries and energy solutions, where the company is heavily investing to meet growing global demands. This article explores Panasonic’s financial performance, market segments, and innovations through Panasonic Statistics.
#1. Financial Performance
In 2023, Panasonic reported an impressive revenue of $64.9 billion US dollars, a slight increase from its $61.9 billion US dollars revenue in 2022. The growth is primarily driven by the company’s energy solutions division, which focuses on lithium-ion batteries for electric vehicles (EVs), and its automotive division. Panasonic continues to be a major supplier of EV batteries, especially to large automakers like Tesla.
By 2024, Panasonic is expected to see an even higher revenue, reaching $66.5 billion US dollars, as global demand for electric vehicles continues to rise and the company further invests in renewable energy solutions. Panasonic Statistics indicate that the company is targeting a 5% annual growth rate, mainly from the automotive and energy solutions segments.
#2. Key Business Segments
Panasonic operates in several core business segments, each contributing to its overall financial performance. The major segments include Energy Solutions, Connected Solutions, Appliances, and Automotive Solutions. Let’s take a deeper dive into the numbers for each of these segments.
- Energy Solutions Panasonic’s Energy Solutions division, which focuses on batteries and renewable energy, has experienced the most significant growth. In 2023, this division generated around $25 billion US dollars, accounting for nearly 39% of the company’s total revenue. This is an increase from $22.8 billion US dollars in 2022. The growth is largely driven by Panasonic’s partnership with Tesla and other automakers, as well as the global push toward renewable energy sources. For 2024, Panasonic Statistics forecast revenue growth to approximately $26.7 billion US dollars, due to higher demands for EV batteries and other sustainable energy products.
- Connected Solutions The Connected Solutions division, which focuses on business-to-business solutions, including industrial IoT (Internet of Things) and information and communication technology, contributed around $15.3 billion US dollars in 2023. This figure represents a 4% increase from 2022, where revenue was $14.7 billion US dollars. Panasonic Statistics for 2024 estimate the division’s revenue to grow modestly to $15.8 billion US dollars, driven by innovations in smart factories, automation, and digital transformation across industries.
- Appliances Panasonic is well-known for its home appliances, such as refrigerators, washing machines, and air conditioners. In 2023, the appliances segment accounted for approximately $18 billion US dollars of total revenue. Despite competition in this sector, the company saw an increase from $17.3 billion US dollars in 2022. However, Panasonic Statistics suggest that in 2024, growth in this sector will remain relatively flat, reaching $18.2 billion US dollars due to market saturation and increased competition from other appliance manufacturers.
- Automotive Solutions The Automotive Solutions division continues to perform well, especially with the rising demand for electric vehicles. Panasonic’s automotive battery business alone contributed around $6.6 billion US dollars in 2023. This marks a 7% increase from $6.1 billion US dollars in 2022. For 2024, Panasonic Statistics predicts this segment will continue to grow, with expected revenue of around $7.1 billion US dollars, bolstered by higher battery production capacities and increasing electric vehicle adoption globally.
#3. Investments and Innovations
Panasonic has been investing heavily in research and development, particularly in the fields of energy storage and renewable energy. In 2023, the company spent approximately $3.4 billion US dollars on research and development, focusing primarily on improving lithium-ion battery technology. Panasonic Statistics indicate that this investment will likely increase to $3.6 billion US dollars in 2024 as the company aims to stay ahead in the competitive EV battery market.
One of Panasonic’s most notable innovations in 2023 was the development of new high-density battery cells for Tesla’s EVs. These battery cells offer higher energy storage capacity and longer life cycles, contributing to the overall performance and range of electric vehicles. By 2024, Panasonic plans to expand its battery production facilities in the United States, which is expected to result in a 15% increase in battery output.
Panasonic is also making strides in energy storage solutions for homes and businesses. In 2023, the company launched new home battery storage systems, allowing consumers to store solar energy more efficiently. This product is expected to become a key growth driver for the Energy Solutions division in 2024, as more consumers and businesses seek renewable energy storage options.
#4. Global Market Share
In terms of global market share, Panasonic holds a strong position in the EV battery market, with a 21% share in 2023. This places Panasonic among the top three global manufacturers of electric vehicle batteries, alongside companies like CATL and LG Energy Solution. Panasonic Statistics for 2024 predict that the company will maintain its market share as it ramps up production and strengthens partnerships with automakers like Tesla, Toyota, and Volkswagen.
Panasonic’s home appliance segment also commands a significant market share, particularly in Asia and Europe. The company holds a 12% market share in the global home appliances industry, making it a key player in this competitive market. However, Panasonic Statistics suggest that the company may face challenges in maintaining this market share due to increasing competition from Chinese manufacturers.
#5. Sustainability Efforts
Panasonic is also focusing on sustainability and has set ambitious targets to reduce its carbon footprint. The company aims to become carbon neutral by 2050, and as part of this effort, it has committed to reducing its CO2 emissions by 30% by 2030. In 2023, Panasonic made significant progress toward this goal by increasing the use of renewable energy in its production facilities. By 2024, the company plans to invest in more renewable energy projects, which will further reduce its environmental impact and contribute to its sustainability objectives.
Conclusion
Panasonic the leader in consumer electronics, has remained a strong imprint among its customers. As a result, it has showcased robust resilience in the wake of changing market dynamics. Panasonic statistics show that the company’s partnership with Tesla and other automakers has solidified its position in the EV battery market, holding a significant 21% market share.
Panasonic’s strategic focus on high-growth, future-oriented technologies suggests a promising outlook for the company’s continued relevance and growth in the global technology landscape. While challenges remain, the company is expected to thrive.
FAQ.
Panasonic is a Japanese multinational company that produces consumer electronics, rechargeable batteries, automotive systems, and industrial parts.
Panasonic reported a revenue of $64.9 billion US dollars in 2023.
The Energy Solutions division, focusing on batteries and renewable energy, is Panasonic’s largest segment.
Tesla is Panasonic’s major partner in the EV battery market.
Panasonic held a 21% market share in the global EV battery market in 2023.
In 2023, Panasonic spent approximately US$ 3.4 billion on research and development.
Panasonic aims to become carbon neutral by 2050 and reduce CO2 emissions by 30% by 2030.
Japan has the highest sales for Panasonic, followed by North and South America.
As of 2024, Panasonic had 228,420 employees.
Panasonic holds a 12% market share in the global home appliances industry.

Maitrayee Dey has a background in Electrical Engineering and has worked in various technical roles before transitioning to writing. Specializing in technology and Artificial Intelligence, she has served as an Academic Research Analyst and Freelance Writer, particularly focusing on education and healthcare in Australia. Maitrayee's lifelong passions for writing and painting led her to pursue a full-time writing career. She is also the creator of a cooking YouTube channel, where she shares her culinary adventures. At Smartphone Thoughts, Maitrayee brings her expertise in technology to provide in-depth smartphone reviews and app-related statistics, making complex topics easy to understand for all readers.


