Printed Electronics Statistics By Revenue And Sales
Updated · Sep 12, 2024
Table of Contents
- Introduction
- Editor’s Choice
- IT Spending Worldwide
- IT Spending Growth Forecast
- Revenue of Printers and Copiers Worldwide
- The Revenue Growth Rate of The Printer And Copier Market
- Per Capita Revenue of Printers And Copiers Worldwide
- The volume of Printers And Scanners
- Sales Volume Change of Printers And Scanners
- Average Price of Printers And Copiers
- Distribution of Computer Peripheral Market
- Hardcopy Peripheral Shipments of Printed Materials in Western Europe
- Industrial Printer Shipments in the CEMA Region
- Share of Computer Peripherals Worldwide
- Global Shipments of Hardcopy Peripherals
- Industrial Printer Quarterly Shipment Growth Worldwide
- Shipments Worldwide of Harcopy Peripheral Vendors
- Hardcopy Peripheral Market Share Worldwide
- Hardcopy Peripheral Market Share By Quarter
- Printed Electronics Market Overview
- Conclusion
Introduction
Printed Electronics Statistics: A printer is a device that develops readable material or graphics based on paper or similar printed material. It is a convenient medium for businesses and individuals to obtain readily available written material or visuals. In the past, printing material was not economically feasible. However, with the advent of technology, printed material became faster and more accessible.
By reviewing printed electronics statistics, one can see the growth of printer technology and how it has impacted other businesses worldwide and their development in specific regions altogether.
Editor’s Choice
- Global IT spending is estimated to reach $5,267.17 billion by the end of 2024.
- Software showed the highest year-on-year growth of 9.3% in the IT sector by the end of 2023.
- The printer and copier industry revenue is predicted to reach $10.17 billion by 2029.
- In 2020, there was a high growth rate of 11.58% in printer and copier revenue worldwide.
- The volume of printers and scanners is expected to reach 108.24 million units by 2029.
- The average price of printers and copiers is estimated to decrease to $93.97 by 2029.
- Asia Pacific region held 42.9% of the computer peripheral market revenue in 2019.
IT Spending Worldwide
(Reference: statista.com)
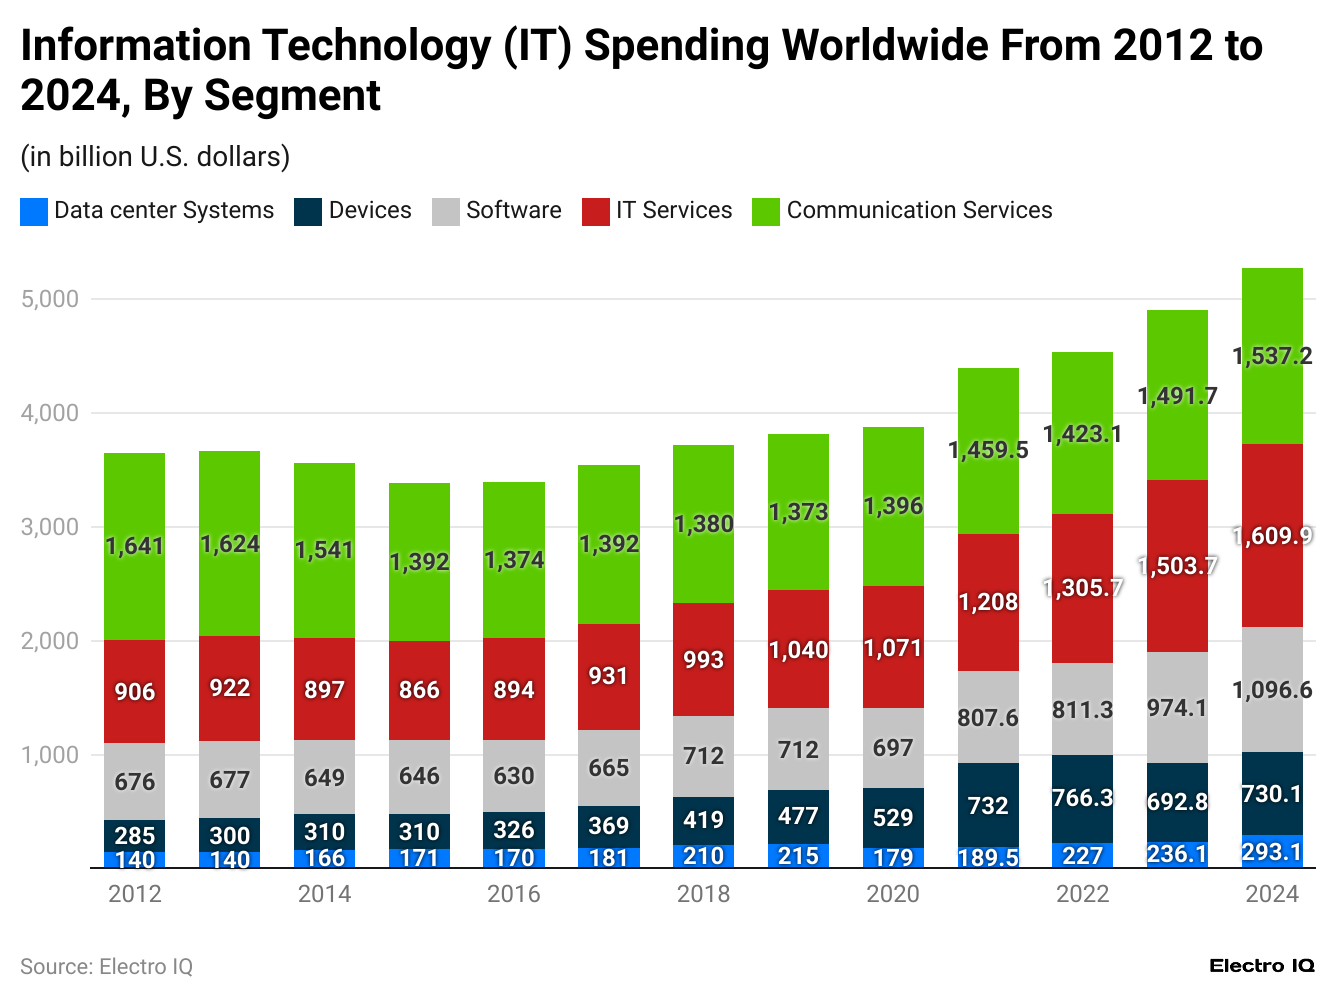
- The spending in the IT industry has been consistently increasing. The expenditure can be classified into data center systems, devices, software, IT, and communication services.
- Since 2012, Communication services have had the highest revenue segment in the IT department.
- The printed, electronic statistics showcase that in 2023, Communication systems were the top contributor, with $1,491.73 billion in revenue.
- It is followed by IT Services, which contributed $1,503.7 billion; Software, which contributed $974.09 billion; Devices, which contributed $692.78 billion; and Data Center Systems, which contributed $236.1 billion to the total revenue, which accounted for $4,898.4 billion.
- The IT industry is estimated to contribute $5,267,17 billion in revenue by the end of 2024
IT Spending Growth Forecast
(Reference: statista.com)
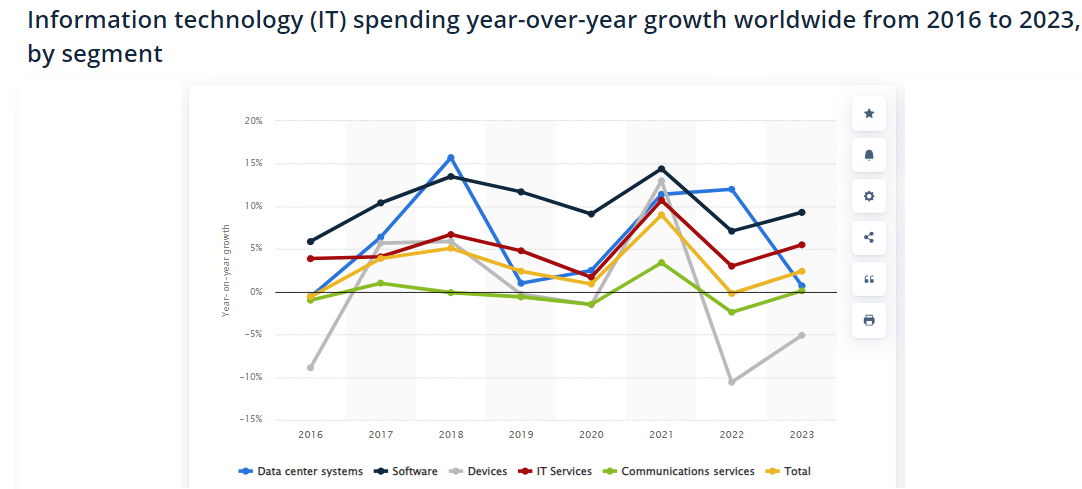
- The printed electronic statistics showcases that the IT spending year-on-year growth has mostly been positive.
- In 2016, the software industry component of the IT sector showed positive year-on-year growth of 5.9%, while the remaining components, namely Data center systems, devices, IT services, and communication services, showed negative growth, resulting in overall negative growth of 0.6%.
- By the end of 2023, software still was the highest segment, with 9.3% year-on-year technology growth. With the expectation of devices, all the other components showed positive growth, resulting in a total growth of 2.4%.
Revenue of Printers and Copiers Worldwide
(Reference: statista.com)
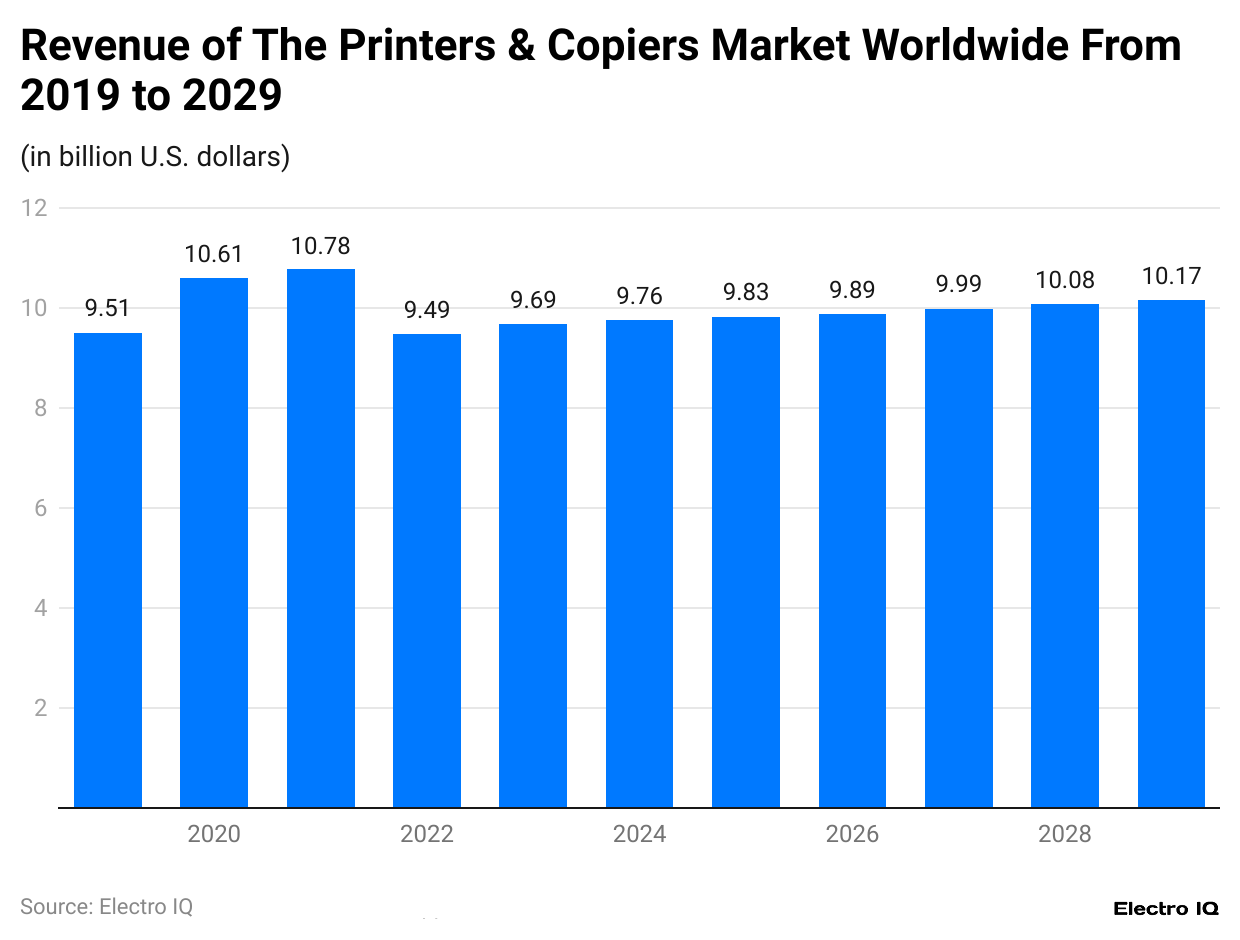
- The printer electronic statistics reveal that there has been a considerable increase in the revenue of printers and copiers worldwide.
- By the end of 2023, there was $9.69 billion in revenue from the printer and copier industry.
- It is predicted that by the end of 2029, the revenue of the printer and copiers market will reach $10.17 billion.
The Revenue Growth Rate of The Printer And Copier Market
(Reference: statista.com)
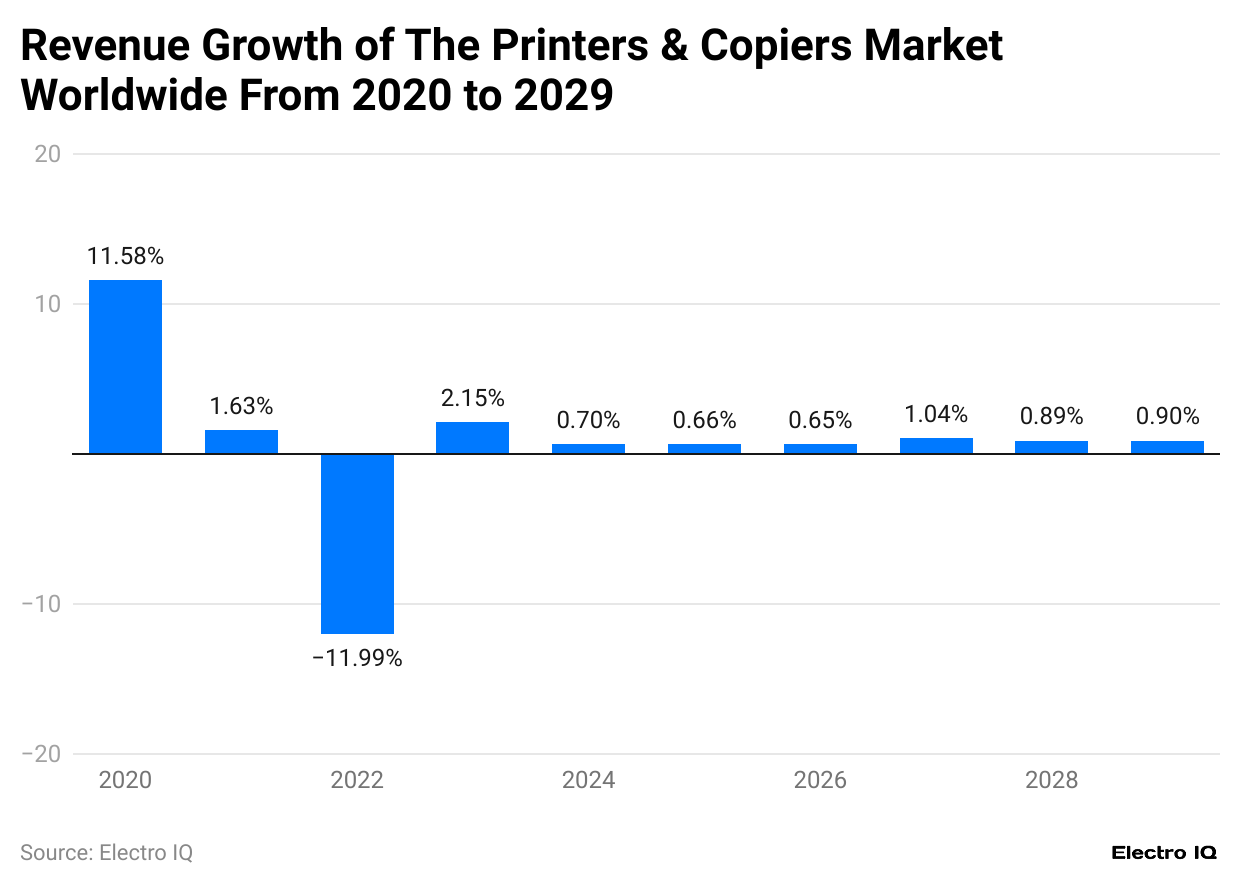
- The printed electronic statistics showcase a variable growth rate in the printers and copiers market worldwide.
- In 2020, there was a high growth rate of 11.58% in terms of revenue of printers and copiers worldwide.
- In contrast, in 2022, there was a significant decrease in the growth rate of almost 12%.
- It is predicted that printer and copier revenue will increase by 0.9% by the end of 2029.
Per Capita Revenue of Printers And Copiers Worldwide
(Reference: statista.com)
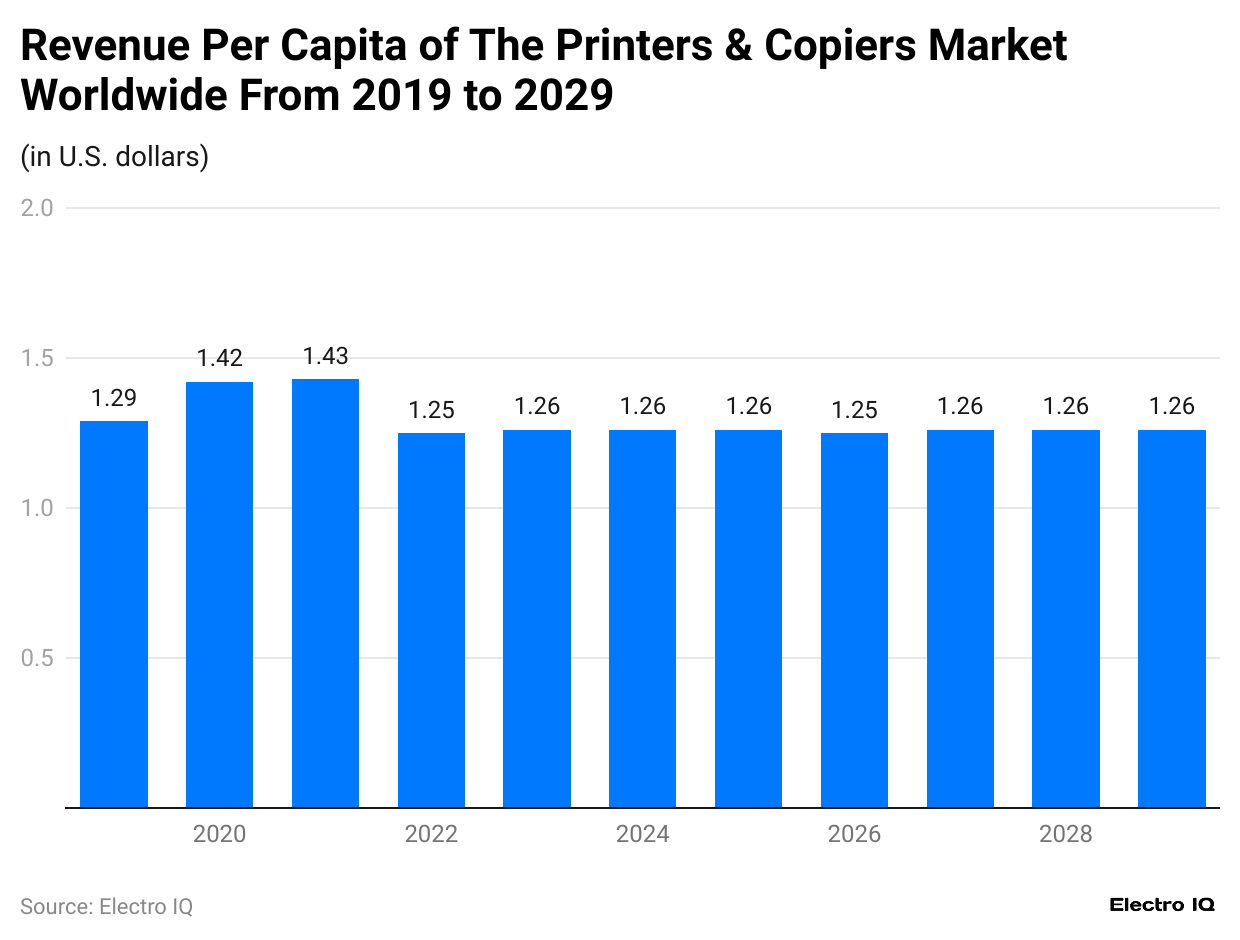
- The printed electronics statistics showcase that there has been an almost consistent revenue per capita of printers and copiers worldwide.
- By the end of 2023, the revenue per capita of printers was $1.26.
- By the end of 2029, the revenue per capita is still expected to be $1.26, showcasing that the printers and copier market has a stable revenue level.
The volume of Printers And Scanners
(Reference: statista.com)
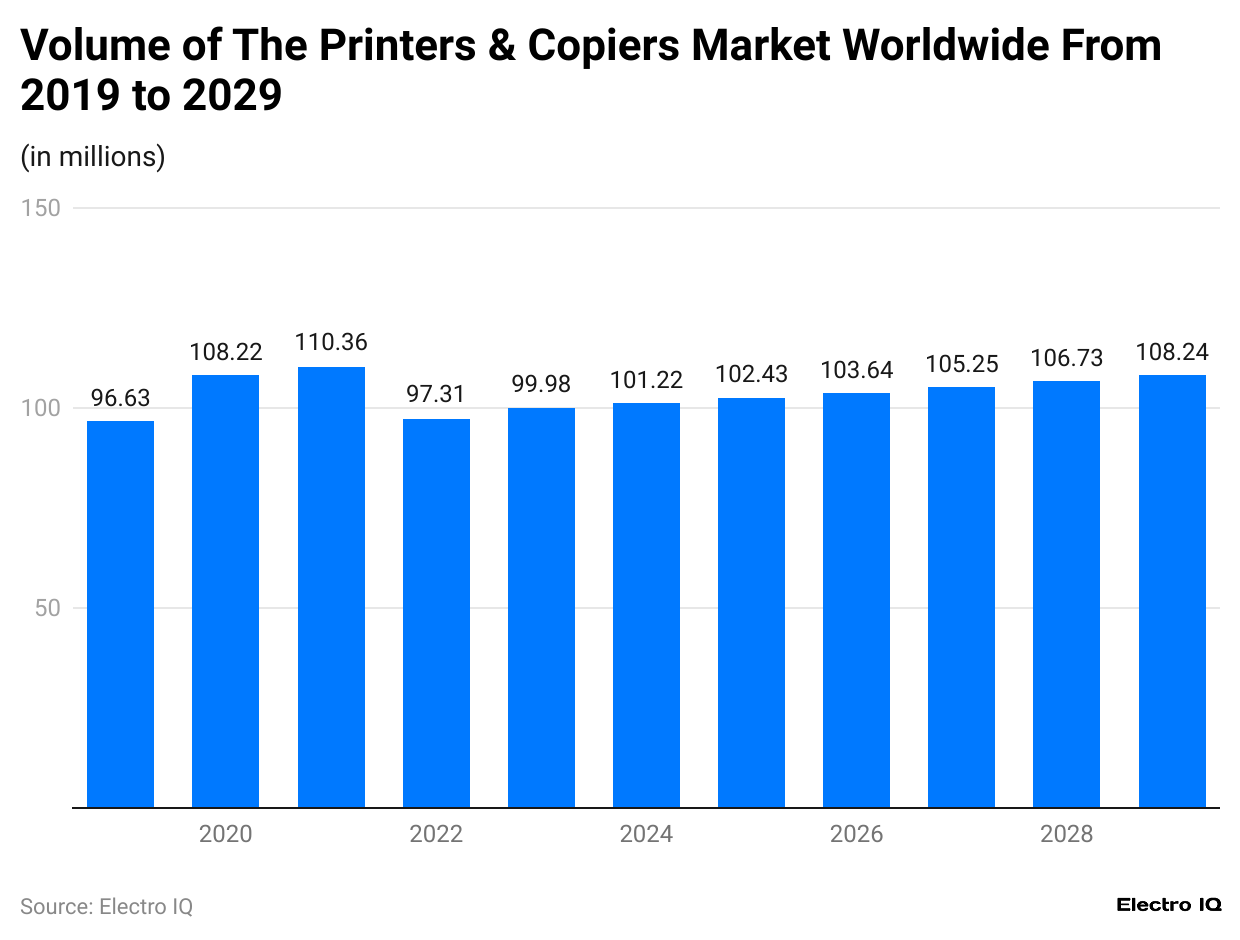
- The printed electronics statistics show that by the end of 2023, the volume of printers and scanners will be 99.98 million units.
- It is predicted that by the end of 2029, the volume of the printer and scanner market will be 108.24 million units, displaying that the printer and scanner market is growing consistently.
Sales Volume Change of Printers And Scanners
(Reference: statista.com)
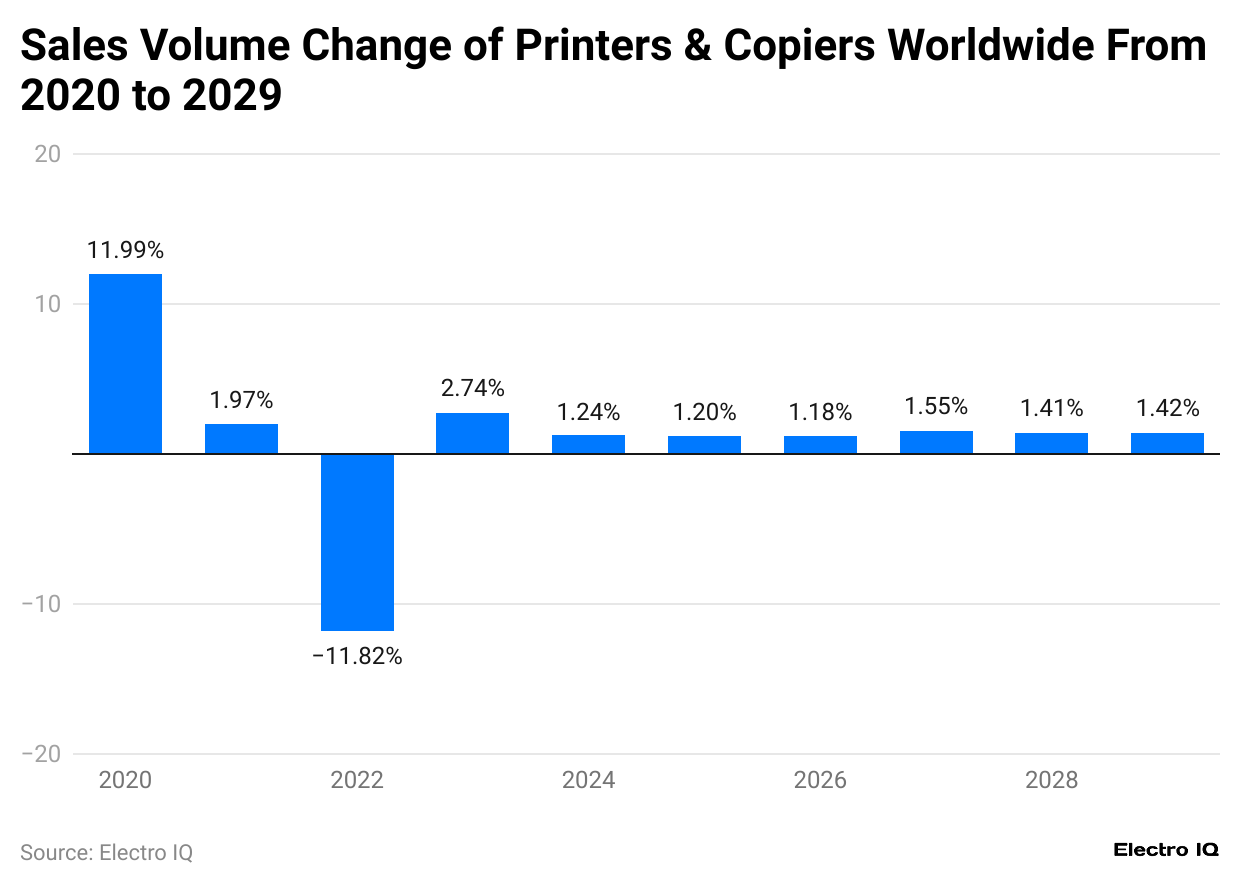
- The printed electronic statistics showcase that there is a variable change in the volume of printers and copiers worldwide.
- In 2020, there was a positive increase of 11.99% in the overall volume of printers and copiers.
- In contrast, at the end of 2022, the volume change in printers and copiers worldwide was negative at -11.82%.
- It is predicted that by the end of 2029, the volume change in printers and copiers worldwide will be +1.42%.
Average Price of Printers And Copiers
(Reference: statista.com)
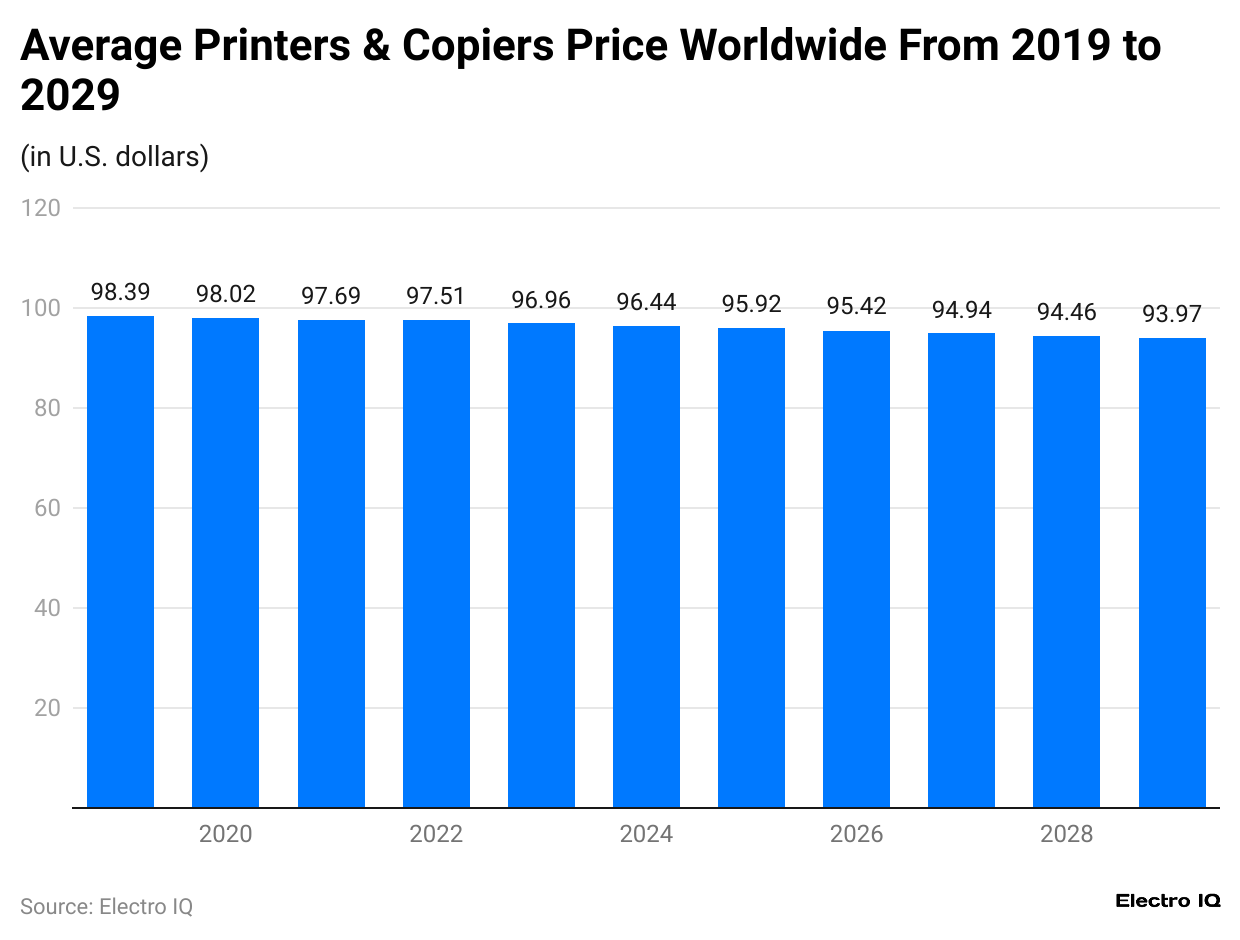
- The printed electronics statistics reveal that the average price of printers and copiers has been consistently decreasing.
- While in 2019 the average price of a printer and copier was $98.39 it reduced to $96.96 by the end of 2023.
- It is estimated that by the end of 2029, the average price of printers would be $93.97.
Distribution of Computer Peripheral Market

(Reference: statista.com)
- The printer electronics statistics reveal that the computer peripheral market can be divided into the regions of Asia Pacific, America, and EMEA regions.
- Asia Pacific region has consistently been the region with the highest revenue generation.
- As of 2019, the Asia Pacific region had 42.9% revenue, followed by the Americas with 31% revenue and EMEA with 26% revenue.
Hardcopy Peripheral Shipments of Printed Materials in Western Europe

(Reference: statista.com)
- The printed electronic statistics reveal that the hardcopy shipments were variable.
- By the end of Q1 2021, the hardcopy shipment will be 5.15 million units.
Industrial Printer Shipments in the CEMA Region
(Reference: statista.com)
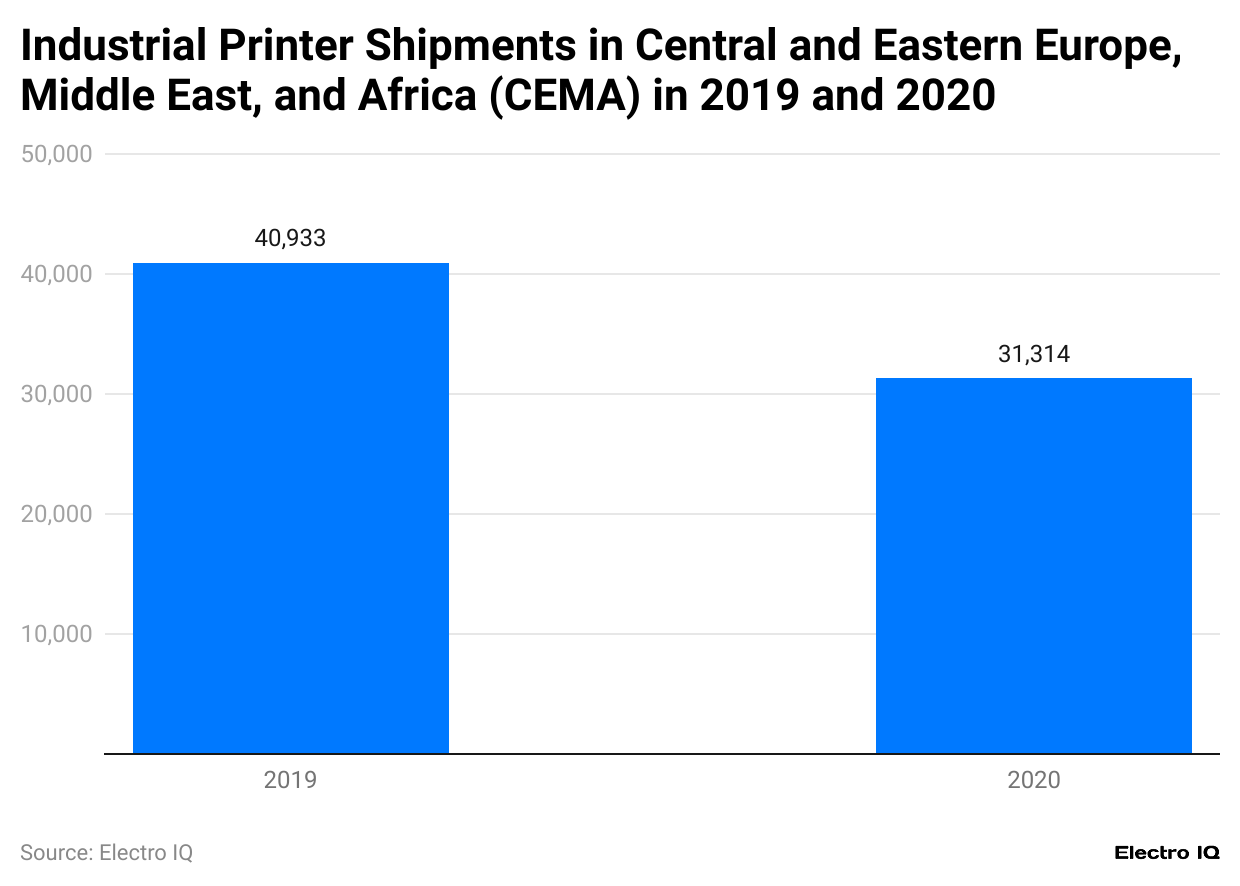
- The printed electronic statistics reveal that industrial printer shipments worldwide have been consistently decreasing.
- In 2019, the industrial printer shipments with 40,933 million units.
- The printer shipments worldwide in 2019 decreased to 31,314 million units.
(Reference: statista.com)
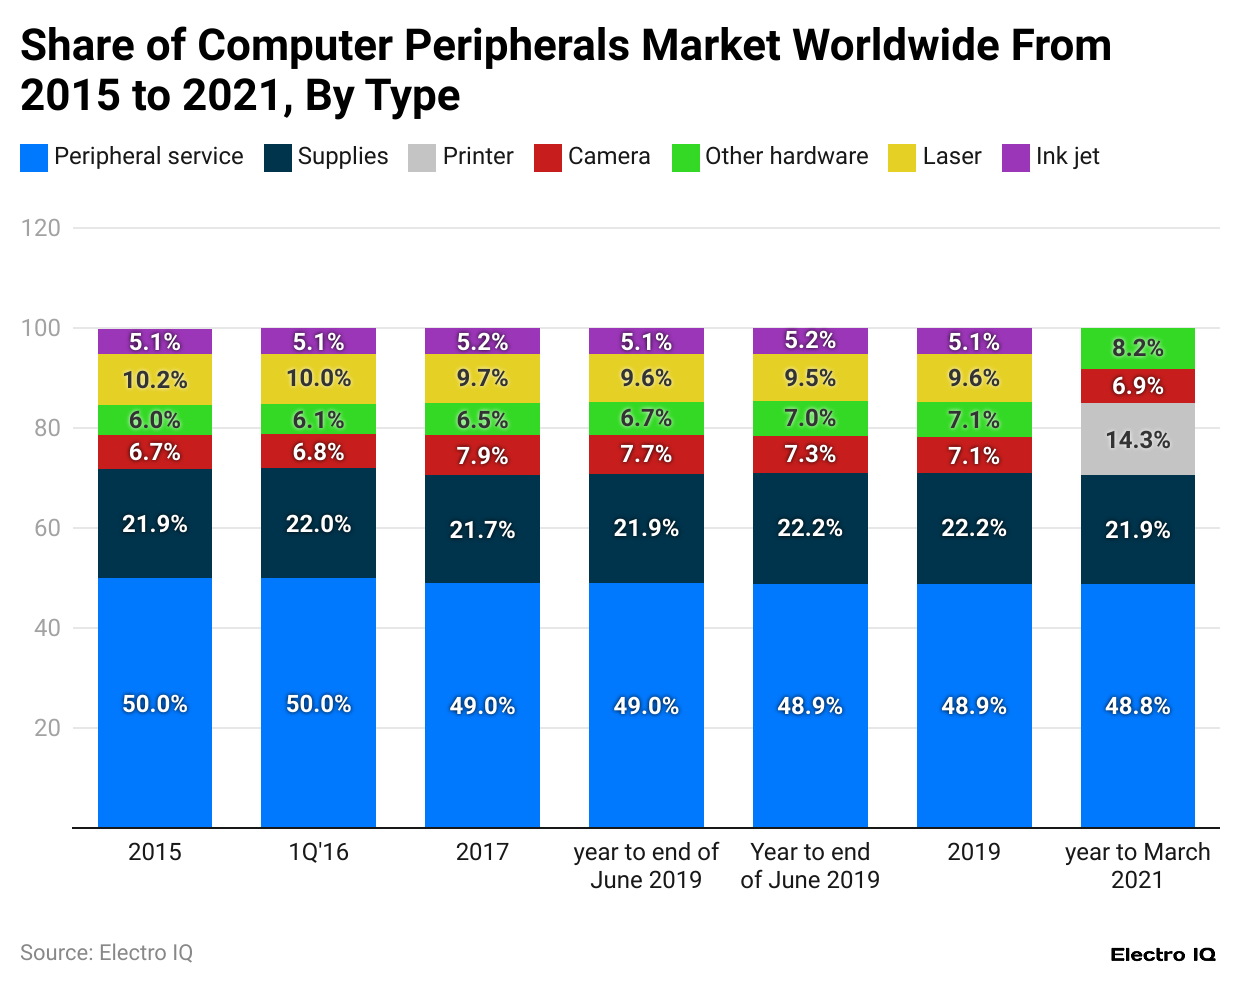
- The printed and electronic statistics reveal that computer peripheral services had the highest share of computer peripherals in the peripheral market worldwide.
- As of March 2021, the peripheral service had a 48.8% market share, followed by Supplies at 21.9%, Printers at 14.3%, Other hardware at 8.2%, and Camera with a 6.9% market share.
Global Shipments of Hardcopy Peripherals
(Reference: statista.com)
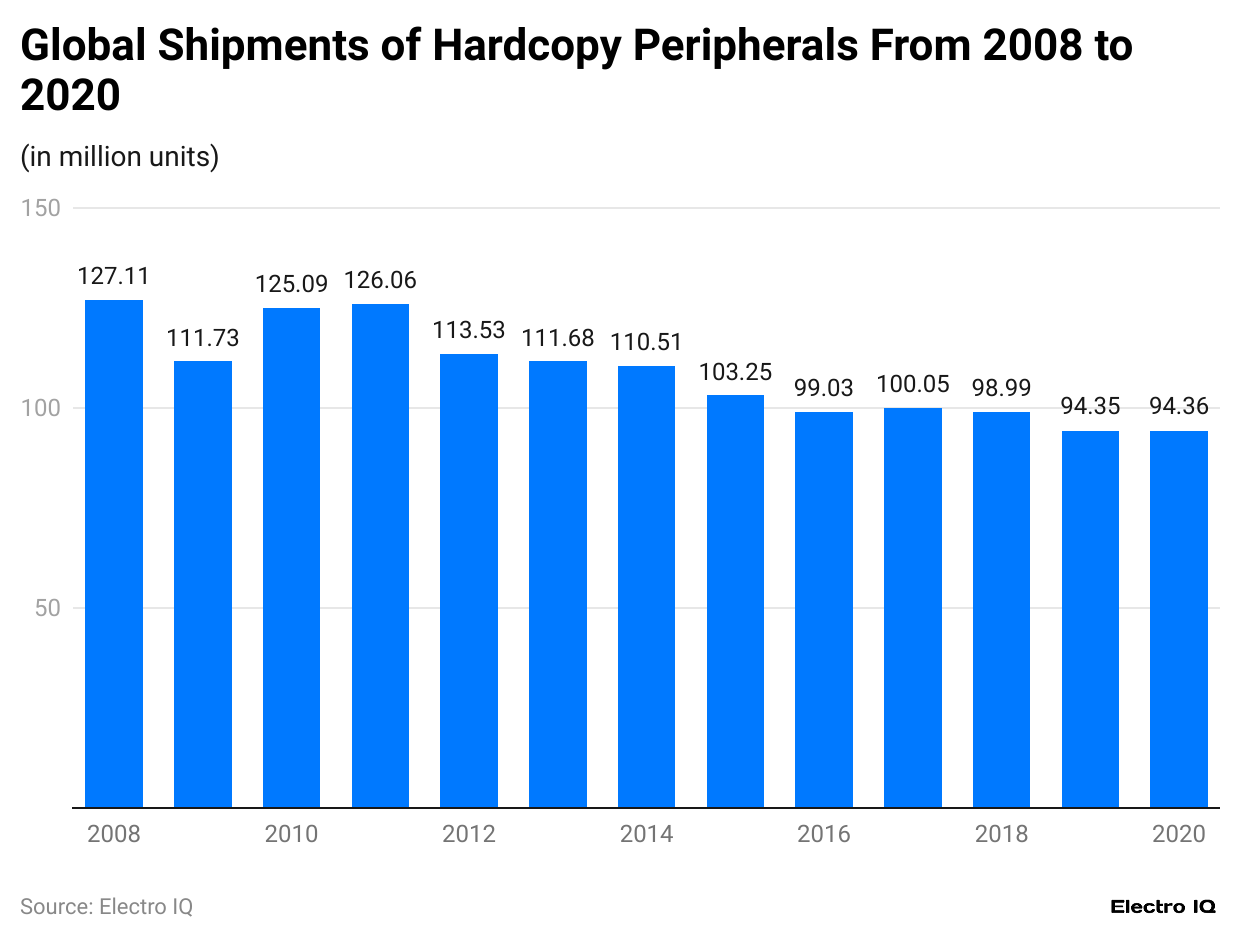
- The printed electronics statistics showcase that global shipments of hardcopy peripherals have been decreasing consistently over time.
- By the end of 2020, the global shipments of hardcopy peripherals in the computer market were 94.36 million units.
Industrial Printer Quarterly Shipment Growth Worldwide
(Reference: statista.com)
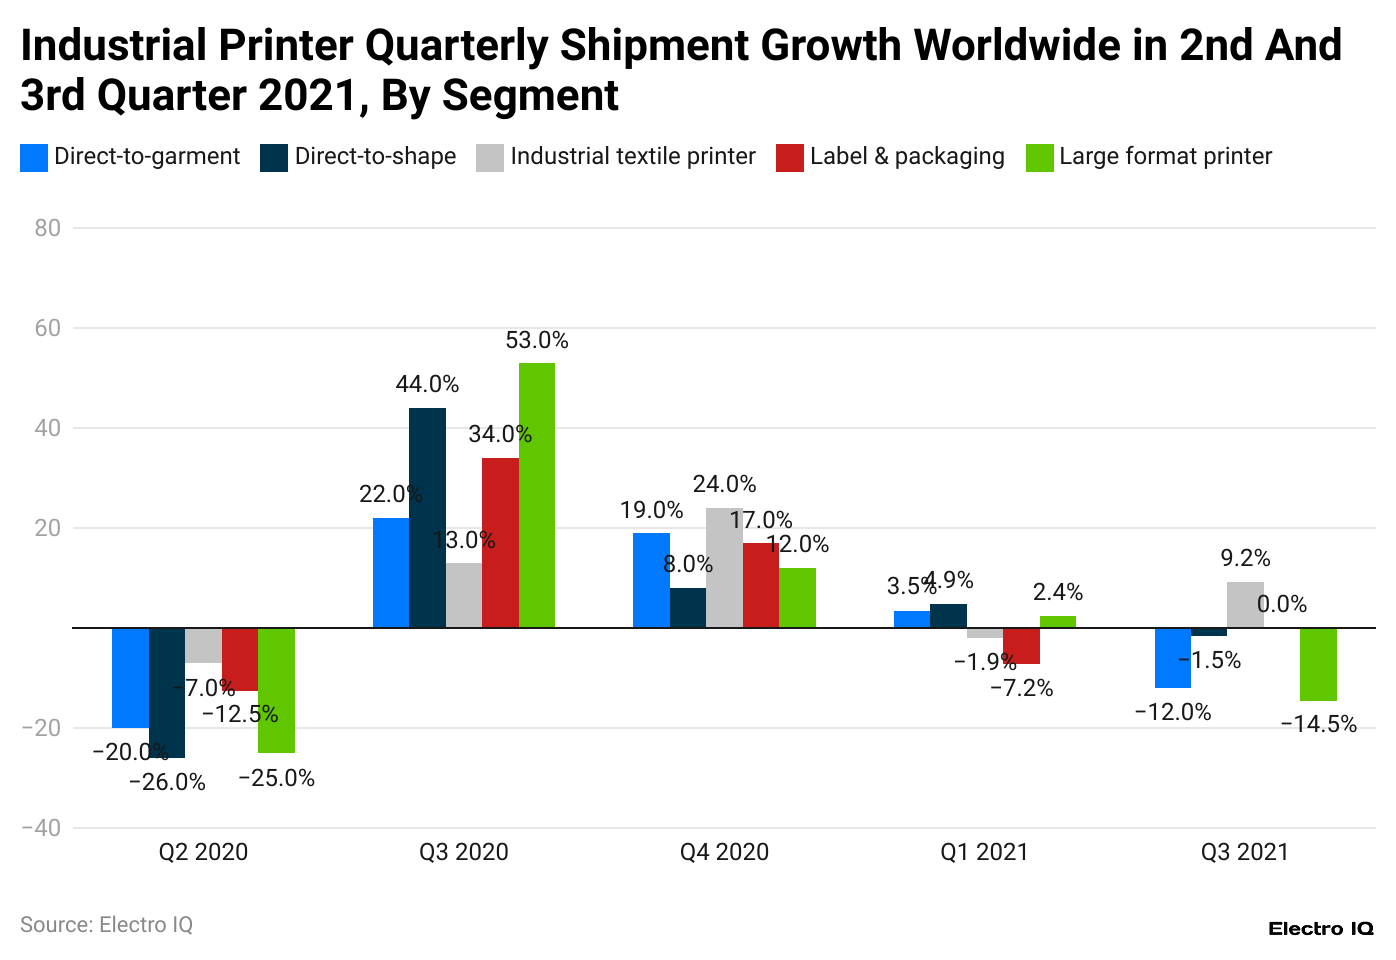
- The printed electronics statistics reveal that the industrial printers department can be divided into five categories: direct-to-garment, direct-to-shape, industrial textile, label and packaging, and large-format printer.
- Among the five categories, large format printers had the largest share in Q3 2020, with 53%.
- In Q3 2021, only industrial textile printers showcased the highest growth, with 9.2%, while other industries showed no growth to negative growth worldwide.
Shipments Worldwide of Harcopy Peripheral Vendors

(Reference: statista.com)
- The printed electronics statistics reveal that HP Inc. had the highest number of hardcopy shipments in Q3 2023, with 7.04 million units.
- It is followed by Epson with 4.65 million shipments, Canon with 4.47 million shipments, Others with 2.35 million shipments, Brother with 2.03 million shipments, and Pantum with 0.55 million shipments.
(Reference: statista.com)
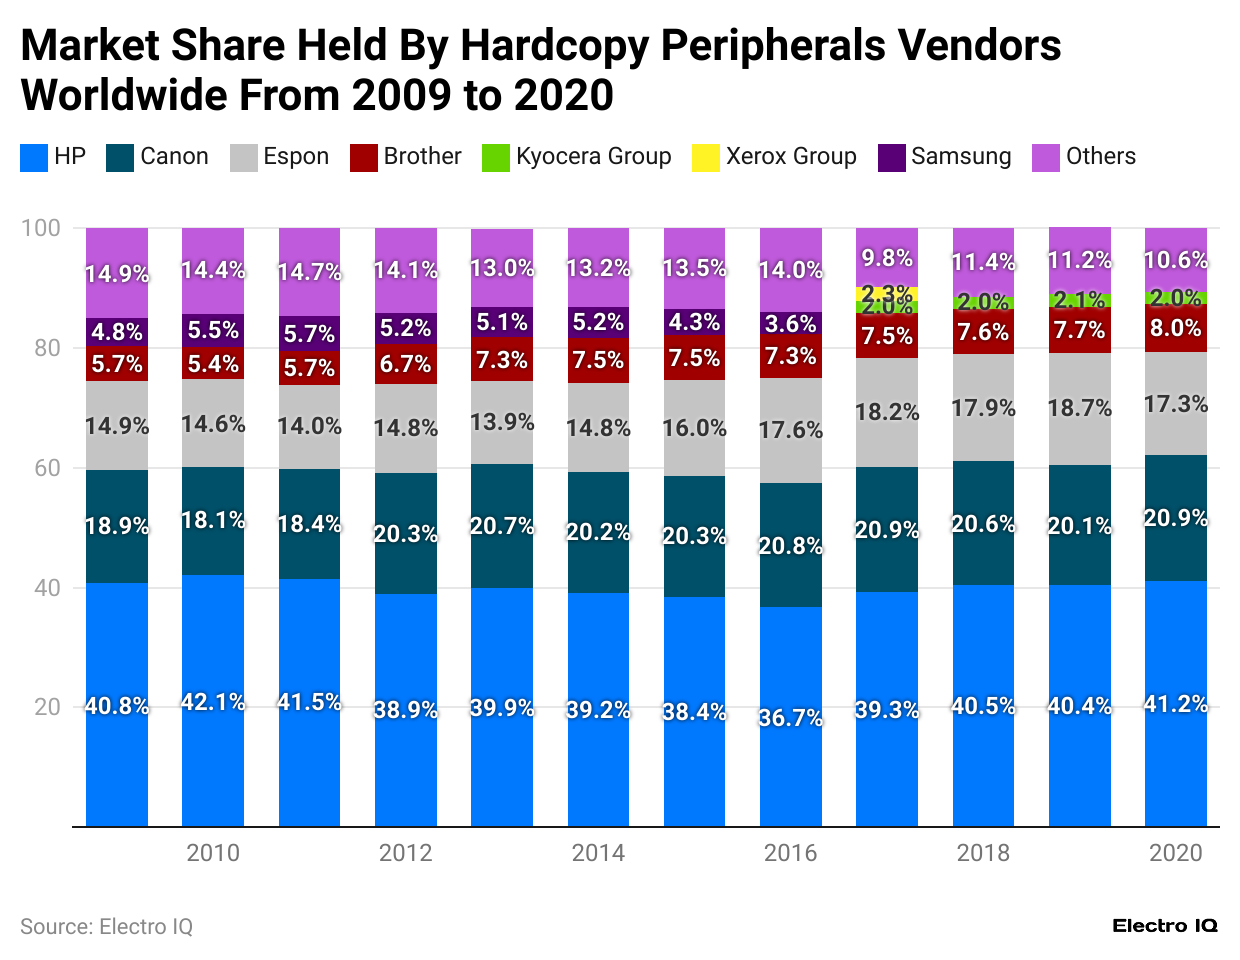
- The printed electronic statistics reveal that HP consistently has the highest market share among the hardcopy peripheral providers.
- As of 2020, HP had a market share of 41.2%
- It is followed by Canon with 20.9% market share, Epson with 17.3% market share, Others with 10.6% market share, Brother with 8% market share, and Kyocera Group with 2% market share.
(Reference: statista.com)
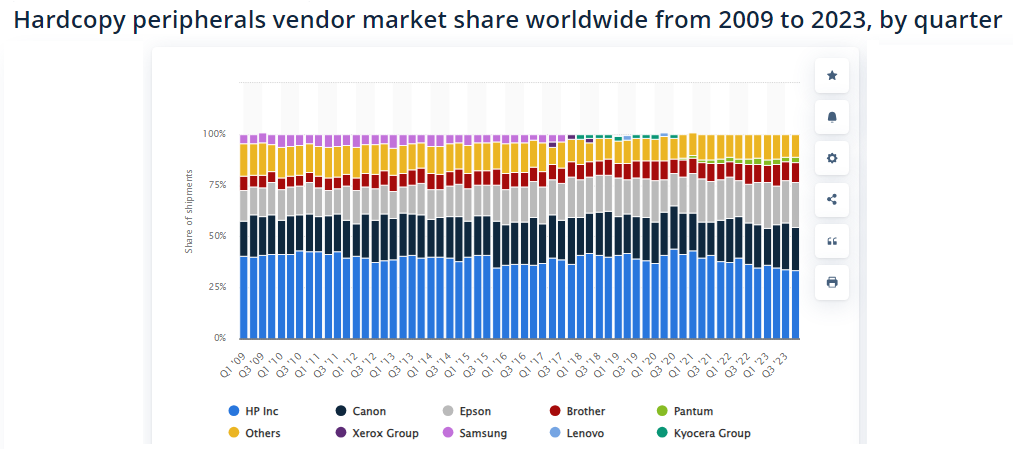
- The printed electronic statistics reveal that HP consistently has the highest market share per quarter.
- In Quarter 3, 2023, HP had a 33.4% market share.
- It was followed by Epson with 22.1% market share, Canon with 21.2% market share, Others with 11.1% market share, Brother with 9.6% market share, and Pantum with 2.6% market share.
Printed Electronics Market Overview
- The printed electronics market has experienced significant growth in recent years, and its outlook for 2023 and 2024 is optimistic. As a market researcher, it’s essential to provide insights that shed light on the current market trends, technological advancements, and projected growth rates. Printed electronics are revolutionizing several industries, ranging from automotive to healthcare, due to their cost-effective production methods and flexible applications. These electronics typically include printed circuits, sensors, displays, and batteries, among others. By examining the numbers and understanding what drives this growth, we can better assess where the market is headed.
- In 2023, the printed electronics market was valued at approximately US $9.7 billion, and this figure is projected to grow significantly by 2024, reaching around US $11.5 billion. This growth corresponds to a compound annual growth rate (CAGR) of around 8%. The expansion is primarily driven by increasing demand for lightweight, flexible, and energy-efficient electronics in multiple industries, particularly in the fields of consumer electronics, healthcare, and automotive manufacturing. These industries seek solutions that provide high functionality without adding excess weight or complexity to their products.
- Printed electronics are gaining traction due to their versatility and relatively low production costs. Traditional electronics manufacturing methods can be expensive and time-consuming, whereas printed electronics offer a more streamlined and efficient process. This shift is essential for many industries, as it allows for faster product development cycles and reduces the overall cost of production. Furthermore, as sustainability becomes a more critical consideration, printed electronics offer an environmentally friendly alternative, as they typically require fewer raw materials and produce less waste compared to conventional manufacturing techniques.
- Looking at the Printed Electronics Statistics for 2023, it’s evident that the most significant demand comes from the automotive and healthcare sectors. In the automotive industry, printed electronics are increasingly being used for sensors, displays, and smart surfaces that enhance the functionality of vehicles while reducing their weight. By 2024, the automotive sector is expected to account for 25% of the total market. This growth is fueled by the increasing demand for electric vehicles and smart technologies, which rely heavily on lightweight and efficient electronic components.
- In the healthcare industry, the adoption of printed electronics is also growing at an impressive rate. In 2023, healthcare applications accounted for 20% of the total market, and this share is expected to rise by 5% in 2024. The use of printed electronics in medical devices, such as wearables and diagnostics, has been a key driver. These technologies provide accurate and real-time data for patients and healthcare professionals, making them indispensable tools in modern healthcare. The increasing demand for home-based healthcare solutions, particularly following the COVID-19 pandemic, has also contributed to this surge.
- Another area worth noting in the Printed Electronics Statistics is the consumer electronics sector, which made up 30% of the market in 2023. The growth of wearable technology, such as smartwatches and fitness trackers, is driving demand in this space. These devices rely on flexible and lightweight electronic components, making printed electronics an ideal solution. The increasing integration of Internet of Things (IoT) devices, which require compact and efficient sensors and circuits, is further propelling growth in this sector. By 2024, the consumer electronics market share is projected to increase to 35%, reflecting a continued emphasis on miniaturization and smart connectivity in everyday devices.
- Moreover, advancements in materials science are enabling new applications for printed electronics, which are expected to drive further market growth. For instance, new conductive inks and substrates are being developed that can be printed on flexible and even stretchable surfaces. This innovation allows for the creation of products like bendable displays and electronic textiles, which were once only conceptual. By 2024, these emerging technologies are expected to account for 10% of the total printed electronics market.
Conclusion
The printed electronics market has witnessed rapid growth in recent years, driven by growth, transformation, and technological advancements. The printed electronics statistics show that the market is currently valued at $9.7 billion, with indications that it will reach $11.5 billion by the end of 2024.
This expansion is fueled by the need for lightweight, flexible, and energy-efficient electronic solutions in sectors such as automotive, healthcare, and consumer electronics. As the industry continues to evolve, we can expect to see further innovations and applications across various sectors.
Sources
FAQ.
The printed electronics statistics reveal that the consumer electronics market accounts for 30% of the market share.
Cost-effectiveness, streamlined production, and improved sustainability are some of the major advantages involving printed electronics.
$9.69 billion was the global revenue of printers and copiers in 2023.

Maitrayee Dey has a background in Electrical Engineering and has worked in various technical roles before transitioning to writing. Specializing in technology and Artificial Intelligence, she has served as an Academic Research Analyst and Freelance Writer, particularly focusing on education and healthcare in Australia. Maitrayee's lifelong passions for writing and painting led her to pursue a full-time writing career. She is also the creator of a cooking YouTube channel, where she shares her culinary adventures. At Smartphone Thoughts, Maitrayee brings her expertise in technology to provide in-depth smartphone reviews and app-related statistics, making complex topics easy to understand for all readers.


