Social Proof Statistics By Influencers, Platforms Usage and Facts
Updated · Dec 08, 2025

Table of Contents
- Introduction
- Editor’s Choice
- Channel Preference For Shopping
- Search Result Page Review Trends
- Reasons for Shoppers to Click Product Page
- Customer Preference for Shopping
- Shoppers’ Loyalty Towards a Brand
- Top Business Review Websites
- Likeliness to Buy Without Customer Review
- Top Customer Review Websites
- Influencer Marketing Growth
- Influencer Payment Modes
- Influencer Payment Rate
- Measure to Asses Influencer Marketing Success
- Influencer Platforms Usage
- Popular Medium for Influencer Marketing
- Brand Collaboration Frequency With Influencers
- Consumer Trust in Review Responses
- Frequency of Responding to Customer Review
- Conclusion
Introduction
Social Proof Statistics: Social proof has become a cornerstone of modern consumer behavior and marketing strategies. In today’s digital age, where consumers are bombarded with choices, social proof is a crucial tool that helps people navigate purchasing decisions. By going through Social Proof Statistics, we can learn how social proof manifests across various channels, from traditional retail to digital platforms and influencer marketing.
From the continued importance of physical retail stores to the explosive growth of influencer marketing, it is essential to garner valuable insights into how consumers make decisions and how businesses can effectively leverage social proof to build trust and drive growth.
Editor’s Choice
- Influencer marketing has grown from 1.7 billion USD in 2016 to 24 billion USD in 2024.
- 88% of customers are likelier to use a business that responds to negative reviews.
- TikTok leads influencer marketing with 68.8% preference among brands.
- Physical retail stores remain the preferred shopping channel for 57% of consumers.
- 45% of users read up to three-page product reviews before making a purchase decision.
- High-quality product images, pricing, and discounts influence 76% of shoppers.
- Product quality is the top factor for brand loyalty, according to 73% of respondents.
- Google My Business dominates business reviews with 73% preference.
- 35% of consumers are less likely to buy products without customer reviews.
- Only 11% of companies respond to customer reviews on the same day.
- Views and reach are the primary success metrics for 54.3% of influencer marketing campaigns.
- 6% of companies work with 0-10 influencers for brand promotion.
- Monetary compensation is the preferred payment mode for 40.8% of influencers.
- 49% of shoppers prefer online and physical store shopping experiences.
- Google leads customer review platforms with 81% consumer preference.
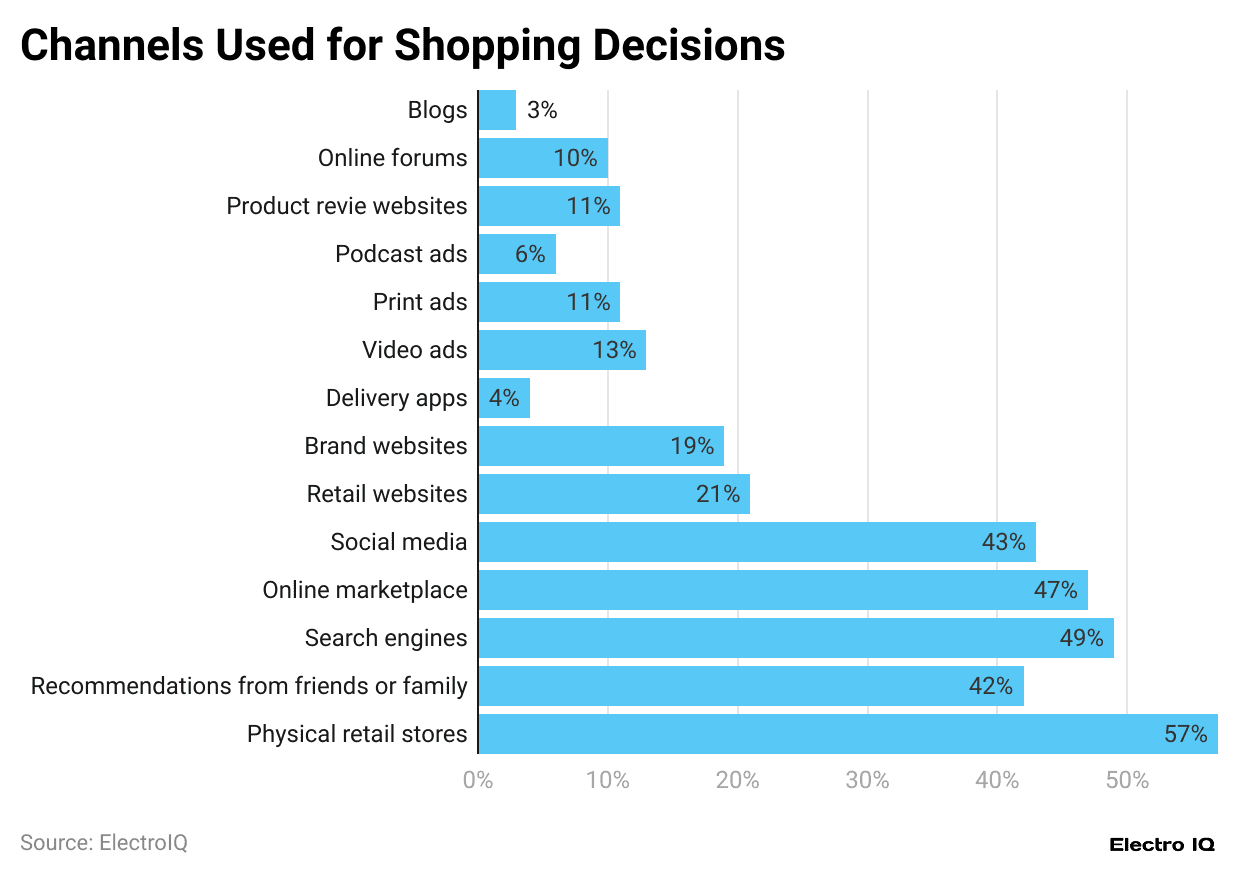
Channel Preference For Shopping
(Reference: salsify.com)
- Social Proof Statistics show that physical retail stores are the preferred shopping channel for 57% of respondents.
- Search engines are used by 49% of respondents for shopping decisions.
- Online marketplaces are used by 47% of respondents for shopping decisions.
- Social media platforms are used by 43% of respondents to make shopping decisions.
- Recommendations from friends or family influence 42% of respondents.
- Retail websites are used by 21% of respondents for shopping decisions
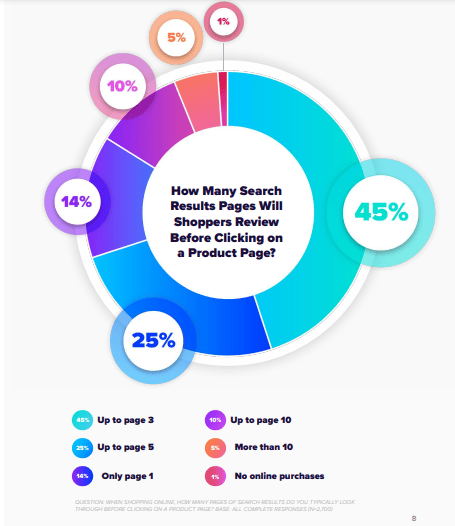
Search Result Page Review Trends
(Source: salsify.com)
- Social Proof Statistics show that 45% of users visit up to three pages of product reviews before clicking on the product page itself.
- 25% of users visit up to 5 pages of product reviews before clicking on the product page.
- 14% of users visit only the first page of product reviews before clicking on the product page.
- 10% of users visit up to 10 pages of product reviews before clicking on the product page.
- 5% of users visit more than ten pages of product reviews before clicking on the product page.
- 1% of users do not make any online purchases.
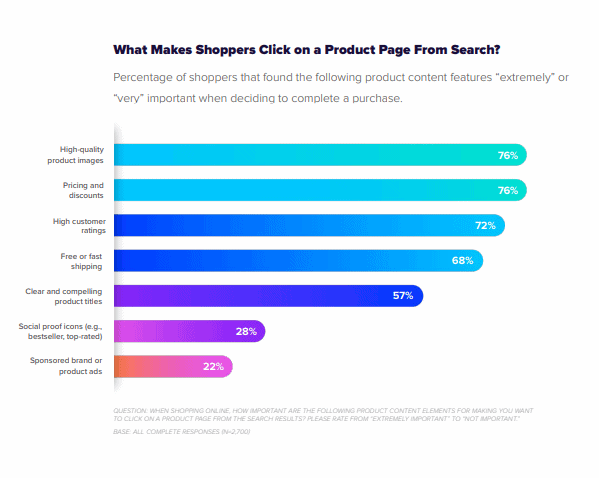
Reasons for Shoppers to Click Product Page
(Source: salsify.com)
- Social Proof Statistics show that 76% of respondents cite high-quality product images, pricing, and discounts as the top incentives for shoppers to click on a product page after a search.
- 72% of respondents consider high customer ratings an important factor for shoppers to click on a product page after a search.
- 68% of respondents value free or fast shipping as a reason for shoppers to click on a product page after a search.
- 57% of respondents prioritize clear and compelling product titles for shoppers to click on a product page after a search.
- 28% of respondents are influenced by social proof icons (e.g., bestseller and top-rated) that encourage shoppers to click on a product page after a search.
- 22% of respondents are motivated by sponsored brand or product ads for shoppers to click on a product page after a search.
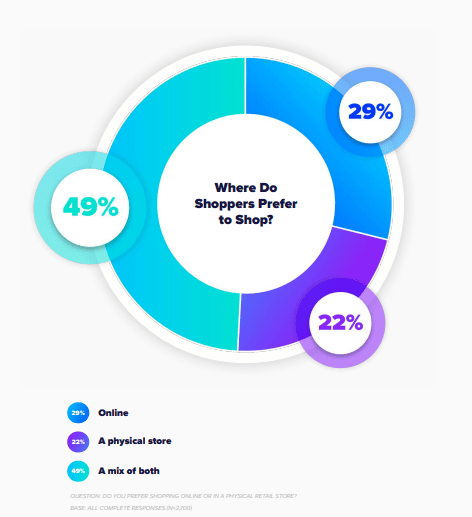
Customer Preference for Shopping
(Source: salsify.com)
- Social Proof Statistics show that 49% of shoppers prefer online and physical stores.
- For 29% of shoppers, the preference for shopping is online.
- For 22% of shoppers, the preference for shopping is physical stores.
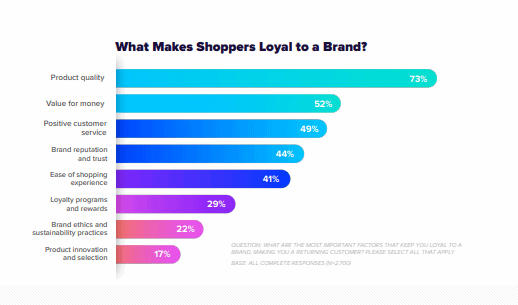
Shoppers’ Loyalty Towards a Brand
(Source: salsify.com)
- Social Proof Statistics show that product quality is the top feature that makes shoppers loyal to a brand, according to 73% of respondents.
- Value for money is the second most important feature that makes shoppers loyal to a brand, cited by 52% of respondents.
- As 49% of respondents noted, positive customer service is the third most important factor in a brand’s loyalty to shoppers.
- Brand reputation and trust are features that make shoppers loyal to a brand, according to 44% of respondents.
- Ease of shopping experience is a feature that influences 41% of respondents’ loyalty to a brand.
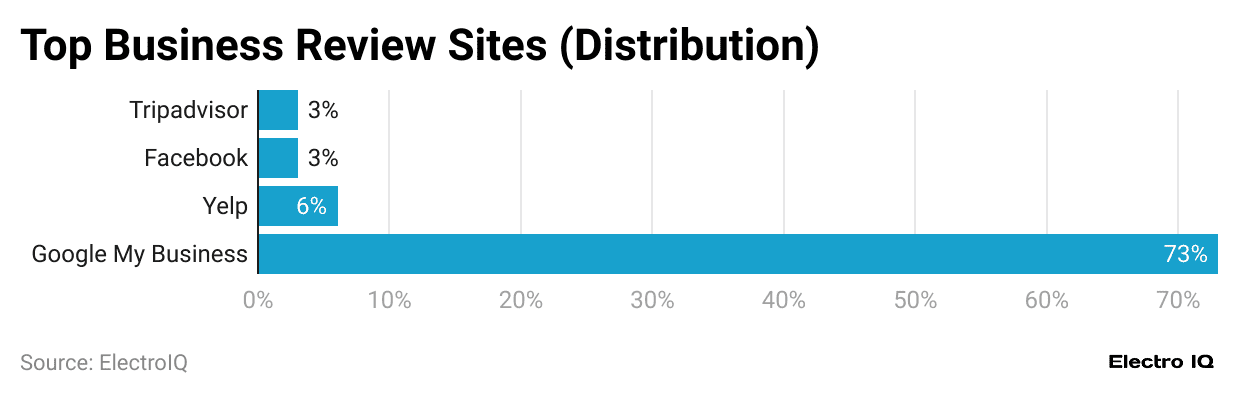
Top Business Review Websites
(Reference: reviewtrackers.com)
- Social Proof Statistics show that Google My Business is the preferred business review website for 73% of respondents.
- Yelp is the preferred business review website, as per 6% of respondents.
- Facebook and TripAdvisor are the preferred methods of business review, according to 3% of respondents.
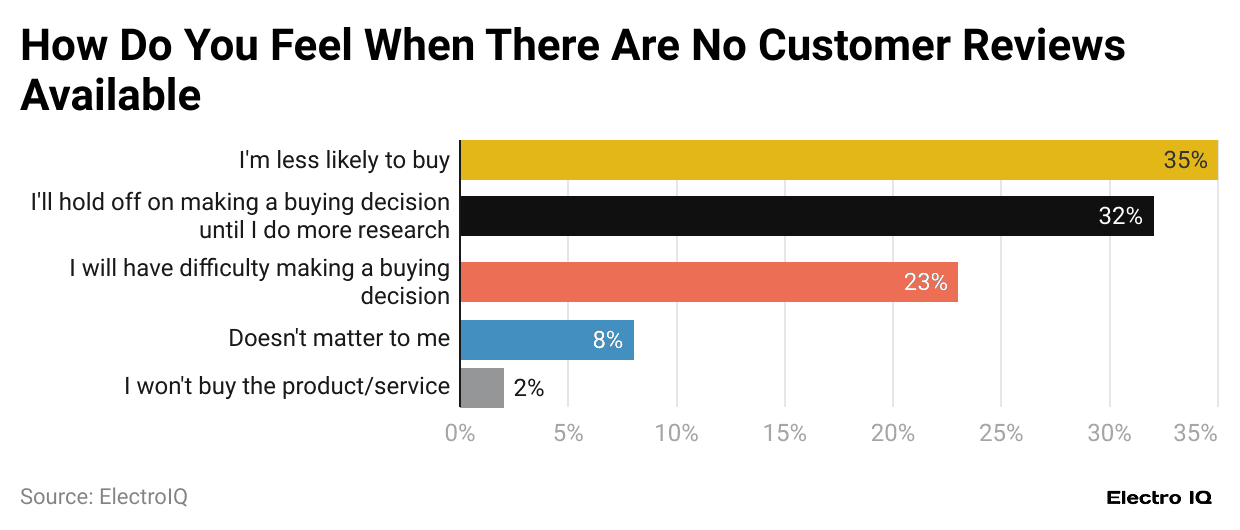
Likeliness to Buy Without Customer Review
(Reference: tintup.com)
- Social Proof Statistics show that 35% of respondents are less likely to buy products without customer reviews.
- 32% of respondents will hold off on buying until they do more research.
- 23% of respondents will have difficulty deciding without customer reviews.
- 8% of respondents stated that it doesn’t matter to them if there are no customer reviews.
- 2% of respondents said they wouldn’t buy the product or service without customer reviews.
Top Customer Review Websites
(Reference: brightlocal.com)
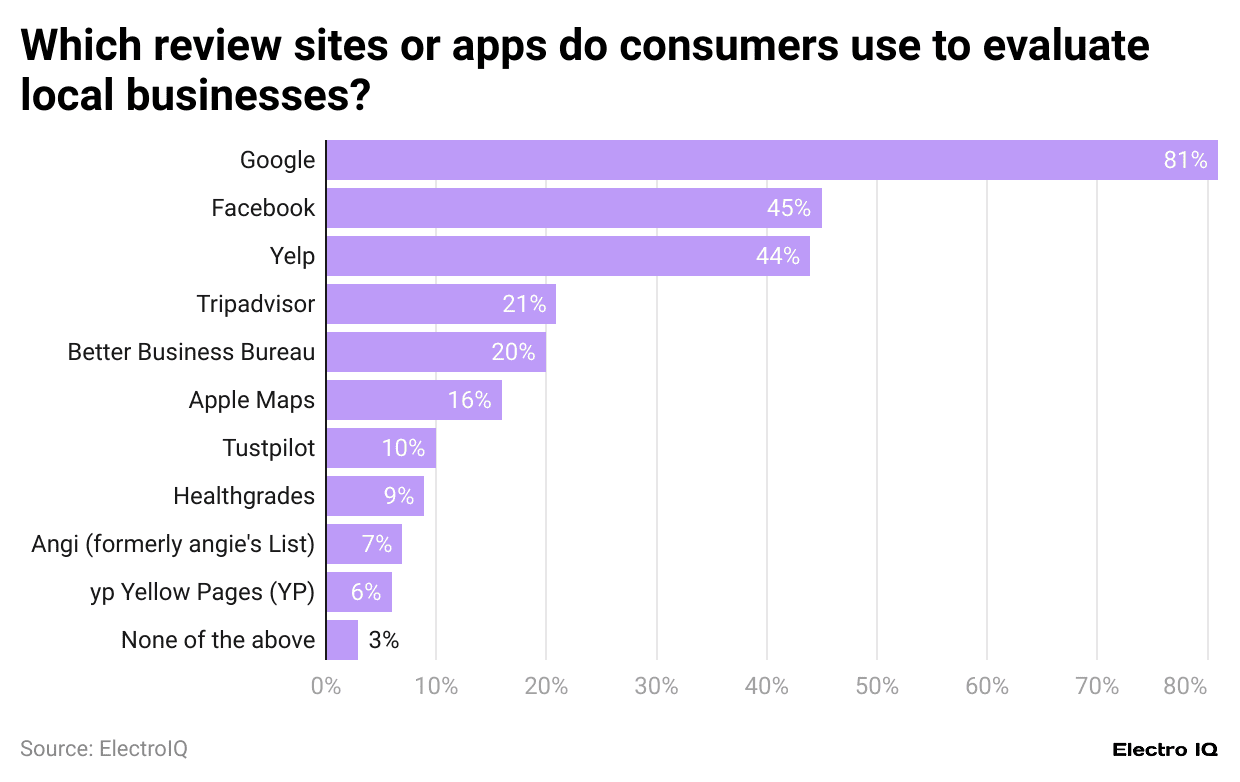
- Social Proof Statistics show that Google is the most preferred application for customers to view online reviews to evaluate local businesses, as per 81% of respondents.
- Facebook is the second most preferred application for customers to view online reviews, with 45% of respondents.
- Yelp is the third most preferred application for customers to view online reviews, with 44% of respondents.
- Tripadvisor is used by 21% of respondents to evaluate local businesses.
- Better Business Bureau is used by 20% of respondents to evaluate local businesses.
Influencer Marketing Growth
(Source: influencermarketinghub.com)
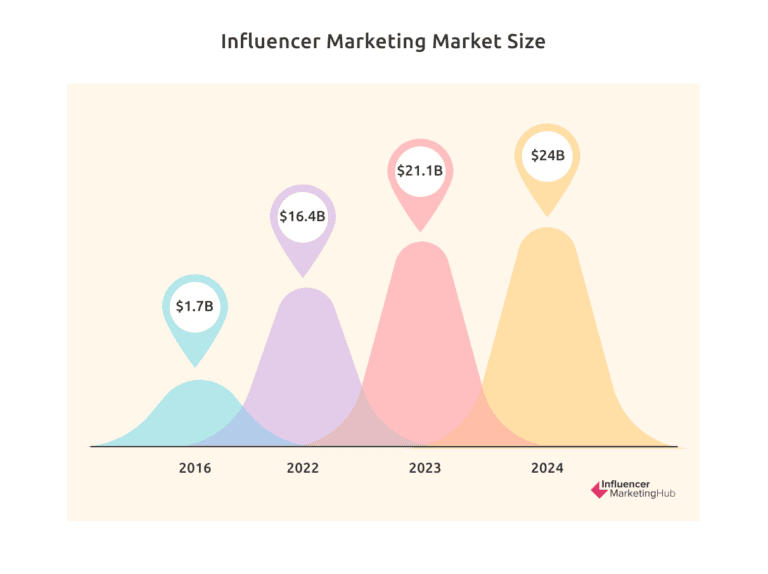
- Social Proof Statistics show that influencer marketing is growing significantly over time.
- In 2016, the market size of influencer marketing was USD 1.7 billion.
- As of 2024, the influencer marketing size is 24 billion USD.
Influencer Payment Modes
(Source: influencermarketinghub.com)
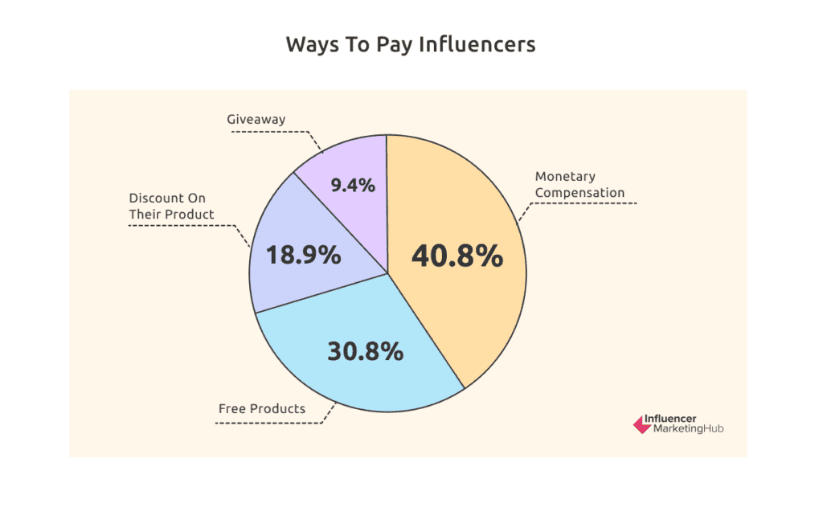
- Social Proof Statistics show that monetary compensation is the most popular way of paying influencers, as 40.8% of respondents reported.
- Free products are the second most popular way of paying influencers, with 30.8% of respondents.
- Discounts on their product are the third most popular way of paying influencers, with 18.9% of respondents.
- Giveaways are the least popular way of paying influencers, with 9.4% of respondents.
Influencer Payment Rate
(Reference: influencermarketinghub.com)
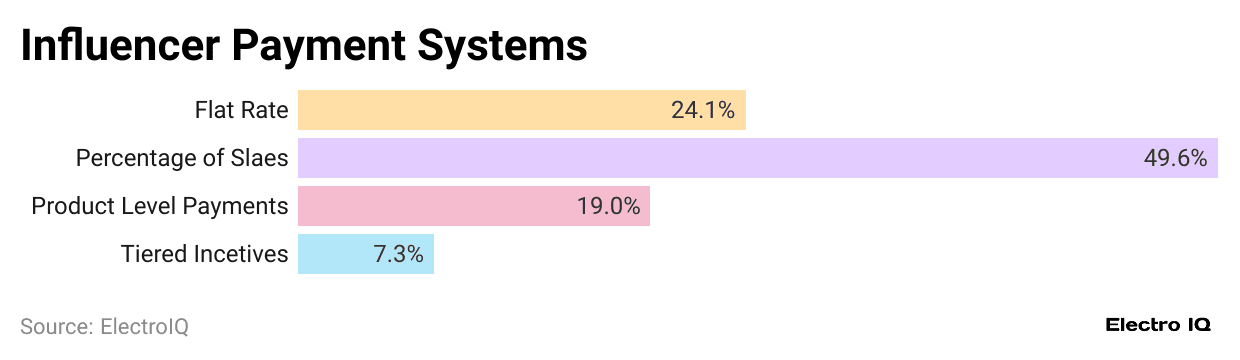
- Social Proof Statistics show that for 49.6% of respondents, the percentage of sales is the most prominent method to determine the endorsement rate of social influencers.
- Flat-rate payments are the second most prominent method to determine the endorsement rate of social influencers, chosen by 24.1% of respondents.
- Product-level payments ranked third among methods for determining the endorsement rate of social influencers, and 19% of respondents selected them.
- Tiered incentives are the least prominent method for determining the endorsement rate of social influencers, and 7.3% of respondents preferred them.
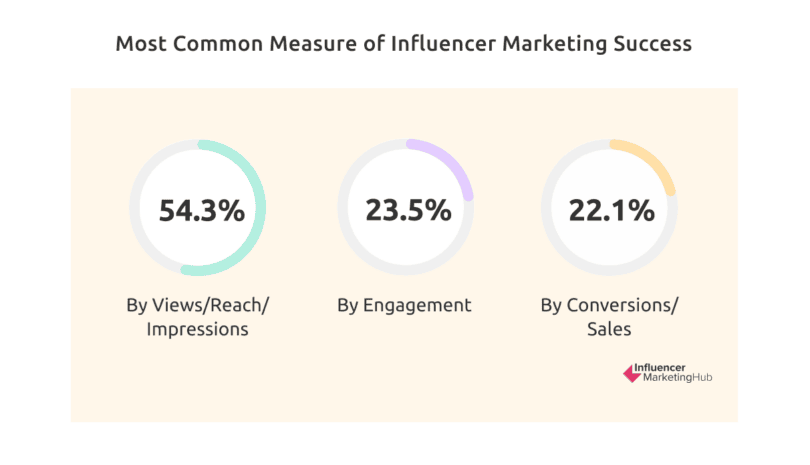
Measure to Asses Influencer Marketing Success
(Source: influencermarketinghub.com)
- Social Proof Statistics show that views/reach and impressions are the most popular method to asses influencer marketing success as per 54.3% of respondents.
- Engagement is the second most popular method to assess influencer marketing success, chosen by 23.5% of respondents.
- Conversions/sales are the third most popular method to assess influencer marketing success, selected by 22.1% of respondents.
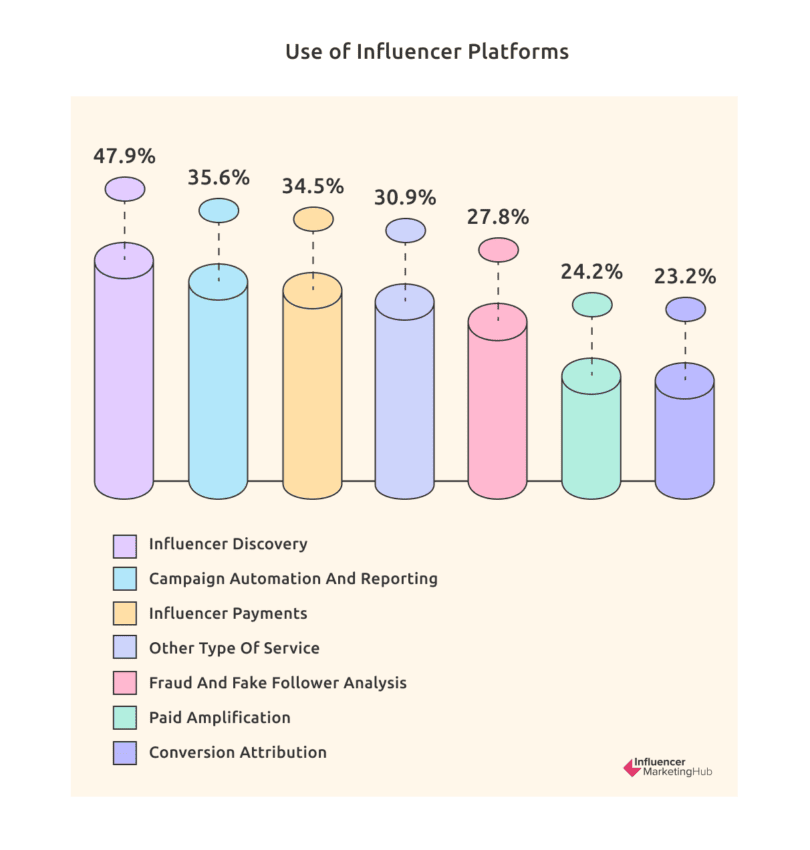
Influencer Platforms Usage
(Source: influencermarketinghub.com)
- Social Proof Statistics show that influencer discovery is the most popular method for influencer platforms, as per 47.9% of respondents.
- Campaign automation and reporting are the second most popular methods for influencer platforms, and they were chosen by 35.6% of respondents.
- Influencer payments are the third most popular method for influencer platforms, selected by 34.5% of respondents.
- Other types of services are the fourth most popular method for influencer platforms, chosen by 30.9% of respondents.
- Fraud and fake follower analysis is the fifth most popular method for influencer platforms, chosen by 27.8% of respondents
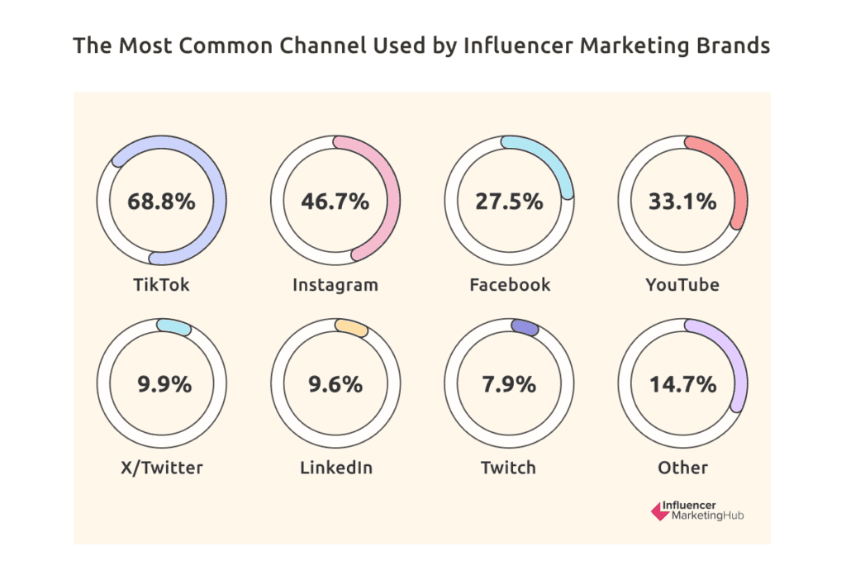
Popular Medium for Influencer Marketing
(Source: influencermarketinghub.com)
- Social Proof Statistics show that 68.8% of respondents consider TikTok the most popular channel for influencer marketing brands.
- Instagram is the second most popular channel for influencer marketing brands, chosen by 46.7% of respondents.
- YouTube is the third most popular channel for influencer marketing brands, and it was selected by 33.1% of respondents.
- Facebook is the fourth most popular channel for influencer marketing brands, and 27.5% of respondents use it.
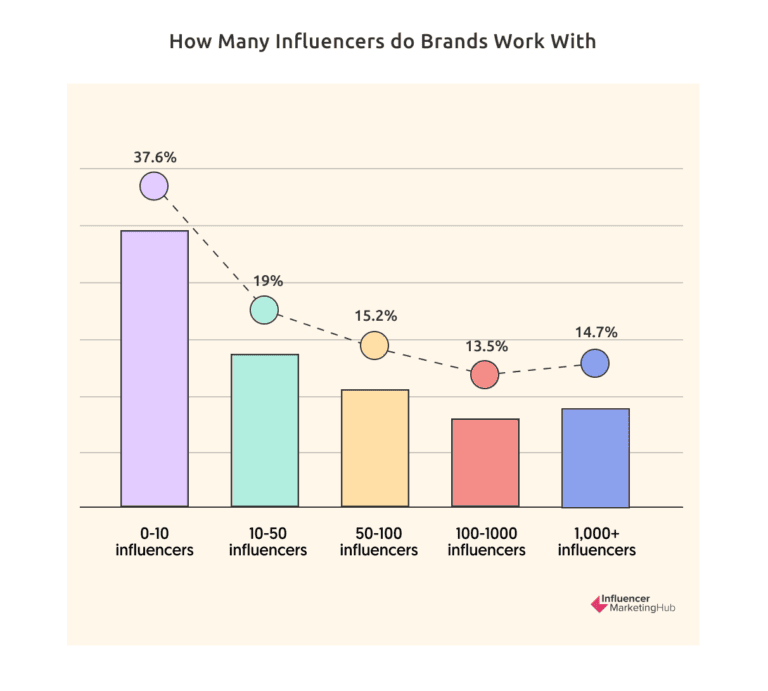
Brand Collaboration Frequency With Influencers
(Source: influencermarketinghub.com)
- Social Proof Statistics show that 37.6% of companies use 0-10 influencers to promote their brand.
- 19% of companies use 10-50 influencers to promote their brand.
- 2% of companies use 50-100 influencers to promote their brand.
- 7% of companies use 1,000+ influencers to promote their brand.
- 5% of companies use 100-1,000 influencers to promote their brand.
Consumer Trust in Review Responses
(Reference: brightlocal.com)
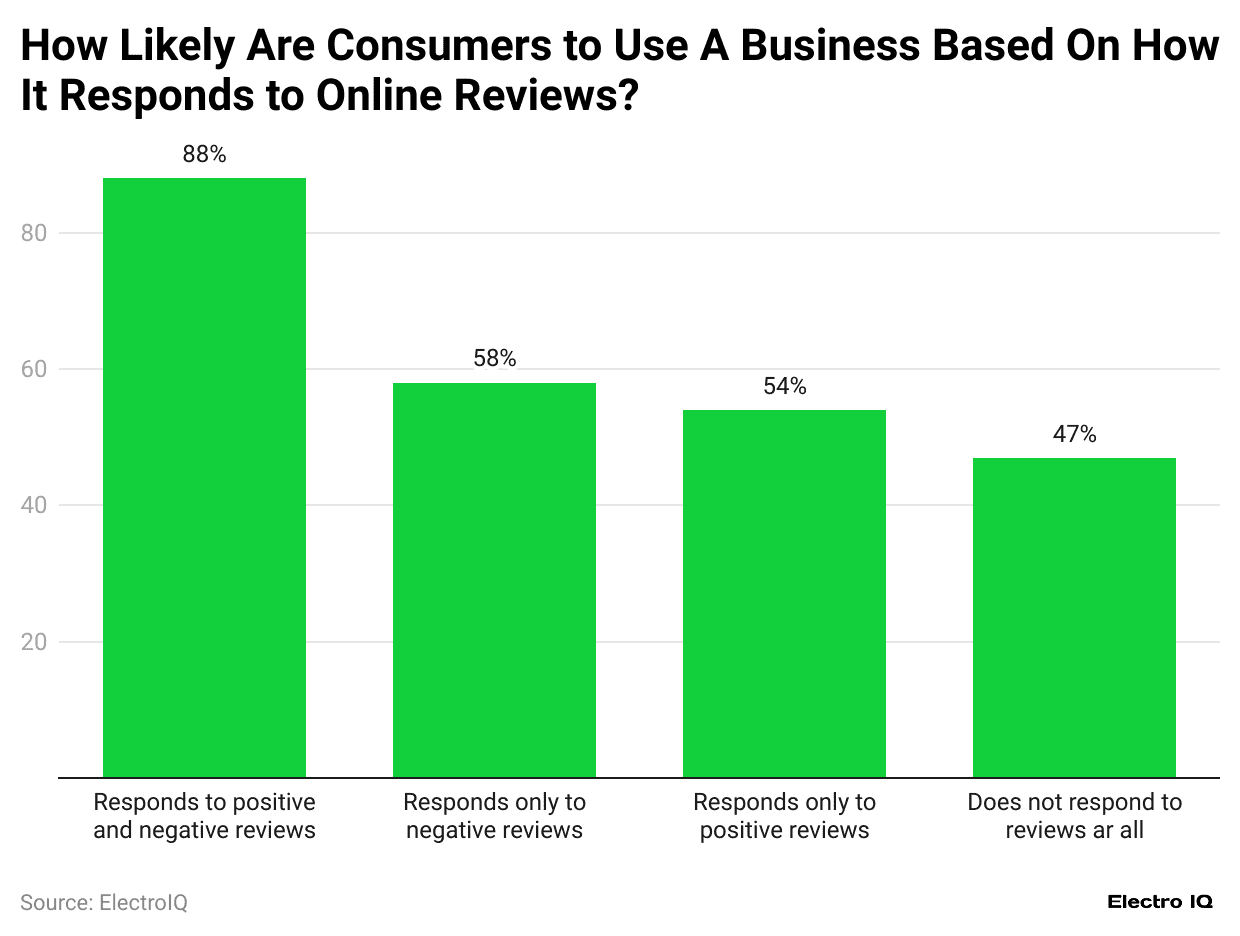
- Social Proof Statistics show that 88% of customers are most likely to use a business brand that responds to negative reviews.
- 58% of customers will likely use a business brand that responds only to negative reviews.
- 54% of customers will likely use a business brand that responds only to positive reviews.
- 47% of customers will likely use a business brand that does not respond to reviews.
Frequency of Responding to Customer Review
(Reference: brightlocal.com)
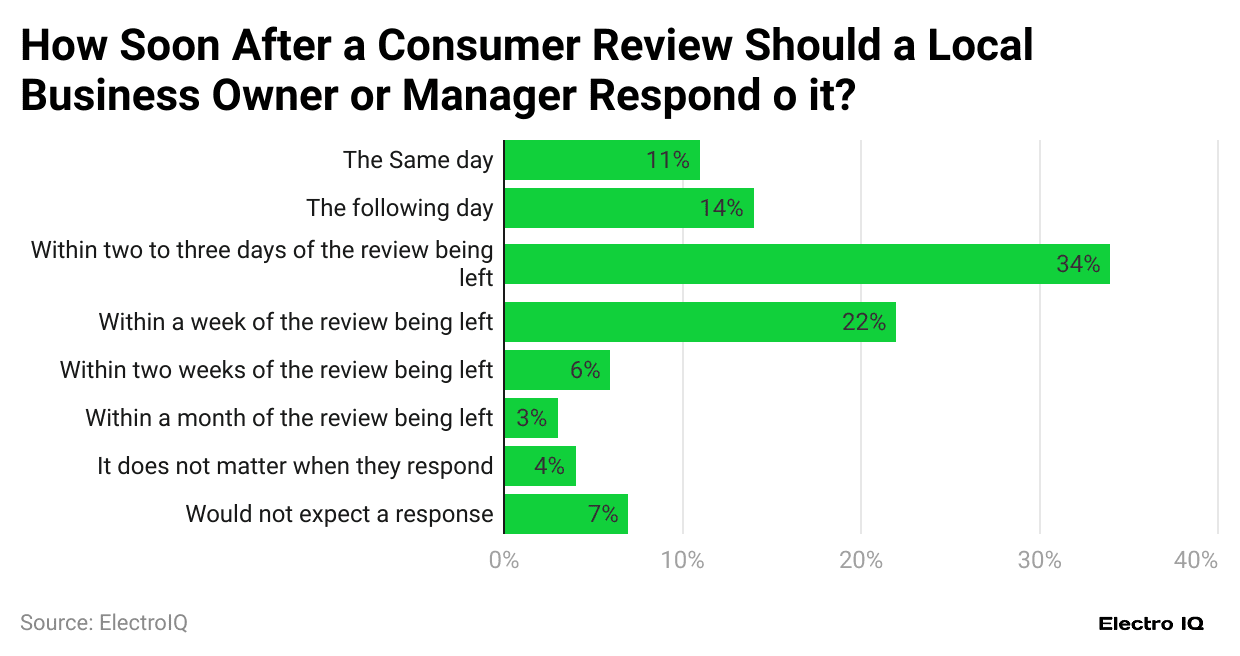
- Social Proof Statistics show that 34% of companies respond to customer reviews within 3 days of the review being posted.
- 22% of companies respond to customer reviews within a week of the review being posted.
- 14% of companies respond to customer reviews the following day after the review is posted.
- 11% of companies respond to customer reviews the same day the review is posted.
- 7% of respondents do not expect a response from companies.
- 6% of companies respond to customer reviews within two weeks of the review being posted.
Conclusion
Social Proof Statistics presents a comprehensive analysis revealing social proof’s crucial role in modern consumer behavior and business strategies. It demonstrates a clear shift towards an omnichannel approach, with 49% of consumers preferring online and physical shopping experiences.
The dominance of platforms like Google for business reviews and TikTok for influencer marketing shows the evolving nature of social proof channels. Companies are adapting to these trends, with varying degrees of success in responding to customer reviews and engaging with influencers.
Sources
FAQ.
As of 2024, the influencer marketing industry is valued at 24 billion USD, showing significant growth from 1.7 billion USD in 2016.
Google is the dominant platform, with 81% of consumers using it to evaluate local businesses through online reviews.
34% of companies respond within 3 days, while only 11% respond on the same day.
49% of shoppers prefer a combination of online and physical store shopping experiences.
Product quality is the primary factor, with 73% of respondents citing it as the main reason for brand loyalty.
TikTok leads, with 68.8% of brands preferring it for influencer marketing campaigns.
45% of users read up to three pages of product reviews before making a purchase decision.
Monetary compensation is the most common payment method used by 40.8% of brands.
Very important, as 35% of consumers are less likely to buy products without customer reviews.
93% of businesses respond to reviews, varying response times from same-day to within two weeks

Saisuman is a skilled content writer with a passion for mobile technology, law, and science. She creates featured articles for websites and newsletters and conducts thorough research for medical professionals and researchers. Fluent in five languages, Saisuman's love for reading and languages sparked her writing career. She holds a Master's degree in Business Administration with a focus on Human Resources and has experience working in a Human Resources firm. Saisuman has also worked with a French international company. In her spare time, she enjoys traveling and singing classical songs. Now at Smartphone Thoughts, Saisuman specializes in reviewing smartphones and analyzing app statistics, making complex information easy to understand for readers.