Supercomputer Statistics By Trends, Market Size, Region, End User, Components, Vendor, Usage And Facts (2025)
Updated · Oct 05, 2025

Table of Contents
- Introduction
- Editor’s Choice
- General Supercomputer Statistics
- Global Supercomputer Market Size Analysis
- Asia Pacific Supercomputer Market Size
- Supercomputers Market Trends
- Top 10 Supercomputers Analyses of 2025
- Supercomputers Market Share Statistics by Region
- By End User Industry
- By Usage Segment
- By Components
- By Processing Scale
- Leading 500 Supercomputers Vendor System Share Analyses
- Country Breakdown
- Conclusion
Introduction
Supercomputer Statistics: Supercomputers are the fastest and most technologically advanced computers that are specially built to solve several difficult problems that ordinary computers cannot handle. They are widely used in fields like climate prediction, medical research, nuclear science, artificial intelligence, and other large-scale simulations. By 2025, high-performance computing will have reached the exascale level, where systems can perform more than one quintillion calculations every second.
The TOP500 list now features three U.S. exascale supercomputers, while Europe and Asia also host some of the strongest systems. These machines are judged not only by speed but also by their energy use, processor design, and performance on tests such as HPL and HPCG. The growing role of cloud-based HPC and Europe’s EuroHPC program shows how nations are competing for leadership in computing. This article on supercomputer Statistics includes several statistical analyses that are taken from different insights and successfully reveal both scientific progress and global competition.
Editor’s Choice
- According to Market.us, the global market size of Supercomputers will account for USD 11.7 billion in 2025 and will reach around USD 26.5 billion by the end of 2033.
- Wikipedia shows that as of June 2025, the number one supercomputer is El Capitan, the leader on Green500 is JEDI, a Bull Sequana XH3000 system using the Nvidia Grace Hopper GH200 Superchip.
- The TOP500 list shows 175 supercomputers in the United States, 137 in the European Union, and 47 in China.
- The Asia Pacific supercomputer market size accounted for USD 4.96 billion in 2024 and is predicted to reach around USD 5.51 billion by 2025.
- In 2025, the Asia-Pacific region holds the largest share of the global supercomputers market at 46.82%.
- Meanwhile, commercial industries are expected to lead the global supercomputers market with a 40.03% share.
- As of 2024, the industry holds the largest share of supercomputers at 48.6%, followed by research with 36.5%.
- As of June 2024, Lenovo led the global Top 500 supercomputers with 32.6% share, while HPE followed in second place, holding 22.4% of the systems worldwide.
- Mordor Intelligence report states that in 2024, processors made up 39.12% of the supercomputer market.
- The global supercomputers market is being shaped by several strong drivers, like public funding for the race to Exascale, which adds about 2.8% to growth forecasts.
General Supercomputer Statistics
- In 2024, AI healthcare companies received over USD 2.8 billion in investment, showing rising supercomputer use in diagnostics and treatment, as mentioned in a report published by market.us.
- In healthcare, AI use includes administrative tools that take 27% of investments, showing dependence on supercomputing.
- In the United States, the Department of Energy put USD 63.5 million into supercomputing to support energy research in 2023.
- The European Union’s EuroHPC program is boosting AI progress with supercomputers, increasing global demand for advanced technology.
- India’s AI mission received ₹10,300 crore (USD 1.24 billion) to create 10,000-GPU supercomputers for healthcare, education, and research.
- Denmark has built a powerful AI supercomputer, resulting in DKK 600 million (USD 86 million) with the help of the government and the Novo Nordisk Foundation.
Global Supercomputer Market Size Analysis
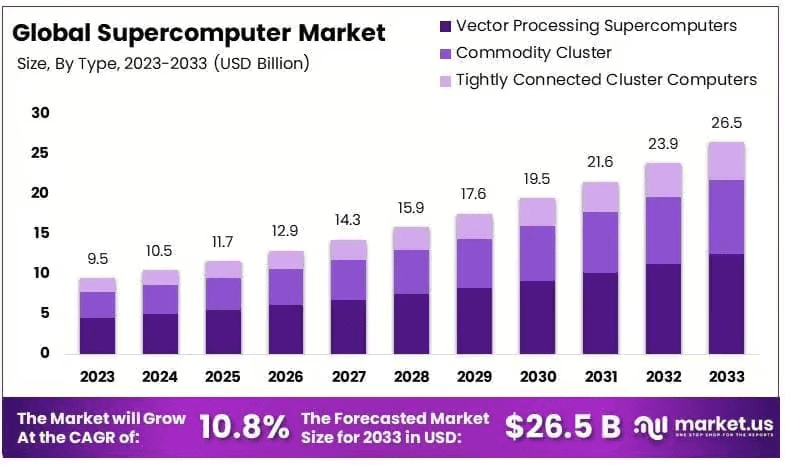
- According to market.us, the global market size of Supercomputers will account for USD 11.7 billion in 2025 and will reach around USD 26.5 billion by the end of 2033.
- The market size will grow at a CAGR of 10.8% from 2025 to 2033.
- Furthermore, in the coming years, the market size is estimated to reach USD 12.9 billion by 2026, USD 14.3 billion by 2027, USD 15.9 billion by 2028, USD 17.6 billion by 2029, USD 19.5 billion by 2030, USD 21.6 billion by 2031, and USD 23.9 billion by 2032.
- Mordor Intelligence report states that in 2024, processors made up 39.12% of the supercomputer market.
- Accelerators, supported by AI tasks, are set to rise at a 15.28% CAGR, while cloud-based HPC-as-a-Service shows the highest growth of 20.39% by 2030.
- Exascale systems led in 2024 and are expected to expand fastest at 27.12% CAGR.
- Among end users, healthcare and life sciences grow quickest at 15.79% CAGR, and geographically, Asia-Pacific holds the strongest momentum with a projected 12.82% CAGR through 2030.
Asia Pacific Supercomputer Market Size
 (Reference: precedenceresearch.com)
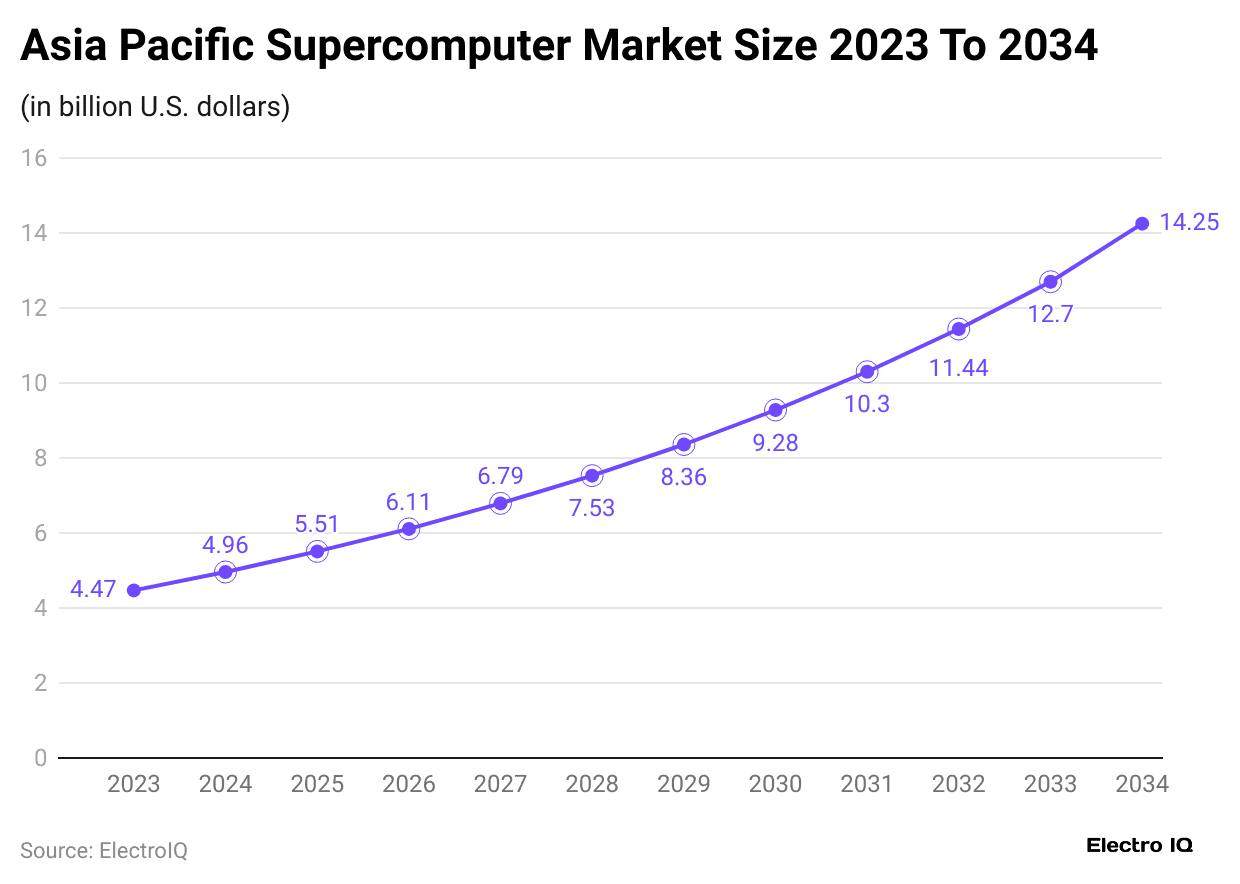
- The Asia Pacific supercomputer market size accounted for USD 4.96 billion in 2024 and is predicted to reach around USD 5.51 billion by 2025.
- Furthermore, estimated market size in the coming years are followed by USD 6.11 billion (2026), USD 6.79 billion (2027), USD 7.53 billion (2028), USD 8.36 billion (2029), USD 9.28 billion (2030), USD 10.30 billion (2031), USD 11.44 billion (2032), USD 12.70 billion (2033), and USD 14.25 billion (2034).
Supercomputers Market Trends
- The global supercomputers market is being shaped by several strong drivers, like public funding for the race to Exascale, which adds about 2.8% to growth forecasts.
- Meanwhile, increasing use of AI and ML workloads on HPC contributes the most at 3.2%.
- Post-COVID needs for climate and biomedical simulations further boost growth by 1.9%.
- Cloud-based HPC-as-a-Service availability adds 2.1%, and the growing maturity of open-source software stacks contributes 1.4%.
- Additionally, national digital-sovereignty programs raise the outlook by 1.8%.
Top 10 Supercomputers Analyses of 2025
#1. El Capitan at Lawrence Livermore National Laboratory ranked the world’s top supercomputer, excelling in power and efficiency.
- Performance (HPL): 1.742 Exaflop/s
- Cores: 11,039,616
- Processors: AMD 4th Gen EPYC (24 cores @ 1.8 GHz)
- Accelerators: AMD Instinct MI300A
- Interconnect: HPE Slingshot
- Energy Efficiency: 58.9 Gigaflops/watt
- HPCG Score: 17.41 Petaflop/s (current leader)
#2. Frontier at Oak Ridge National Laboratory in Tennessee became the first U.S. supercomputer to surpass one exaflop, supporting vital DOE simulations.
- Performance (HPL): 1.353 Exaflop/s
- Cores: 8,699,904
- Processors: AMD 3rd Gen EPYC™, optimized for HPC & AI
- Accelerators: AMD Instinct 250X
- Interconnect: HPE Slingshot
#3. Aurora, housed at Argonne Leadership Computing Facility in Illinois, is Intel’s first exascale system, boosting U.S. AI and physics research.
- Performance (HPL): 1.012 Exaflop/s
- Architecture: HPE Cray EX with Intel Exascale Compute Blades
- Processors: Intel Xeon CPU Max Series
- Accelerators: Intel Data Centre GPU Max Series
- Interconnect: HPE Slingshot
#4. JUPITER Booster at Jülich Supercomputing Centre, Europe’s first exascale-class system, is being commissioned to exceed one exaflop.
- Performance: Approx 793 PFLOPS
- Architecture: Modular GPU-accelerated partition using BullSequana XH3000 liquid-cooled blades.
- Processors: GH200 “Grace-Hopper” superchips coupling ARM CPU + GPU
- Interconnect: Quantum-2 InfiniBand (NDR / Dragonfly+) and NVLink mesh per node.
#5. Eagle, Microsoft’s Azure-based supercomputer, marks the largest cloud HPC, showcasing hyperscale cloud providers’ growing role in performance.
- Performance (HPL): 561 Petaflop/s
- Processors: Intel Xeon Platinum 8480C
- Accelerators: NVIDIA H100
#6. HPC6, operated by Eni S.p.A. in Ferrera Erbognone, Italy, supports energy modelling and complex advanced industrial simulation projects.
- Performance (HPL): 477.9 Petaflop/s
- Architecture: HPE Cray EX235a
- Processors: AMD 3rd Gen EPYC™
- Accelerators: AMD Instinct™ 250X
- Interconnect: HPE Slingshot
#7. Fugaku, built on Fujitsu’s Arm architecture at RIKEN in Kobe, was the world’s fastest supercomputer until 2022, excelling in research.
- Performance (HPL): 442 Petaflop/s
- Cores: 7,630,848
- HPCG Score: 16 Petaflop/s (second place worldwide)
#8. Alps, hosted at Switzerland’s CSCS, is Europe’s most advanced AI-HPC hybrid, enabling balanced scientific research and large-scale machine learning.
- Performance (HPL): 434.9 Petaflop/s
- Architecture: HPE Cray EX254n
- Processors: NVIDIA Grace 72C
- Accelerators: NVIDIA GH200 Superchip
- Interconnect: HPE Slingshot
#9. LUMI, based in Finland’s CSC Kajaani datacenter, is a EuroHPC pre-exascale supercomputer powering climate modelling, AI, and big data.
- Performance (HPL): 380 Petaflop/s
- Architecture: HPE Cray EX
#10. Leonardo, located at CINECA in Bologna, Italy, is among Europe’s largest EuroHPC hybrid GPU/CPU systems supporting researchers.
- Performance (HPL): 241.2 Petaflop/s
- Architecture: Atos BullSequana XH2000
- Processors: Intel Xeon Platinum 8358 (32 cores @2.6 GHz)
- Accelerators: NVIDIA A100 SXM4 (40 GB)
- Interconnect: Quad-rail NVIDIA HDR100 Infiniband
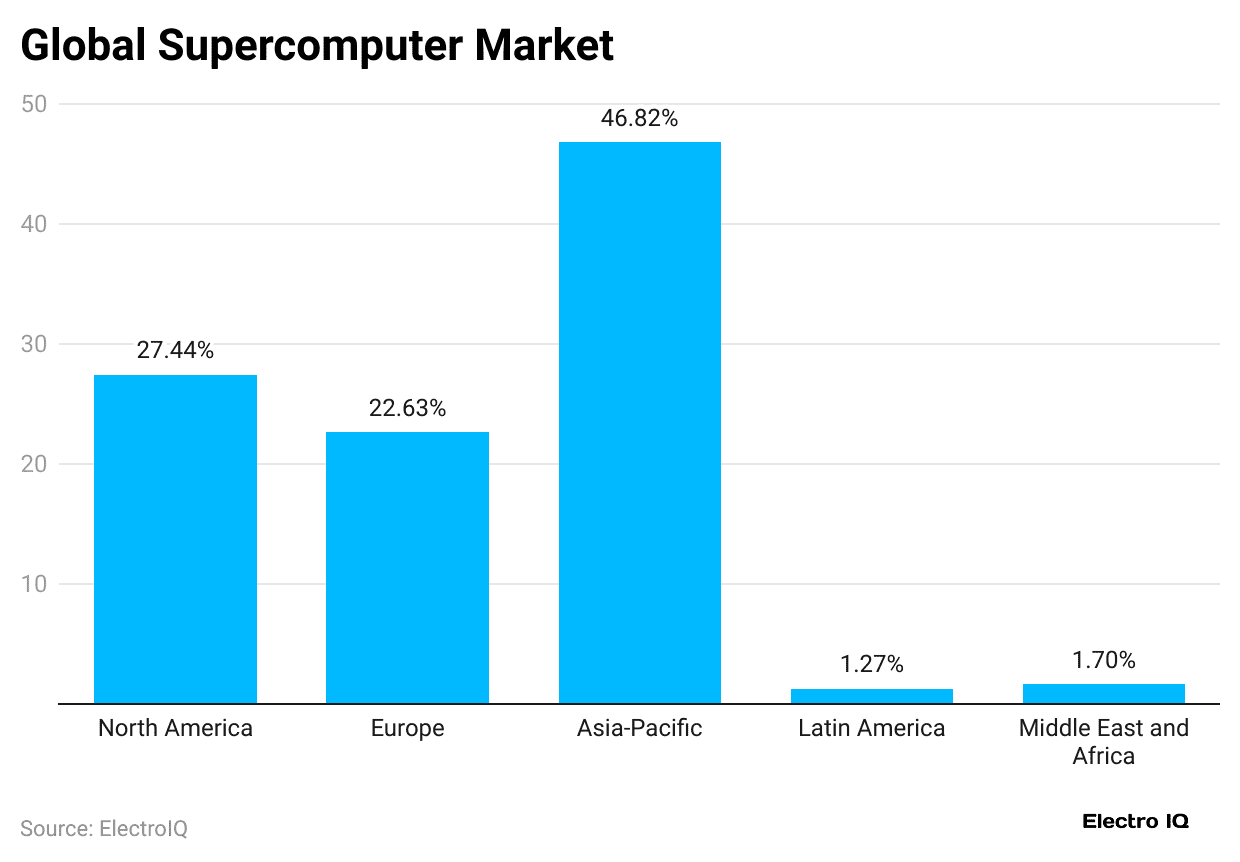
- In 2025, the Asia-Pacific region holds the largest share of the global supercomputers market at 46.82%.
- Meanwhile, North America follows with 27.44%, while Europe accounts for 22.63%.
- The Middle East & Africa contributes a smaller portion at 1.70%, and Latin America has the lowest share at 1.27%.
By End User Industry
 (Reference: coherentmarketinsights.com)
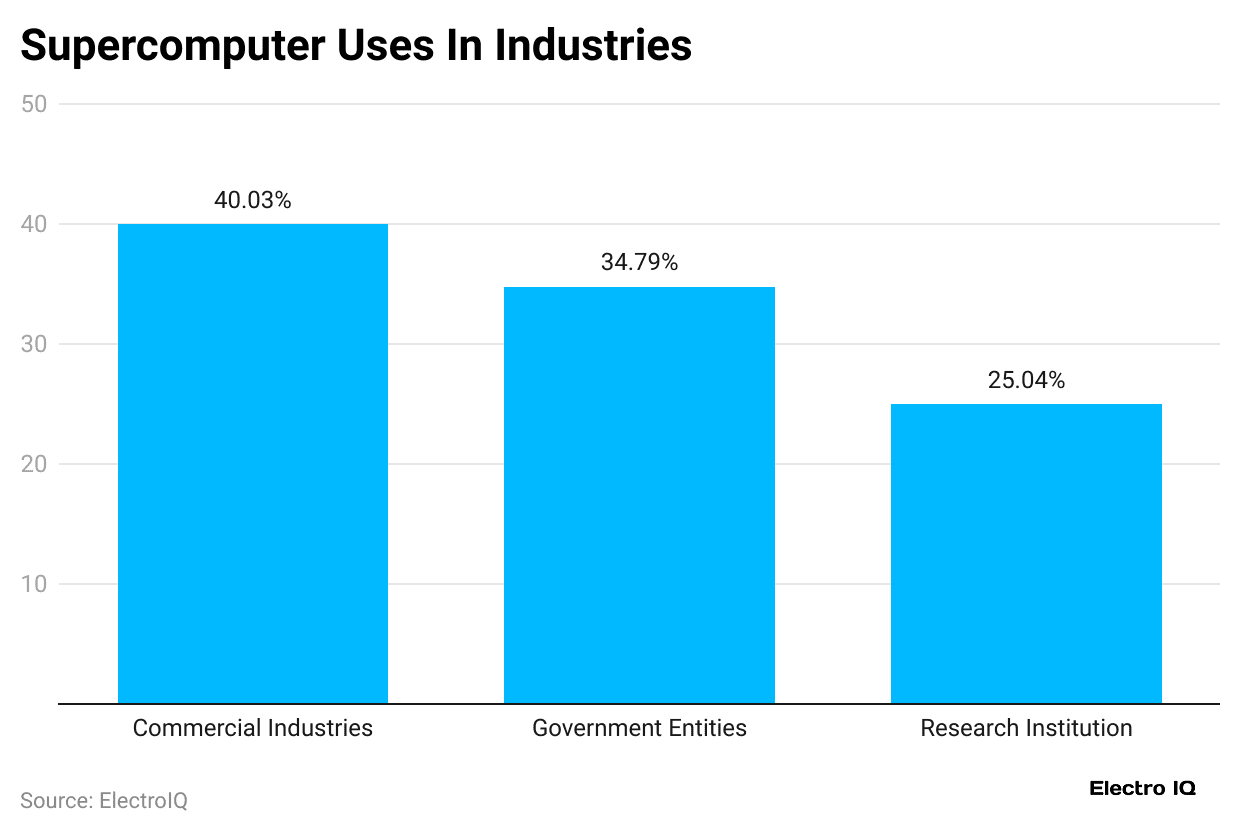
- In 2025, commercial industries are expected to lead the global supercomputers market with a 40.03% share.
- Moreover, the government entities and research institutes will capture a share of 34.79% and 25.04%, respectively.
By Usage Segment
 (Reference: rdworldonline.com)
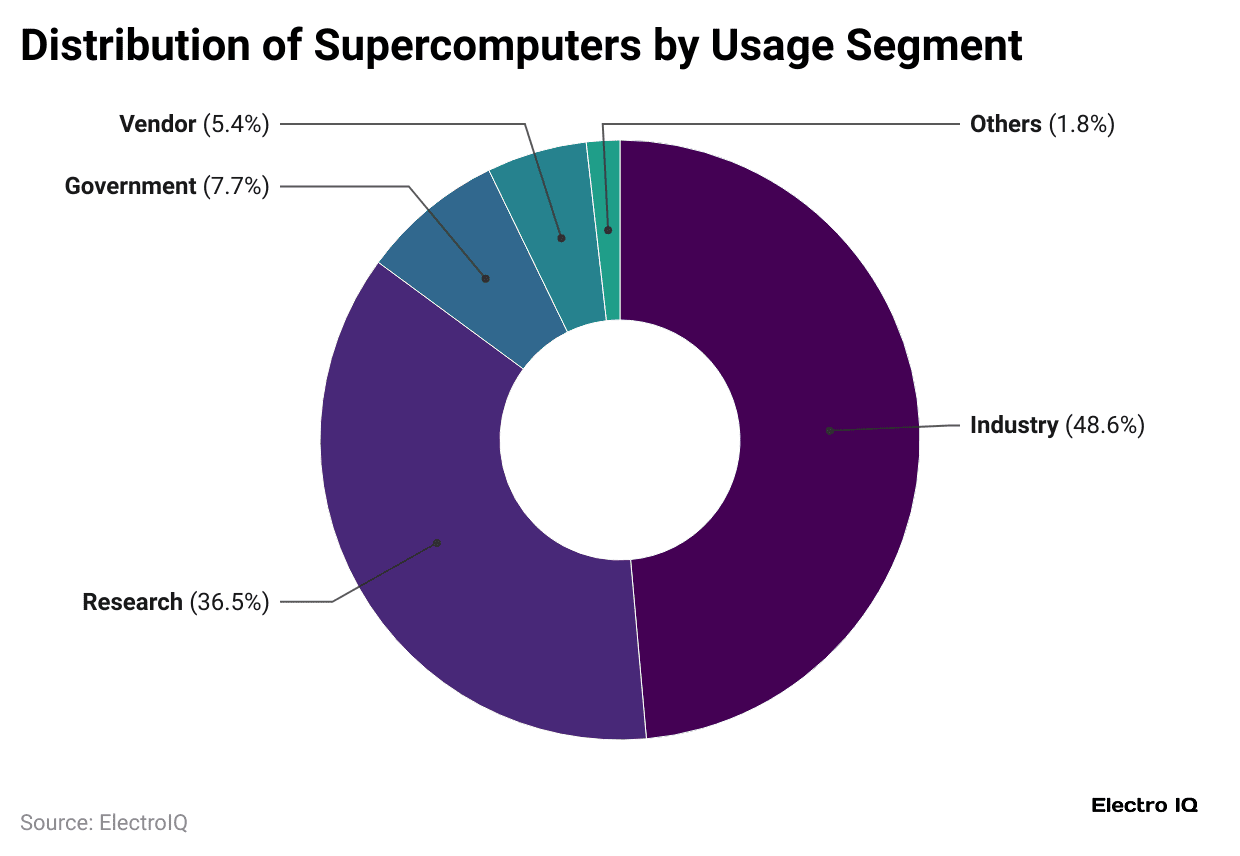
- As of 2024, the industry holds the largest share of supercomputers at 48.6%, followed by research with 36.5%.
- Government usage represents 7.7%, vendors account for 5.4% mainly for testing and development, and the remaining 1.8% falls under others
By Components
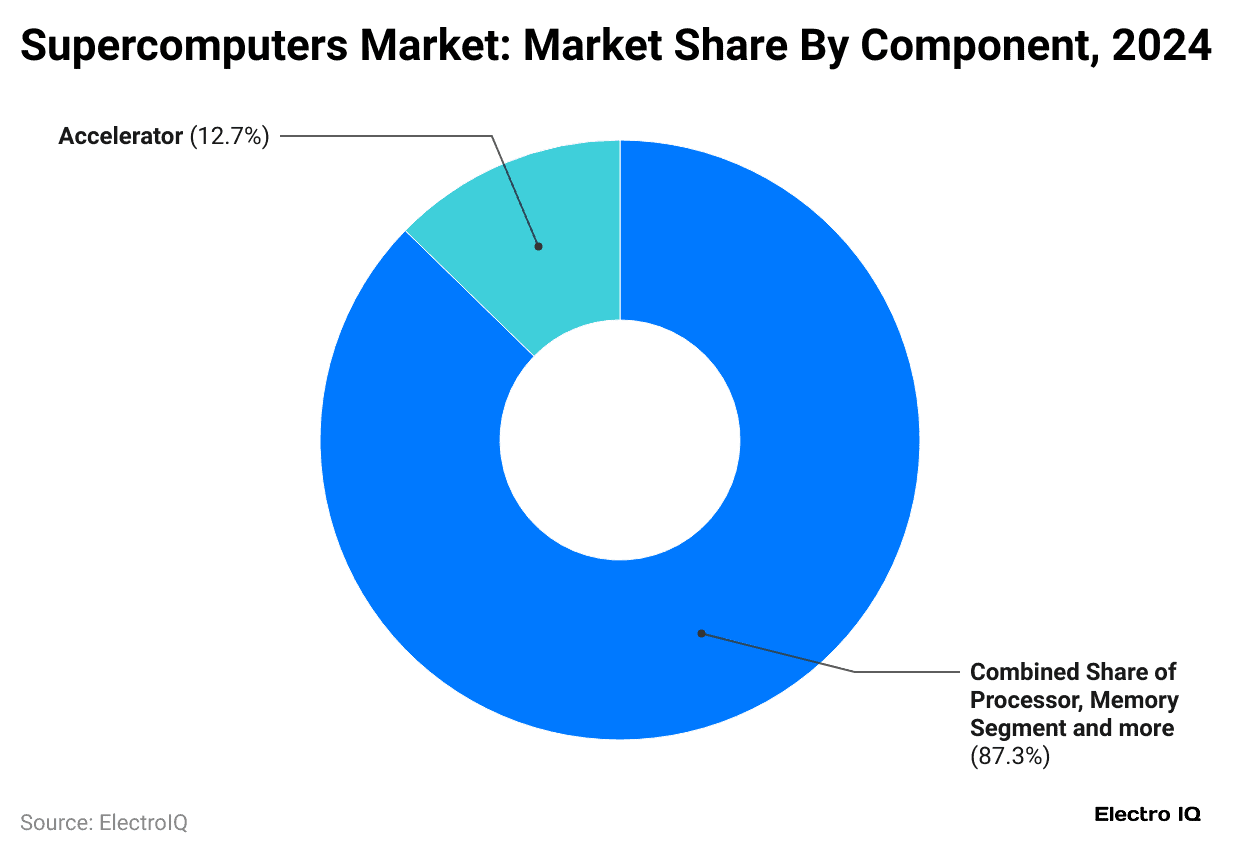
- In 2024, processors, memory, and related segments held 87.3% of the supercomputers market.
- Accelerators made up 12.7%, showing rising importance in AI-driven workloads.
By Processing Scale
 (Reference: mordorintelligence.com)
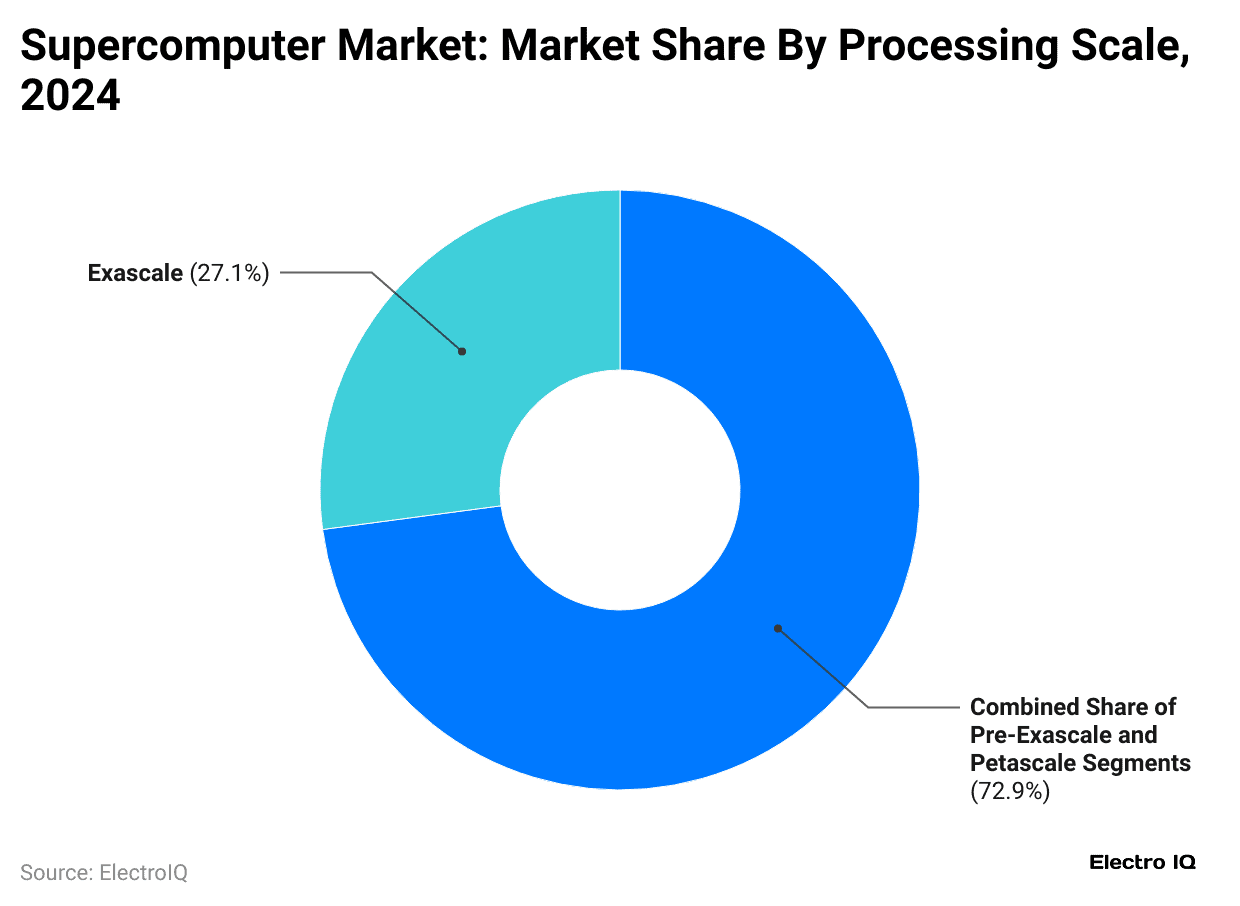
- In the same duration, pre-exascale and petascale systems dominated the supercomputers market, making up 72.9% of the total share.
- Exascale installations, although relatively smaller at 27.1%.
 (Reference: statista.com)
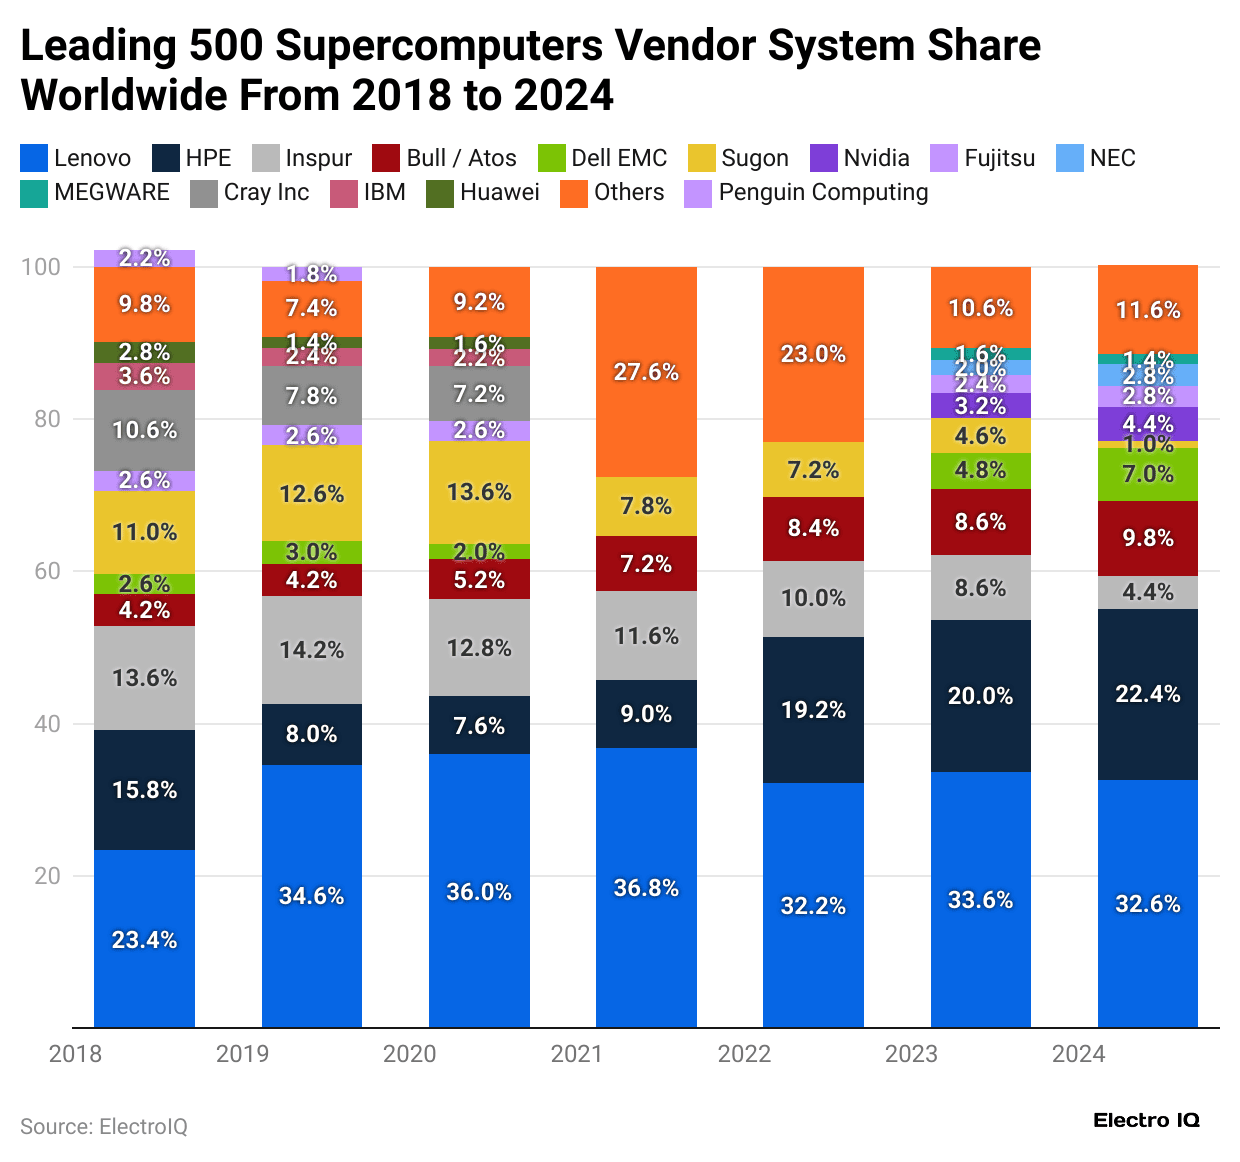
- As of June 2024, Lenovo led the global Top 500 supercomputers with 32.6% share, while HPE followed in second place, holding 22.4% of the systems worldwide.
- Furthermore, other leading vendors’ market shares are followed as Inspur (4.4%), Bull/Atos (9.8%), Dell EMC (7%), Sugon (1%), Nvidia (4.4%), Fujitsu (2.8%), NEC (2.8%), MEGWARE (1.4%), and the rest (11.6%)
Historic analysis of leading 500 supercomputers vendor system shares in the month of June are mentioned in the table below:
| Supercomputers Vendor | 2023 | 2022 | 2021 | 2020 | 2019 | 2018 |
| Lenovo | 33.6% | 32.2% | 36.8% | 36% | 34.6% |
23.45 |
|
HPE |
20% | 19.2% | 9% | 7.6% | 8% | 15.8% |
| Inspur | 8.6% | 10% | 11.6% | 12.8% | 14.2% |
13.8% |
|
Bull/Atos |
8.6% | 8.4% | 7.2% | 5.2% | 4.2% | 4.2% |
| Dell EMC | 4.8% | – | – | 2% | 3% |
2.6% |
|
Sugon |
4.6% | 7.2% | 7.8% | 13.6% | 12.6% | 11% |
| Nvidia | 3.2% | – | – | – | – |
– |
| 2.4% | 2.6% | 2.6% | 2.6% | |||
| NEC | 2% |
– |
– |
– |
||
|
MEGWARE |
1.6% | |||||
| Others | 10.6% | 23% | 27.6% | 9.2% | 7.4% |
9.8% |
Country Breakdown
- As of June 2025, the TOP500 list shows 175 supercomputers in the United States, 137 in the European Union, and 47 in China, as mentioned in Wikipedia.
- Followed by Germany with 41 systems, Japan 39, France 25, Italy 17, South Korea 15, Canada and the UK 13 each, Brazil, Norway, and Sweden 9 each, Taiwan 8, Poland and the Netherlands 7 each, Russia, Saudi Arabia, and India 6 each, Singapore 5, and Australia, UAE, and Switzerland 4 each.
- Czechia, Spain, and Finland each have three supercomputers, while several countries, including Thailand, Ireland, and others, host between 1 and 2 systems.
Conclusion
After completing the article on Supercomputer Statistics, it can be concluded that this industry has reached a new stage with the rise of exascale systems. The U.S. leads the way with El Capitan, Frontier, and Aurora. Europe is moving fast with the EuroHPC program, building advanced systems like JUPITER, LUMI, and Leonardo. In Asia, Japan’s Fugaku and similar machines still play a key role. Along with speed, better energy use, new processors, and cloud HPC show supercomputers’ importance for science, industries, and solving global problems.
FAQ.
They are used in climate modelling, drug discovery, artificial intelligence, nuclear research, weather forecasting, and big data analysis.
The U.S. is in front, followed by strong systems in Europe (JUPITER, LUMI, Leonardo) and Asia (Fugaku in Japan).
They mainly use the latest CPUs and GPUs, with AMD EPYC, Intel Xeon Max, and NVIDIA Grace Hopper accelerators leading the way.
They are essential in healthcare, aerospace, automotive, energy, defence, weather prediction, and advanced AI training.
AI technologically advances the overall process of supercomputing by training models with HPC and enhancing systems through AI-driven performance tools.

Maitrayee Dey has a background in Electrical Engineering and has worked in various technical roles before transitioning to writing. Specializing in technology and Artificial Intelligence, she has served as an Academic Research Analyst and Freelance Writer, particularly focusing on education and healthcare in Australia. Maitrayee's lifelong passions for writing and painting led her to pursue a full-time writing career. She is also the creator of a cooking YouTube channel, where she shares her culinary adventures. At Smartphone Thoughts, Maitrayee brings her expertise in technology to provide in-depth smartphone reviews and app-related statistics, making complex topics easy to understand for all readers.