SurveyMonkey Statistics And Facts (2025)
Updated · Apr 16, 2025

Table of Contents
Introduction
SurveyMonkey Statistics: SurveyMonkey has become one of the most famous online platforms for online surveys; it is possibly the victor among all forces in line with the effect they have in shaping how organisations capture and analyse feedback.
The critical mobile development, with an emphasis on making life inclusive, charges SurveyMonkey with high levels of growth in 2024. The article elaborates on the SurveyMonkey statistics and trends that shaped phenomenal sales in 2024.
Editor’s Choice
- According to SurveyMonkey statistics, as a further value add to its previous forecast figure of US$118.8 million revenue for Q1 2023 by SurveyMonkey, US$46.7 million of that figure came from the sales-assisted channel (up 13 YoY), now representing 39% of the total revenue.
- Revenue/ user average rose to US$546, or 2% above the average revenue reported by SurveyMonkey.
- The non-GAAP net income stood at US$12.1 million and showed losses of US$23.8 million on a GAAP basis.
- Cash flow operations went negative at US$7.9 million, offset by a US$14.7 million net cash position.
- SurveyMonkey statistics reveal that estimated to cover around 300 thousand organisations, SurveyMonkey is treasured by an amazing total of more than 17 million active users from different parts of the world.
- Over 2 million people take surveys a day, and there have been a total of 84 billion closed questions so far.
- SurveyMonkey statistics show that the revenue generated by the company stood at US$750 million as of November 2024.
- The platform has made 2.4 million AI-motivated predictions daily toward survey design and completion.
- Users can create a panel of more than 335 million people and use 200+ filters to target their distribution.
- More than 250 templates are expert-designed by SurveyMonkey for their surveys, which can also be integrated with Salesforce, HubSpot, Microsoft Teams, and 175 other applications.
- SurveyMonkey statistics indicate that there are 16 languages in which the platform is made available, while survey distribution can go beyond 50 languages.
- Completion of mobile surveys increased yearly between 2020 and 2023 from 52% to 57.2%.
- The completion rates were almost equal among mobile and desktop surveys in the USA, with a mere 0.6% difference.
- Surveys are 4% more likely to be completed during weekends and, more especially, on mobile devices.
SurveyMonkey Financial Performance
- In this first quarter of 2023, SurveyMonkey (Momentive) noted a total revenue of US$118.8 million with a year-on-year growth of about 2%.
- A significant part was the sales-assisted channel, which brought in US$46.7 million—up by 13% from Q1 2022. This now accounts for 39% of the total revenue, compared to 35% last year.
- However, this model does not have the same number of customers as last year and has declined by 4% to about 13,200. Meanwhile, the self-serve channel earned US$72.1 million, down by 5% year-on-year.
- Deferred revenue and remaining performance obligations remained unchanged at US$216.5 million and US$245.5 million, respectively.
- SurveyMonkey had approximately 878,600 paying users at the end of the quarter, a 2% decline compared to last year.
- In fact, of these, 92% was said to have had access to an annual plan, up slightly from 91%.
- SurveyMonkey statistics state that average revenue per user (ARPU) improved by 2% to US$546. From a profitability perspective, the company reported a GAAP operating margin of -17.9 % with a net loss of US$23.8 million (US$0.16 loss per diluted share).
- On a non-GAAP basis, however, this converted to a net income of US$12.1 million, or US$0.08 per share. Operational cash flow was negative, with US$7.9 million used and a free cash flow of US$10 million.
- As of March 31, 2023, the company had a total cash and cash equivalents amounting to US$199.1 million and a total debt of US$184.3 million, which means the company is in a net cash position of US$14.7 million.
Survey Monkey Audience
- SurveyMonkey, the survey platform with probably the widest acceptance, has become a must-have for businesses, educational institutions, government agencies, and nonprofits.
- Currently, around 300,000 organisations around the globe use SurveyMonkey, suggesting its widespread acceptance and trust across different lines of business.
- These organisations rely on SurveyMonkey for so much: to elicit customer and employee feedback, conduct market research, product testing, and educational assessments.
- SurveyMonkey statistics reveal that SurveyMonkey boasts a large number of users, more than 17 million active users around the world.
- Such high patronage suggests SurveyMonkey has also swooned many individual users looking for simple, data-driven ways to collect opinion or undertake research at the user-end.
- The large user community adds to the rich data ecosystem created by SurveyMonkey over the years. The demography of the site seems to be balanced, where one gender has no upper hand over the other. 48.16% of users are male, while 51.84% are female.
- This gender-neutral distribution suggests that all genders equally buy into this site and thus create an inclusive environment for feedback and communication.
- SurveyMonkey statistics show that the largest age group engaging the SurveyMonkey website belongs to the 25-34 years bracket. This group mostly covers young professionals, graduate students, or early-career researchers- those often immersed in collecting data, project evaluations, or business insights.
- Because of the daily usage of its services, whether for academic research or consumer satisfaction tracking, SurveyMonkey excels in utilising and processing vast datasets, hence remaining responsive and relevant.
- Another defining stat of the platform is 84 billion total questions answered outstanding feat. This number reflects the degree of entrenchment SurveyMonkey has become in the decision-making of individuals and organisations.
- Those billions of responses form a pool for valuable insights, trend data, and benchmarks that users leverage to analyse opinion, preferences, and behavior.
- SurveyMonkey’s statistics state that SurveyMonkey’s health in financial metrics is yet another stronghold. By November 2024, it declared US$750 million in annual revenue.
- This revenue growth indicates how greatly users value its features and the success of its monetization strategy through paid plans, enterprise solutions, and integrations with other business tools.
- This also reflects a standing demand for reliable, scalable, and easy-to-use survey platforms in a data-driven world.
SurveyMonkey Website Traffic By Top Countries
(Source: similarweb.com)
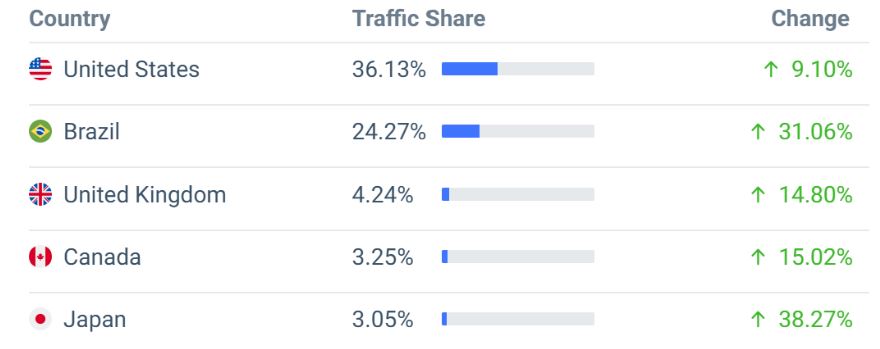
- The traffic data from SurveyMonkey statistics indicate that the US is still the most preferred country, accounting for 36.13% of overall traffic. This share, which is already dominating, has grown by 9.10%, confirming that U.S. users from businesses, universities, or government agencies are relying on the platform.
- Following next is Brazil with an impressive contribution of 24.27% to the traffic. Moreover, Brazilian traffic growth is quite impressive in itself, recording a growth of 31.06%, indicating the burgeoning interest and use of the platform in that market.
- The UK contributes 4.24% to the traffic and has grown at a steep rate of 14.80%. While the percentage contribution is smaller than the above two countries, the consistent growth shows the presence of a loyal user base.
- A similar trend is seen in Canada, too; with a 3.25% traffic share, an increase of 15.02% points towards gaining traction for user engagement.
- Japan’s lower 3.05% contribution occasions an incredible 38.27% growth among these states.
SurveyMonkey Offers
- With the latest artificial intelligence, SurveyMonkey is set to revolutionise survey building for users to craft smarter and more effective surveys.
- Every day, the platform creates more than 2.4 million AI-driven predictions that are supposed to guide users into building surveys that would compel respondents to complete them.
- The AI offers real-time suggestions on question type, wording, and format, assuring high-quality data collection by users.
- One of the major strengths of SurveyMonkey is the possibility of access to an integrated panel of more than 335 million individuals.
- As such, it cuts across barriers and brings every user into instant contact with a high number of audiences.
- Whether you are a small business trying to understand local customer behavior or a global brand seeking opinions from different regions, that extensive panel offers a fast and reliable way to source targeted feedback.
- To rival all that strength is the precision by which the surveyors at SurveyMonkey can configure their outreach.
- The platform offers more than 200 options which users can use to filter survey respondents on demographic, geographic, behavioral, or even psychographic bases.
- This allows for highly customised research- whether you’re trying to reach millennials in urban areas or professionals in specific industries, you can tailor your survey distribution to match your specific needs.
- SurveyMonkey provides more than 250 expertly designed templates on surveys to ease the creation process. These templates cover several industries, objectives, and goals, including employee engagement, customer satisfaction, academic research, event planning, and product feedback.
- Using the templates not only saves time but also structures the survey in a way that is proven to generate useful, actionable insights.
- Integration is another area where SurveyMonkey shines. There are over 175 popular-tool integrations available on the platform, including Salesforce, HubSpot, Slack, Google Sheets, and Microsoft Teams.
- With these features, users can collect responses from automated surveys based on events such as a product purchase or customer service closure and handily share data throughout the system.
- For example, responses from a customer satisfaction survey can automatically sync to a CRM system, giving teams instant access to valuable insights.
- SurveyMonkey is also a global platform; it was created to be accessible and inclusive. In a total of 16 languages, it is at present available to people all over the world in one seamless user experience. More notably, surveys can be written and distributed in over 50 different languages.
- This multilingual support ensures that researchers and companies can gather feedback from a truly international audience without language barriers getting in the way.
SurveyMonkey Survey On Mobile Statistics
- According to SurveyMonkey statistics, in three years, from 2020 to 2023, mobile survey-taking has experienced a significant rise. In 2020, 52% of all surveys were completed on mobile devices; in 2023, this had risen to 57.2%.
- This 5.2% increase indicates a decisive behavior change among users in favor of completing surveys on smartphones and tablets.
- This modified attitude could have been propelled by improvements to the mobile interface, faster Internet, and a greater inclination towards convenience on the go.
- Besides, the change is more prominent in the U.S.; the data showed that by 2023, a person was just as likely to complete a survey on the phone as on a desktop computer.
- The difference in response rates between mobile and desktop was just 0.6%, implying that mobile devices are just as engaging in surveys as traditional computers.
- This will be an important insight for organisations that are designing the surveys, as it signals to validate for mobile and desktop equally.
- Another important behavioral insight is the window during which respondents are likely to participate in surveys.
- Online surveys, especially those accessed via mobile devices, are about 4% more likely to be completed during weekends than if taken on other non-mobile platforms.
SurveyMonkey Marketing Channels
(Source: similarweb.com)
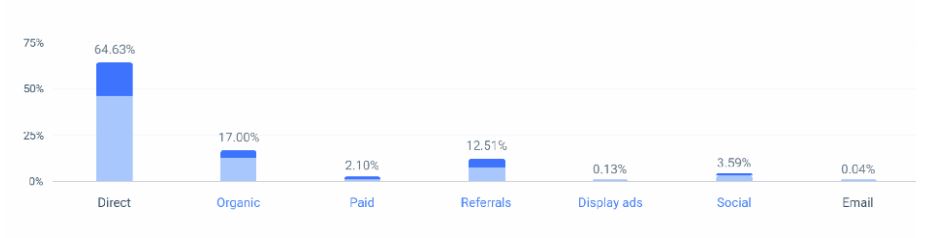
- SurveyMonkey statistics show that that SurveyMonkey enjoys the vast majority of its web traffic from a direct source, at 64.63%, which strongly suggests solid brand awareness and customer loyalty.
- Organic search makes up for another 17%, thus denoting the company’s healthy presence on search engines.
- Referrals tally up to about 12.51%, an indication of some form of collaboration with other platforms or mention on external sites.
- Paid search brings in only 2.10%, reflecting very little investment in search advertising.
- Social media provides around 3.59%, while display and email ads contribute negligible quantities of traffic at 0.13% and 0.04%, respectively.
- This segmentation illustrates the fact that SurveyMonkey heavily relies on direct and organic channel sources and very little dependence it affords to paid advertising and outbound marketing tactics.
SurveyMonkey Demographics
(Reference: similarweb.com)
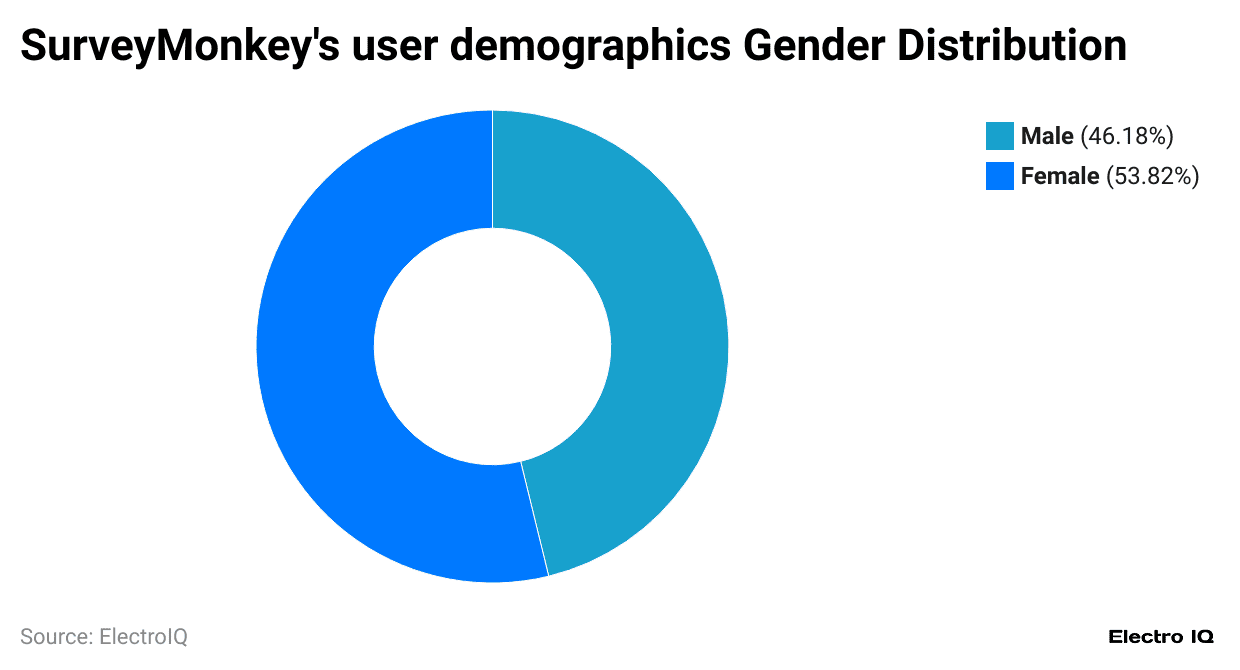
- Some very interesting trends emerge from considering SurveyMonkey’s user demographics. In terms of gender distribution, females form a slight majority with 53.82% of the users, while males make up 46.18%, meaning the audience is fairly balanced but leaning toward the female side.
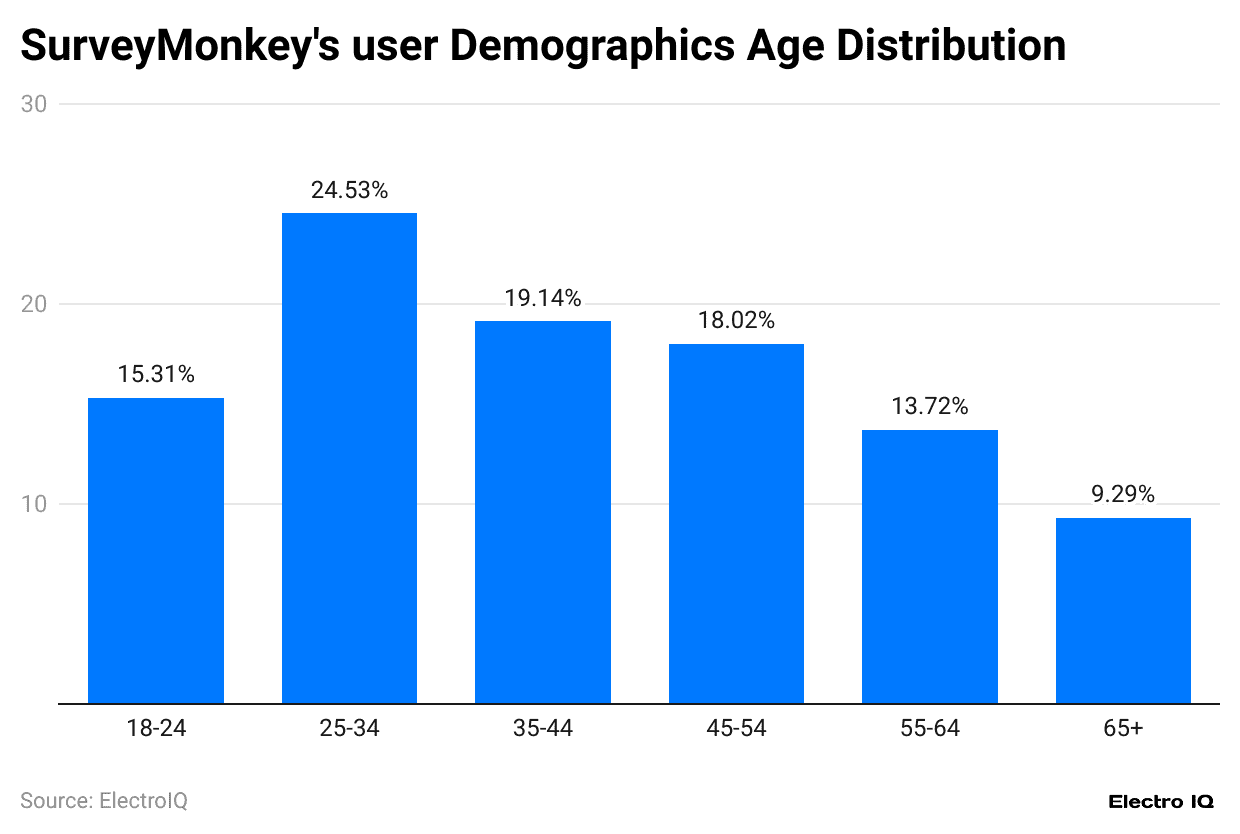
- The age distribution shows that the largest group of users falls into the 25-34 age range, equaling 24.53% of the total.
- This may imply that SurveyMonkey has found high popularity among young professionals, given its relevance for workplace feedback, conducting research, and in the academic context.
- The second largest group belongs to the age bracket of 35-44 years, accounting for 19.14% and being closely followed by persons aged between 45 years and 54 years at 18.02%.
- This gives the indication that middle-aged persons, probably in leadership or managerial positions, are also engaging in the use of surveys for organisational insights. 15.31% of young adults between 18 and 24 should leave a significant but lesser presence of students or early career people.
- Meanwhile, 13.72% of users are in the range of 55-64 years, and 9.29% of users of SurveyMonkey are 65 years or older, which indicates that the platform sees its usage among older adults as well, albeit to a lesser degree.
Conclusion
It is to be noted that, according to SurveyMonkey statistics, their performance will highlight the significance of the company in the online survey industry in 2024. With an expanding global user base, increased accessibility to mobile devices, and a pledge toward inclusivity and innovation, the platform is adapting to the changing needs of users. Because their organisations depend more and more on data-driven insights, SurveyMonkey’s tools and features position them as an important resource for meaningful decision-making.
FAQ.
SurveyMonkey is used by some 300,000 organisations and has an estimated 17 million active users worldwide, with over 2 million people taking surveys daily, adding to an overall 84 billion questions answered thus far.
By November 2024, SurveyMonkey will’ve reached revenues of $750 million annually. In Q1 2023, it recorded a revenue of $118.8 million, of which $46.7 million was achieved through the sales-assisted channel (which was a 13% YoY increase). The platform states a non-GAAP net income of $12.1 million but a GAAP net loss of $23.8 million and negative cash flow operations of $7.9 million.
U.S. contributed the most with a share of 36.13% traffic of the site followed by Brazil with 24.27%, UK with 4.24%, Canada with 3.25%, and Japan with 3.05%. The highest increment in traffic was recorded by Japan at 38.27%, demonstrating strong international adoption.
Mobile survey completions have risen from 52% in 2020 to 57.2% in 2023. Mobile and desktop completion rates in the U.S. are nearly identical, showing only a difference of 0.6%. Completing a survey is also 4% more likely on weekends, especially via mobile.
SurveyMonkey provides over 250 expert templates and more than 175 integrations (including Salesforce and HubSpot) and access to a panel of 335 million people using 200+ targeting filters. It generates 2.4 million AI-powered predictions per day to optimise question wording and dramatically increase completion rates.

Maitrayee Dey has a background in Electrical Engineering and has worked in various technical roles before transitioning to writing. Specializing in technology and Artificial Intelligence, she has served as an Academic Research Analyst and Freelance Writer, particularly focusing on education and healthcare in Australia. Maitrayee's lifelong passions for writing and painting led her to pursue a full-time writing career. She is also the creator of a cooking YouTube channel, where she shares her culinary adventures. At Smartphone Thoughts, Maitrayee brings her expertise in technology to provide in-depth smartphone reviews and app-related statistics, making complex topics easy to understand for all readers.