Amazon Statistics and Facts – By Finance, Revenue, Sellers And Employee (2025)
Updated · Sep 24, 2025

Table of Contents
- Introduction
- Editor’s Choice
- General Amazon Statistics
- Amazon’s Financial Statistics By Consolidated Statements Of Cash Flows
- Amazon’s Financial Statistics By Segment
- Amazon Revenue Statistics
- Amazon Net Income Statistics
- Amazon Employee Statistics
- Amazon Statistics By Independent Sellers
- Amazon Website Statistics
- Conclusion
Introduction
Amazon Statistics: Amazon is a major American technology company that is currently working in areas like online shopping, cloud computing, digital advertising, streaming, and artificial intelligence (AI). Jeff Bezos founded it on July 5, 1994, and has main offices in Seattle, Washington, and Arlington, Virginia. Today, Amazon is counted among the five largest tech companies in the U.S., along with Alphabet, Apple, Meta, and Microsoft. With millions of products, customers all over the world, and constant innovation, Amazon plays a leading role in both the technology and retail industries.
This article explores important and current statistical analyses from different insights that highlight Amazon’s growth, reach, and influence in the global market.
Editor’s Choice
- A report published by investing.com shows that in 2025, Amazon’s total valuation exceeds USD 2.166 trillion, placing it among the world’s top five most valuable companies, following Microsoft, NVIDIA, and Apple.
- The platform has over 310 million active users globally, with around 230 million located in the United States.
- Amazon delivers to more than 100 countries, excluding Cuba, Iran, North Korea, Sudan, Somalia, Yemen, and Syria.
- Its Amazon Prime service counts more than 220 million subscribers worldwide, including about 180.1 million in the U.S., and is available in 23 countries.
- Prime Video alone reaches roughly 200 million users, while the ad-supported version attracts over 130 million monthly viewers in the U.S.
- In 2024, Amazon Prime membership generated USD 44.374 billion, with each subscriber spending an average of USD 1,400 per year.
- Amazon.com sees around 2.6 billion visits monthly, with sessions averaging 11 minutes and 33 seconds.
- The company dominates five categories with over 90% market share, including batteries and skincare.
- Third-party sellers make up 62% of Q4 2024 sales, and about 25% earn over USD 100,000 annually.
- Amazon employs roughly 1,556,000 workers and earned USD 17.28 billion from advertising in 2025, an 18% increase from the previous year.
General Amazon Statistics
- A report published by businessofapps.com stated that in 2024, Amazon Web Services revenue accounted for USD 107.5 billion.
- In the same period, the company’s subscription revenue resulted in USD 44.3 billion.
- Meanwhile, the advertising revenue resulted in USD 56.2 billion.
- Over the past five years, Amazon’s market value has grown dramatically, rising from USD 172 billion in 2015 to USD 1.7 trillion in 2024.
- As of 2024, Amazon Prime secured 250 million subscribers, while in the United States, Amazon Prime subscribers accounted for 181 million subscribers.
- Amazon Prime Video in 2024 made up around 230 million users, and Amazon Prime Music reached 75 million users.
- Besides, Amazon Prime Video spent approximately USD 21.5 billion in the same time.
- Amazon Prime Day sales in the United States reached USD 14.2 billion, making up most of the total sales.
- In 2024, the total number of sold-out Amazon Echos was around 25 million.
- Amazon Fire TV secured a market share of 15% in the same time period.
- Moreover, available apps in the Amazon App Store were 550,668.
(Reference: infogram.com)
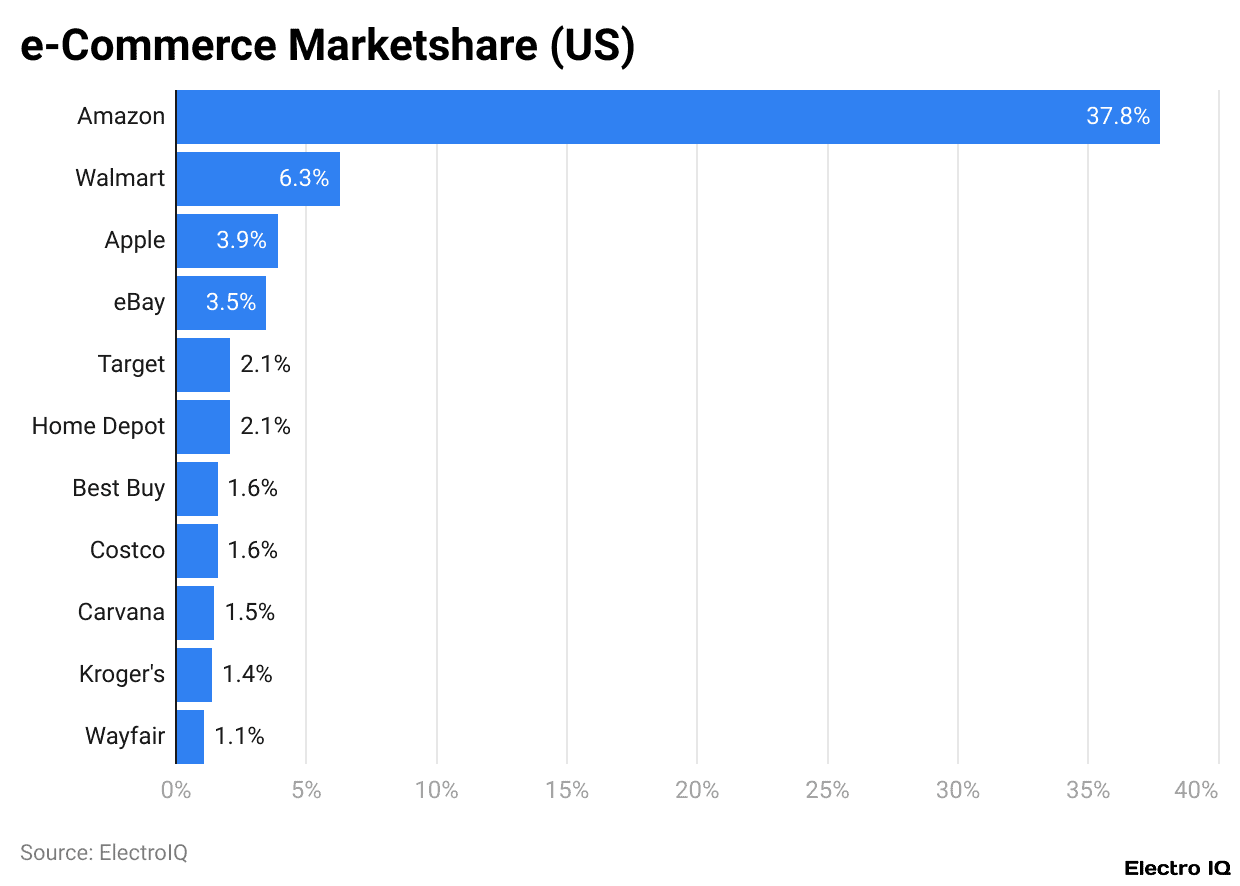
- Amazon dominated U.S. e-commerce, capturing 37.8% of the market share.
Amazon’s Financial Statistics By Consolidated Statements Of Cash Flows
| Metrics (USD millions) |
Three Months Ended March 31, 2025 |
Twelve Months Ended March 31, 2025 |
| Cash balance, cash equivalents, and restricted cash | 82,312 | 73,332 |
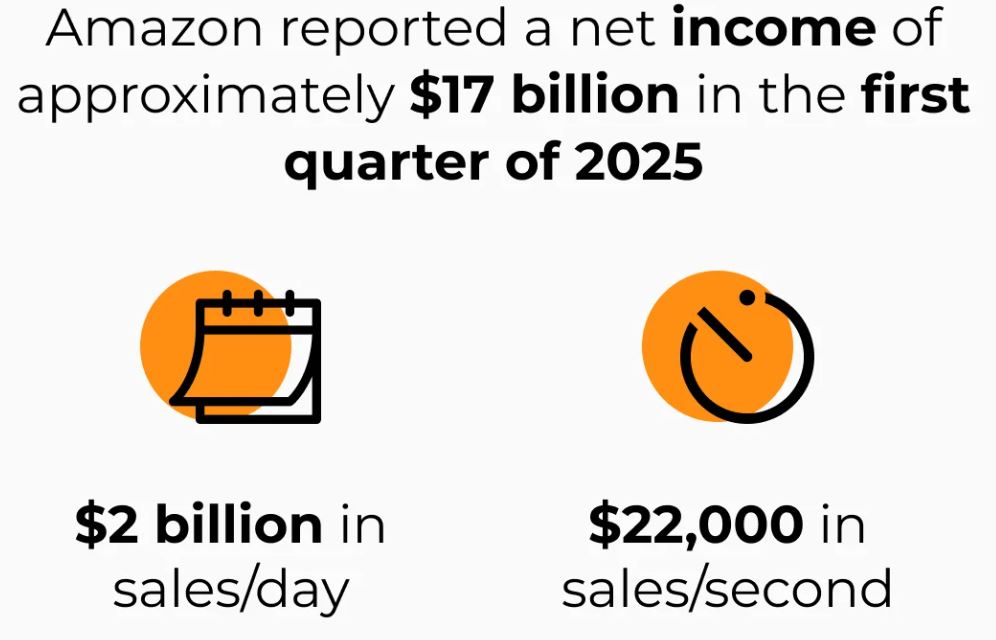
| Net income | 17,127 | 65,944 |
| Depreciation and amortisation of property and equipment, capitalised content costs, and operating lease assets | 14,262 | 55,373 |
| Stock-based compensation | 3,689 | 20,739 |
| Non-operating expense (income) | 2,817 | 3,539 |
| Deferred income taxes | 507 | 3,203 |
| Net cash provided by operating activities | 17,015 | 113,903 |
| Purchases of property and equipment | 25,019 | 93,093 |
| Proceeds from property and equipment sales and incentives | 764 | 5,115 |
| Acquisitions, net of cash acquired, non-marketable investments | 48 | 3,680 |
| Sales and maturities of marketable securities | 7,737 | 22,748 |
| Purchases of marketable securities | 13,333 | 37,373 |
| Net cash provided by investing activities | 29,803 | 106,283 |
| Proceeds from short-term debt | 1,815 | 6,619 |
| Repayments of short-term debt | 2,082 | 6,738 |
| Repayments of long-term debt | – | 8,852 |
| Principal repayments of finance leases | 410.00 | 1,683 |
| Principal repayments of financing obligations | 116 | 695 |
| Net cash provided by financing activities | 47 | 10,603 |
| Foreign currency, cash equivalents, and restricted cash | 416 | 456 |
| Net increase (decrease) in cash, cash equivalents, and restricted cash | 12,419 | 3,439 |
| Cash paid for interest on debt, and net capitalised interest | 236 | 1,825 |
| Cash paid for operating leases | 3,562 | 12,571 |
| Cash paid for interest on finance leases | 71 | 284 |
| Cash paid for interest on financing obligations | 55 | 210 |
| Cash paid for income taxes | 877 | 12,727 |
| Assets acquired under operating leases | 4,321 | 15,992 |
| Property and equipment acquired, net of remeasurements and modifications | 54 | 866 |
| Increase (decrease) in property and equipment acquired but not yet paid for | 3,108 | 9,736 |
By Consolidated Statements Of Operations
| Metrics (in USD millions, except per share data) |
Three Months Ended March 31, 2025 |
| Total net sales | 155,667 |
| Total operating expenses | 137,262 |
| Total non-operating income (expense) | 3,274 |
| Net income | 17,127 |
| Basic earnings/share | 1.62 |
| Diluted earnings/share | 1.59 |
| Weighted-average shares of earnings per share | |
| Diluted | 10,793 |
| Basic | 10,603 |
Amazon’s Financial Statistics By Segment
- A report published by ir.aboutamazon.com states that for the quarter ending March 31, 2025, Amazon’s North America division generated USD 92,887 million in net sales.
- Meanwhile, the operating expenses totalled USD 87,046 million, producing an operating profit of USD 5,841 million.
- The International segment posted net sales of USD 33,513 million and incurred operating costs of USD 32,496 million, resulting in USD 1,017 million in operating profit.
- Amazon Web Services (AWS) reported net sales of USD 29,267 million with expenses of USD 17,720 million, yielding an operating income of USD 11,547 million.
- Overall, the company’s consolidated net sales amounted to USD 155,667 million, with total expenses of USD 137,262 million, generating an operating profit of USD 18,405 million.
- After including non-operating income of USD 3,274 million, income tax expenses of USD 4,553 million, and minor equity investment effects, net earnings reached USD 17,127 million.
- In 2025, North American sales growth accounted for 60%, followed by International 21%, and AWS 19% of total revenue.
Amazon Revenue Statistics
(Source: ctfassets.net)
- As of 2025, Amazon earns over USD 2 billion daily.
- This breaks down to around USD 80 million in revenue each hour, approximately USD 1.33 million every minute, and more than USD 22,000 per second.
(Reference: infogram.com)
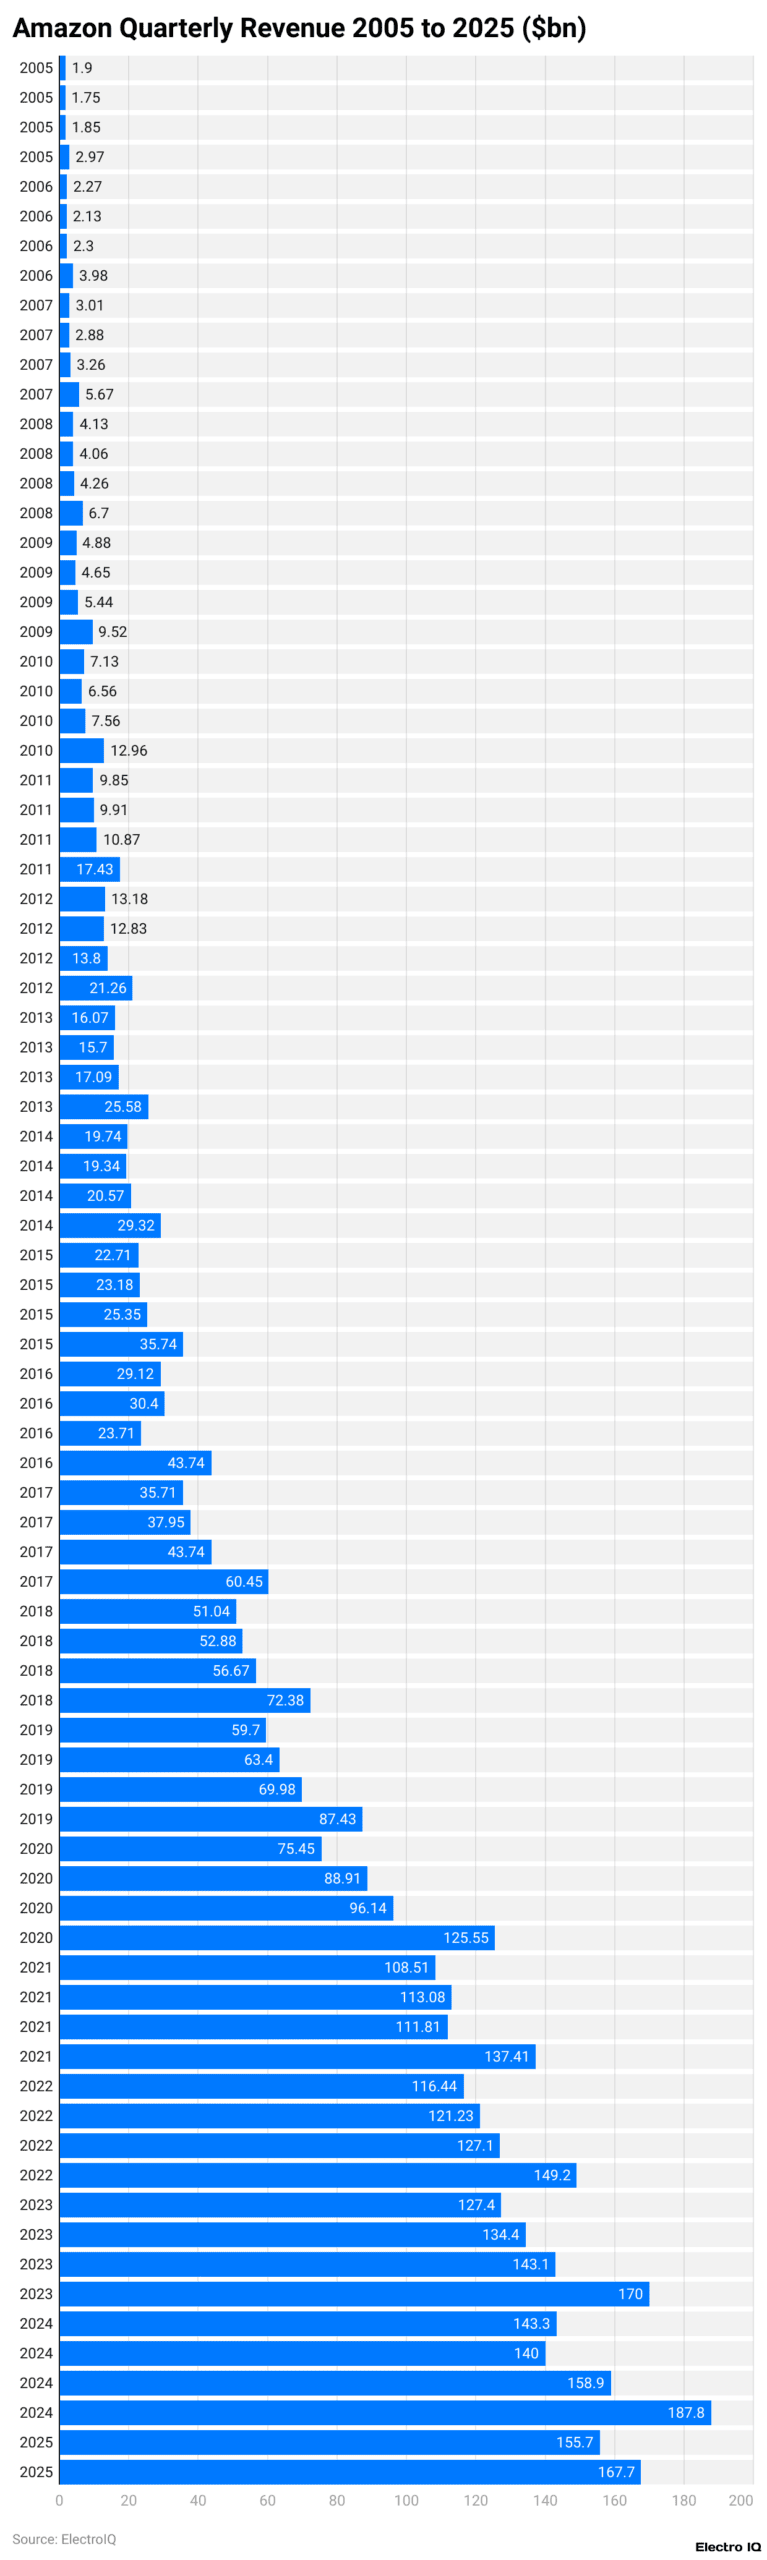
- The above graphical representation states that in Q1 2025, Amazon accounted for USD 155.7 billion, and in Q2 it reached around USD 167.7 billion.
- Furthermore, in 2024, other quarterly analyses of Amazon were Q1 (USD 143.3 billion), Q2 (USD 140 billion), Q3 (USD 158.9 billion), and Q4 (USD 187.8 billion).
By Business Line
| Business Types | Q2 2024 (USD billion) |
Q2 2025 (USD billion) |
YoY Growth |
| AWS | 23%26.3 | 30.9 | 17% |
| Online Stores | 55.4 | 61.5 | 11% |
| Physical Stores | 5.2 | 5.6 | 7% |
| Third-party Seller Services | 36.2 | 40.3 | 11% |
| Subscription Services | 10.9 | 12.2 | 12% |
| Advertising Services | 12.8 | 15.7 | 23% |
| Other | 1.3 | 1.5 | 19% |
By Segments
- A report published by businessofapps.com states that in 2024, Amazon generated USD 247 billion from its online stores and USD 157.1 billion from third-party retail services.
- In the same period, Amazon Web Services (AWS) generated USD 107.5 billion.
- Meanwhile, the subscription services accounted for around USD 44.3 billion.
- Furthermore, Advertising revenue totalled USD 56.2 billion, followed by physical stores ( USD 21.2 billion) and other sources (USD 5.4 billion).
By Region
- As of 2024, the North America segment accounted for USD 387.4 billion in revenue for Amazon, according to Business of Apps.
- Meanwhile, the company earned approximately USD 142.9 billion from its international operations.
- Lastly, Amazon Web Services (AWS) made up nearly USD 107.5 billion in revenue.
| Segment | Q2 2024 (USD billion) |
Q2 2025 (USD billion) |
YoY Growth | Total Revenue Share |
| North America | 90 | 100.1 | 11% | 60% |
| International | 31.7 | 36.8 | 16% | 22% |
| AWS | 26.3 | 30.9 | 17.5% | 18% |
Amazon Net Income Statistics
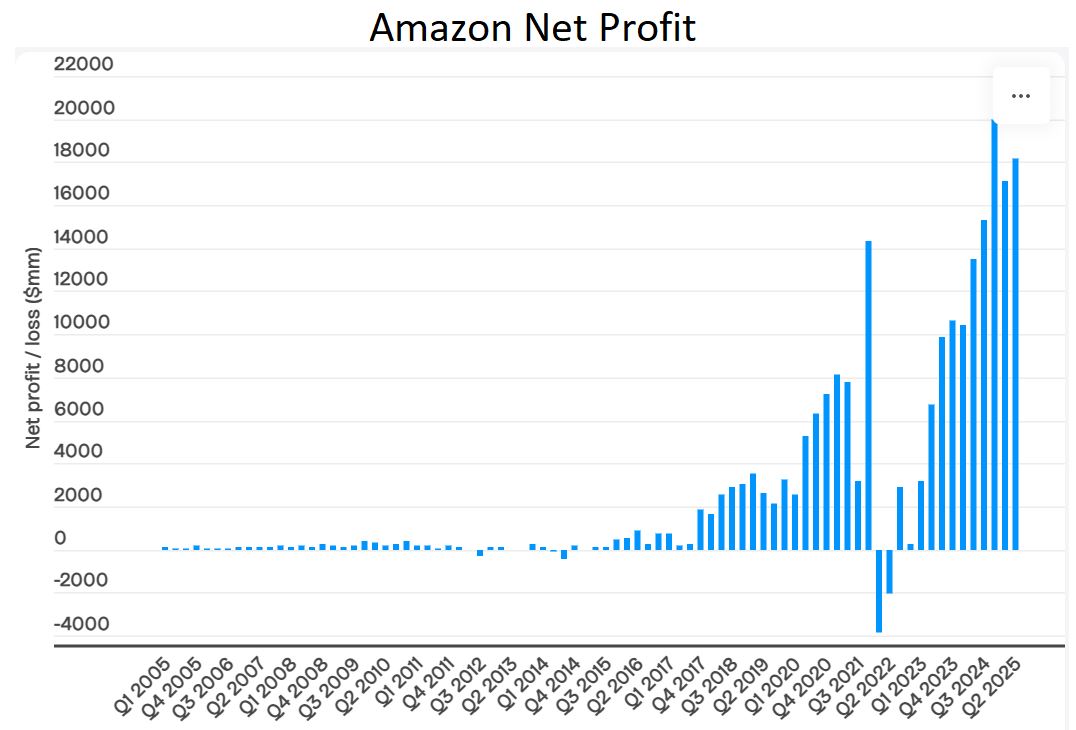
(Reference: infogram.com)
- Amazon’s net income resulted in USD 17,127 million in the first quarter of 2025 and reached around USD 18,164 million in the second quarter of 2025.
- Other quarterly net profits of Amazon in 2024 are mentioned as Q1 (USD 10,431 million), Q2 (USD 13,485 million), Q3 (USD 15,328 million), and Q4 (USD 20,004 million).
Amazon Employee Statistics
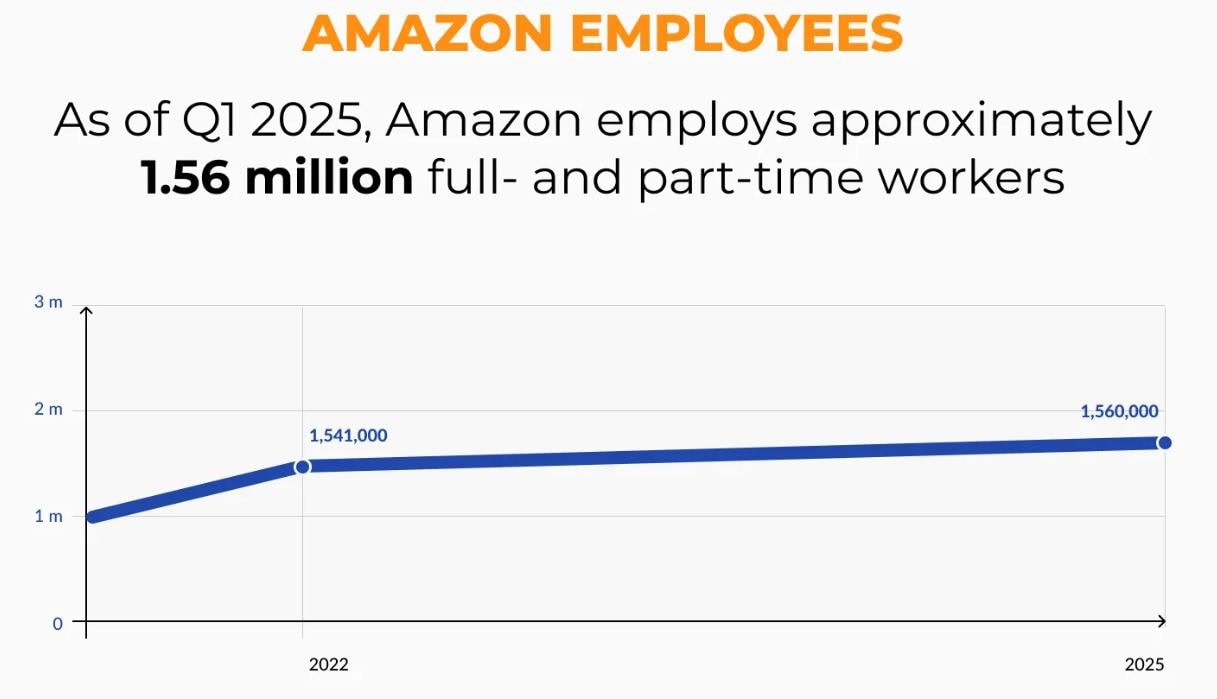
(Source: ctfassets.net)
- Amazon’s workforce reached a high of 1.62 million employees in early 2022, but it slightly decreased afterwards.
- By the first quarter of 2025, the company will have about 1.56 million full-time and part-time workers.
Amazon Statistics By Independent Sellers
- According to sell.amazon.com, over 60% of all sales on Amazon come from independent sellers, many of those were small and medium-sized businesses.
- In 2024, U.S.-based independent sellers earned an average of more than USD 290,000 each in annual sales.
- Additionally, more than 55,000 of these sellers achieved over USD 1 million in sales that year.
By Brands in Stores
- In 2024, Amazon blocked over 99% of potentially infringing listings before brands could report them.
- Over 16,000 brands have joined Brand Registry using Amazon’s IP Accelerator service.
- Additionally, more than 2.5 billion products have been confirmed as authentic through Amazon’s Transparency program.
By Tools, Programs, and Services
- Fulfillment by Amazon (FBA) costs roughly 70% less per unit than other premium U.S. services.
- Products enrolled in the Subscribe & Save program, which offer a 10% to 15% discount, can boost sales conversions by up to 1.8 times on average.
- Adding Basic A+ Content to listings can encourage customers to buy again, raising sales by as much as 8%.
- Since its launch in 2011, Amazon Lending has provided over USD 15 billion in funding to help small and medium-sized businesses grow.
- Sellers who use Veeqo for purchasing shipping labels experience around 20% fewer late deliveries on Amazon orders.
- The Buy with Prime feature can boost off-Amazon customer purchases by around 25%.
By Top Products and Categories
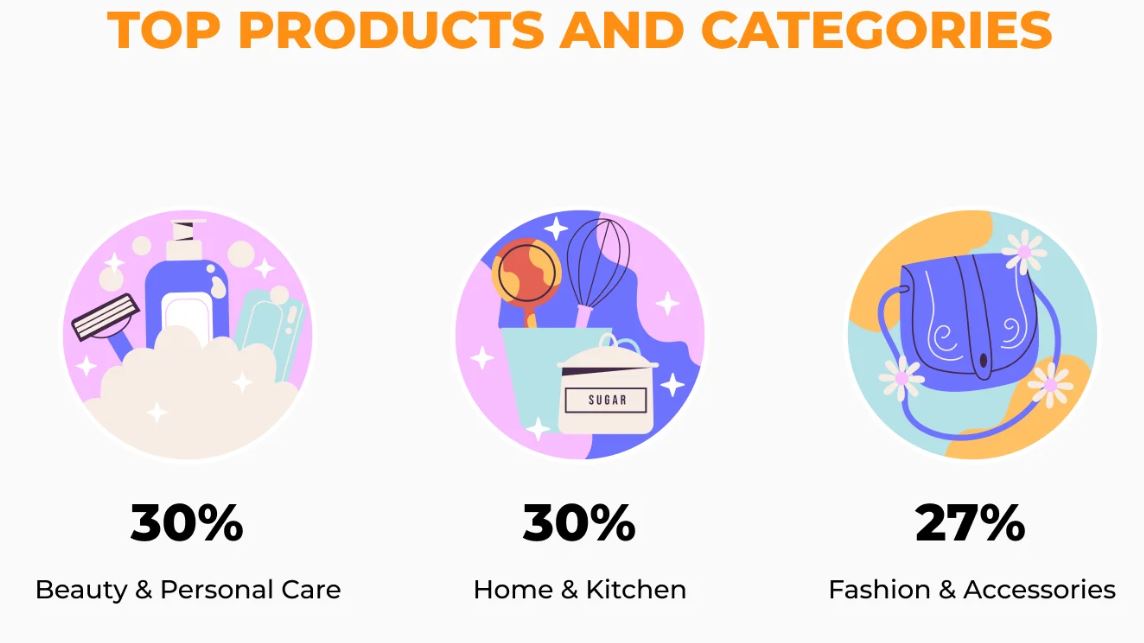
(Source: ctfassets.net)
- In the first half of 2024, the most profitable sellers were mainly in three categories: Beauty & Personal Care (30%), Home & Kitchen (30%), and Fashion & Accessories (27%).
- In June 2025, AMZScout reported that in Beauty & Personal Care, gel vegan eye patches sold about 71,000 units monthly, earning over USD 1.5 million.
- In Home & Kitchen, a blender with a portable cup sold 74,050 units, making around USD 2,281,040.
- In Fashion & Accessories, a portable travel fan was sold at around 83,775 units, resulting in USD 1,365,643.
By Special Sales Events
- In 2025, on day one, Amazon’s summer Prime Day begins with USD 7.9 billion in sales, with an increase of 9.9% from 2024.
- Besides, the total U.S. online revenue reached USD 24.1 billion.
- Shoppers made almost 154,807 orders, buying over 300,000 items during the event.
Amazon Website Statistics
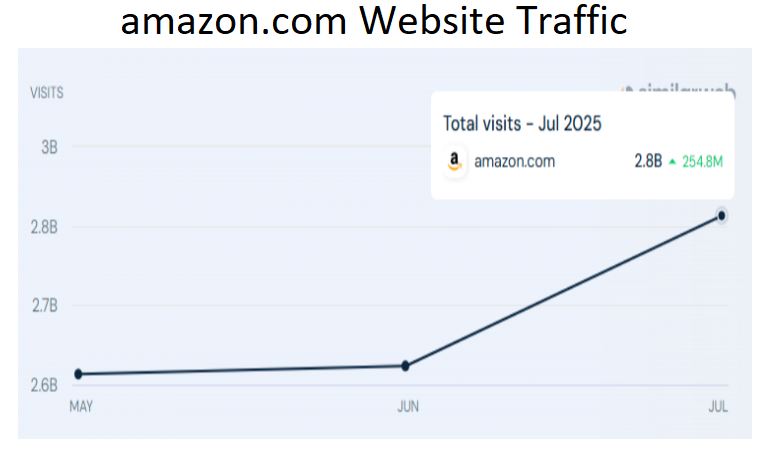
(Reference: similarweb.com)
- In July 2025, Amazon.com got roughly 2.8 billion visits, up from 254.8 million in June, showing a growth of nearly 9.85%.
- On average, each visitor spent about 6 minutes and 19 seconds browsing the site and searched almost 10 pages per visit.
- Besides, the bounce rate of amazon.com recorded at 30.26%, in the same duration.
By Country
(Reference: similarweb.com)
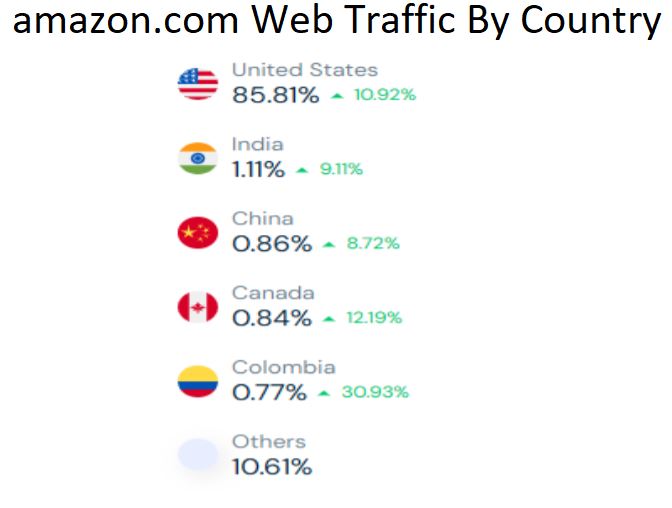
- In July 2025, most of Amazon.com’s visits came from the United States, making up 85.81% of total traffic, which grew by 10.92%.
- India accounted for 1.11% of visits, showing a rise of 9.11% over the period.
- China contributes 0.86% of traffic, showing growth of 8.72%, while Canada accounts for 0.84%, up by 12.19%.
- Colombia, though representing only 0.77% of traffic, experienced the highest growth rate at 30.93%.
- The remaining 10.61% of visits come from other countries.
By Demographics
(Reference: similarweb.com)
- The data for Amazon.com shows that its users are shared by gender, representing 51.88% and females accounting for 48.12%.
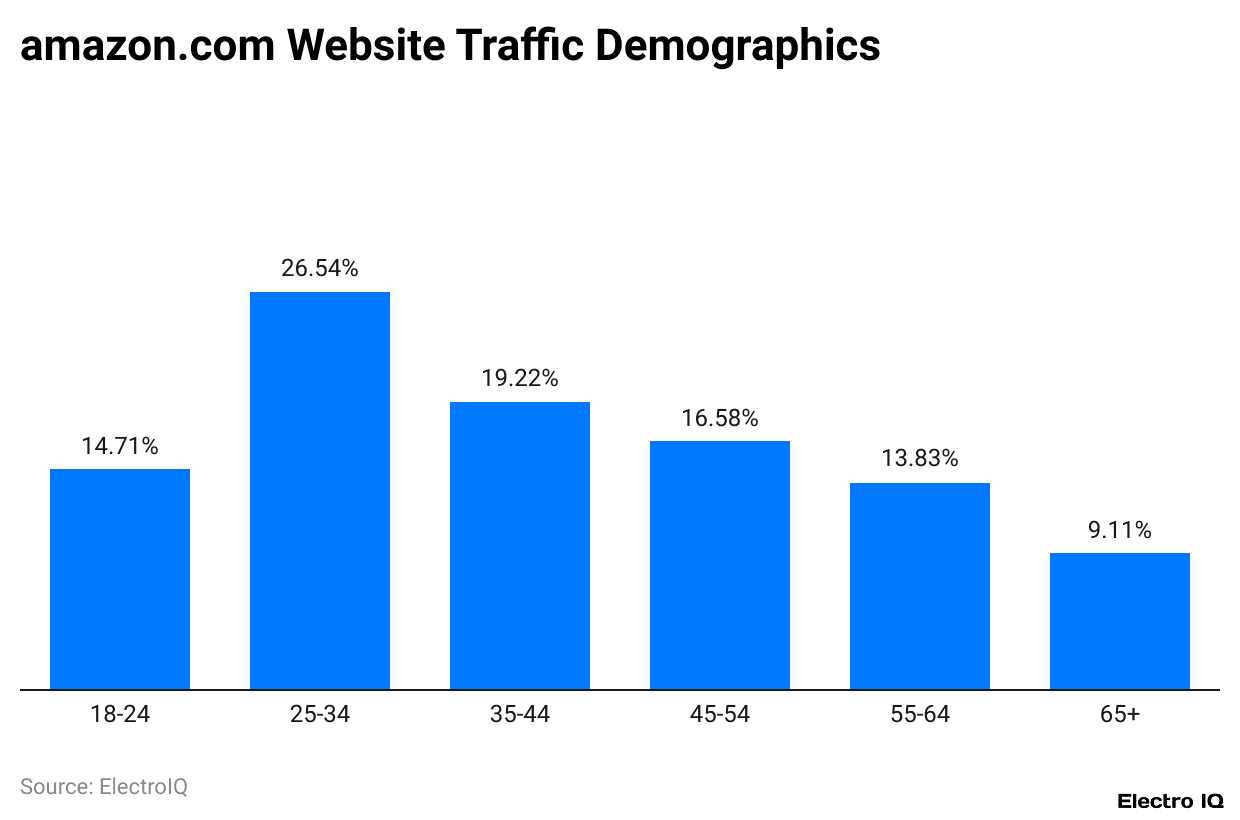
- In terms of age distribution, the largest group of users was between 25 and 34 years old, making up 26.54% of the total.
- This is followed by the 35–44 age group at 19.22% and the 45–54 group at 16.58%.
- Younger adults aged 18–24 represent 14.71%, while the 55–64 age range accounts for 13.83%, and users aged 65 and older make up the smallest share at 9.11%.
By Marketing Channels Distribution
(Reference: similarweb.com)
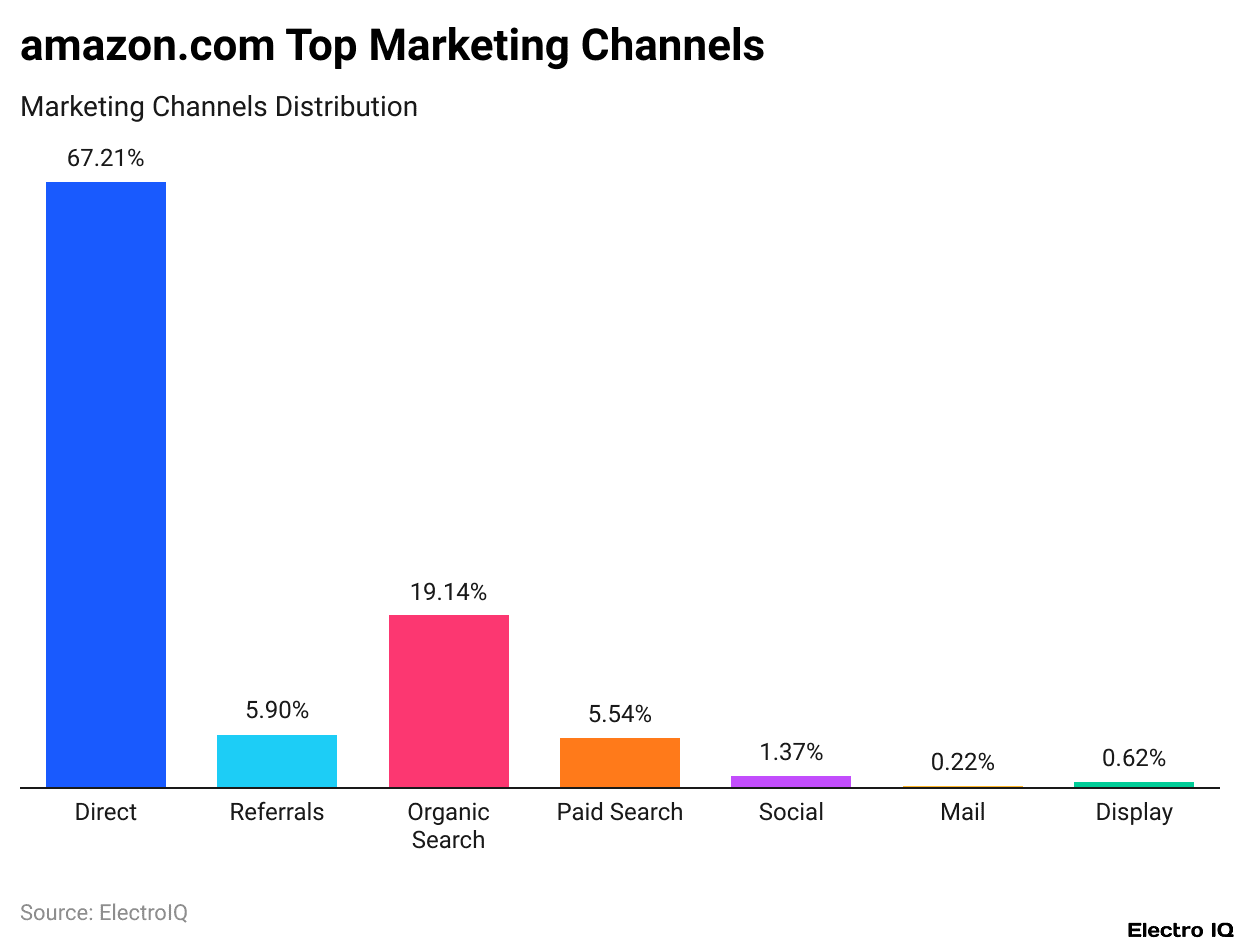
- In July 2025, most people visiting Amazon.com will come directly to the site, making up 67.21% of all traffic.
- About 19.14% of visitors find Amazon through search engines without clicking on ads. Links from other websites, known as referrals, bring in 5.9% of the traffic.
- Paid search ads attract 5.54% of visitors, showing how advertising helps reach customers.
- Smaller amounts of traffic were generated from social (1.37%), email (0.22%), and display (0.62%).
By Social Network Distribution
(Reference: similarweb.com)
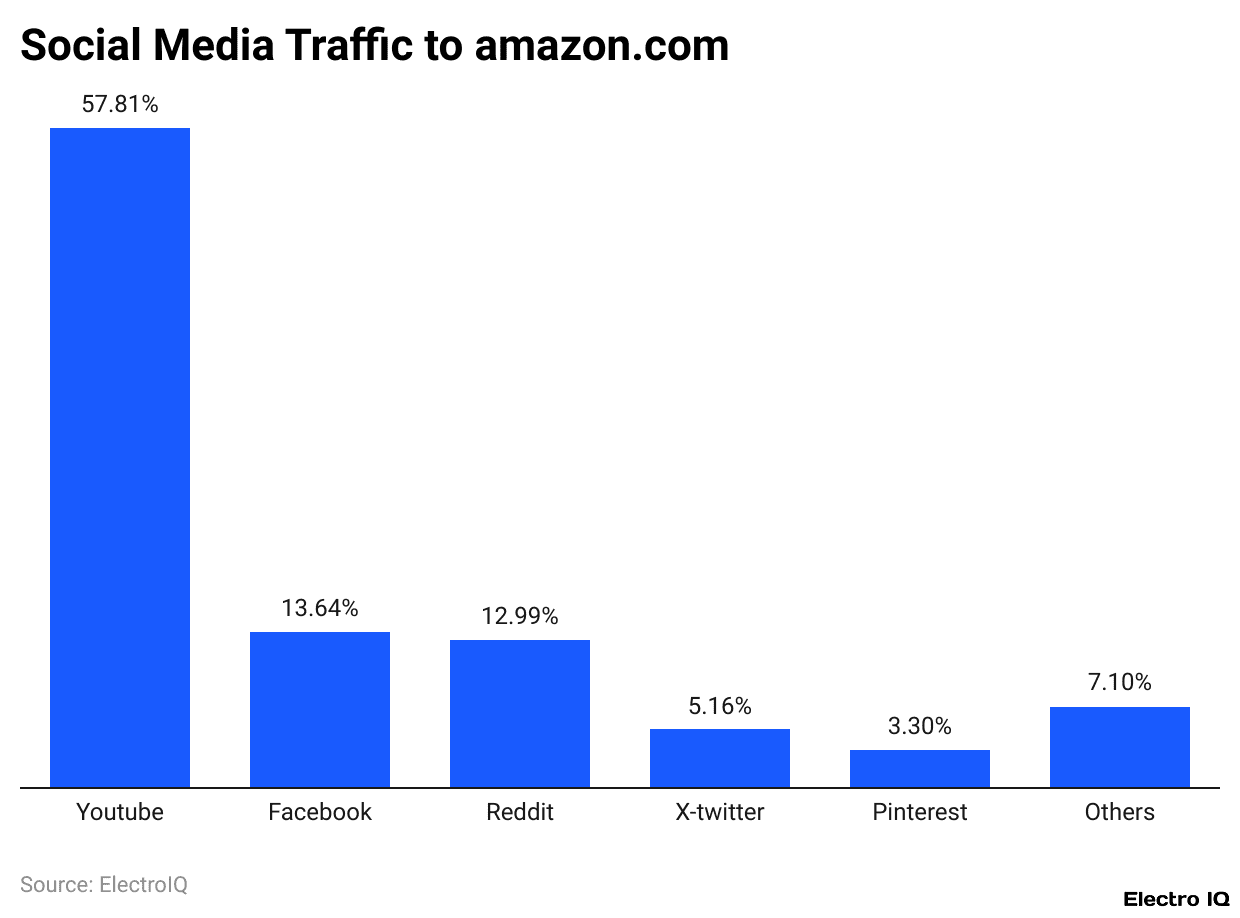
- Based on the chart showing social network distribution for Amazon.com, YouTube dominates with a significant 57.81% share, as of July 2025.
- Facebook follows with 13.64%, and Reddit is close behind at 12.99%.
- X-Twitter accounts for 5.16% of the distribution, while Pinterest represents a smaller 3.3%.
- The remaining 7.1% is attributed to other social networks.
Conclusion
To sum up, Amazon has steadily grown into one of the world’s top companies by widening its presence in many areas. The company’s businesses in the North American region and other countries bring in large amounts of revenue, while Amazon Web Services contributes huge profits.
As the technology is enhancing, it’s now more focused on innovation, keeping customers happy, and continues to lead in e-commerce, cloud services, and more. Its flexibility and constant growth explain why it remains such a strong and influential company worldwide.
FAQ.
The largest items on Amazon are usually furniture, like beds or sofas, which require special shipping options.
Electronics, particularly Amazon’s own devices like the Echo and Fire TV, have generated the highest sales.
The most expensive items are luxury yachts, private jets, or high-end real estate listings.

Maitrayee Dey has a background in Electrical Engineering and has worked in various technical roles before transitioning to writing. Specializing in technology and Artificial Intelligence, she has served as an Academic Research Analyst and Freelance Writer, particularly focusing on education and healthcare in Australia. Maitrayee's lifelong passions for writing and painting led her to pursue a full-time writing career. She is also the creator of a cooking YouTube channel, where she shares her culinary adventures. At Smartphone Thoughts, Maitrayee brings her expertise in technology to provide in-depth smartphone reviews and app-related statistics, making complex topics easy to understand for all readers.


