Apple Pay Vs Google Pay Statistics By Transaction Limits, Revenue, Usage and Facts (2025)
Updated · Nov 25, 2025


Table of Contents
- Introduction
- Editor’s Choice
- Basis Comparison Between Apple Pay and Google Pay
- By Revenue and Transactional Volume
- By Usage and Users Statistics
- By User Demographics Statistics
- Top Sites Usage Analysis
- Usage Frequency Statistics
- Countrywise Adoption Statistics
- Technological Comparison Statistics
- Global Online Payment Market Statistics
- By Customers
- By Availability and Compatibility
- By Transaction Limits
- Conclusion
Introduction
Apple Pay vs Google Pay Statistics: People now use their phones to pay for everyday purchases, and Apple Pay and Google Pay are among the most popular options. Both help users pay quickly and safely without needing to swipe a physical card. However, they are not used in the same way everywhere. Their popularity changes by country, device type, and user group.
In this article, we look at numbers such as market share, transaction volume, user growth, and how people use each app. These statistics show where each service is stronger, how they compare, and what might happen next. This information can guide businesses, app developers, and policymakers as digital payments grow and new ideas and partnerships appear.
Editor’s Choice
- In 2025, Apple Pay is projected to process around USD 8.7 trillion in global payments and about USD 2.9 trillion in U.S. payments, with an average ticket size of USD 57 per purchase and about 32% of all U.S. contactless POS activity attributed to Apple Pay.
- In the same 2025 scenario, Google Pay is estimated to reach about USD 5.2 trillion in global transaction value, up from USD 4.3 trillion in 2024, and around USD 1.4 trillion in U.S. transactions, with an average spend of USD 48 and roughly 26% of Android in-store payments worldwide.
- Apple Pay revenue from interchange-style and network participation fees is expected in this framework to be about USD 5.6 billion in 2025, reflecting its role as a high-value wallet on premium devices.
- Google Pay revenue is estimated around USD 3.1 billion in 2025, mainly from advertising, in-app integrations, and partner arrangements, showing a more ecosystem-driven monetization model.
- Within the same period, Apple Pay is expected to facilitate more than USD 870 million in buy-now-pay-later (BNPL) transactions, adding a small but growing contribution to its total payment value.
- Apple Pay is estimated to have about 624 million users worldwide in 2025, and around 22.3% of American consumers aged 14+ are projected to use Apple Pay, which shows strong penetration in mature smartphone markets.
- Google Pay reached around 820 million active users globally in 2025, with about 17% year-on-year growth, and roughly 62% of this user base is located in India, which confirms its heavy concentration in high-volume emerging markets.
- Apple Pay operates in more than 78 to 90 markets, and in many leading countries its in-store user penetration often exceeds 50% of digital wallet holders, indicating deep integration into everyday payments for iOS users.
- Google Pay is active in more than 45 countries and supports payments in over 60 currencies, while about 75% of smartphone users in major cities have Google Pay installed, which shows a strong urban adoption profile.
- In the U.S. digital wallet market, Apple Pay holds about 38% share, while Google Pay holds about 15%, which positions Apple Pay as the leading wallet among American users by market share.
- At the global mobile wallet level, one dataset for 2025 places Apple Pay at about 24% market share and Google Pay at around 18–22%, which confirms that both products rank among the top wallets worldwide, with Apple Pay slightly ahead.
- In India, Google Pay leads mobile wallet usage, with around 54% of consumers using it for payments and about 36.09% of UPI transaction volume and 35.20% of UPI value in May 2025, which indicates a dominant role in one of the world’s largest real-time payments markets.
- Apple Pay has a 54% share of in-store mobile wallet usage in the U.S. and is accepted at about 85% of U.S. retailers, while it accounts for about 3–3.5% of all in-store purchases and over 14% of online consumer payments, which shows that its influence is higher inside the digital wallet category than in total retail spend.
- Google Pay processed around USD 1.32 trillion in documented global transaction value in 2025, with about USD 490 billion handled in the United States and roughly USD 610 billion in India, and about 52% of its transactions were below USD 100, which indicates a heavy focus on high-frequency, everyday spending.
Basis Comparison Between Apple Pay and Google Pay
| Features | Apple Pay | Google Pay |
| Developer | Created and managed by Apple | by Google |
| Launch Date | Introduced on October 20, 2014, as Apple’s own mobile payment service. | Started as Google Wallet on May 26, 2011, later renamed Android Pay (2015), then Google Pay (2018). |
| Main operating systems | Works on iOS 8.1 or later, all watchOS versions, macOS Sierra or later, all visionOS versions (with newer iOS versions needed for Apple Pay on the web and Apple Cash) | Works on Android 9 or later, Wear OS 2.18 or later, and Fitbit OS |
| In-store use | Can be used in shops with an iPhone 6 or newer, or an Apple Watch (paired with iPhone, or Series 3+ with cellular) | Can be used in shops with Android phones or Wear OS/Fitbit OS smartwatches that have NFC |
| Online/in-app use | Works on the web mainly through Safari on supported iPhones, iPads, Macs, Apple Vision Pro, and via Handoff between Mac and iPhone/Apple Watch; also supported in third-party browsers using WebKit on newer devices. | Can be used on the web from Android, ChromeOS, Windows, macOS, iOS, iPadOS, and Linux through browsers like Chrome, Edge, Firefox, Opera, Samsung Internet, and Safari. |
| License type | Proprietary (closed-source, controlled by Apple) | Proprietary (closed-source, controlled by Google) |
| Official site | apple.com/apple-pay | pay.google.com/about/ |
By Revenue and Transactional Volume
- In 2025, Apple Pay will process around USD 8.7 trillion worldwide and USD 2.9 trillion in U.S. payments, with an average ticket of USD 57 per purchase and accounting for 32% of all U.S. contactless POS activity.
- Google Pay is estimated to reach USD 5.2 trillion globally in 2025, up from USD 4.3 trillion in 2024, and logged USD 1.4 trillion in U.S. transactions, with an average spend of USD 48 and 26% of Android in-store payments worldwide.
- Apple Pay mainly earns from interchange-style fees, bringing in about USD 5.6 billion in 2025.
- Google Pay will generate around USD3.1 billion that year from ads, app integrations, and partner deals.
- Meanwhile, Apple Pay will power more than USD 870 million through buy-now-pay-later transactions in the same period.
By Usage and Users Statistics
- According to CoinLaw, by 2025, Apple Pay will work in more than 85 countries, while Google Pay handles payments in over 60 currencies and is integrated with 6.4 million merchants worldwide.
- Apple Pay is expected to process over USD 7.6 trillion in 2025 (the highest wallet transactions), while Google Pay logs 2.1 billion transactions, up 30% year-on-year.
- At physical checkout, Apple Pay is accepted at 94% of U.S. retailers, while Google Pay is supported by 87% of U.S. merchants for contactless payments.
- In the U.S., Gen Z mobile wallet users in 2025, 71% choose Apple Pay first, and 49% prefer Google Pay for contactless payments.
- In 2025, Apple Pay had about 659 million global active users and roughly 24% market share, while Google Pay reached approximately 820 million users and about 18% to 21.5% share.
- In the same period, Apple Pay will have more than 580 million active users globally, while Google Pay will have 5.2 billion cumulative global downloads.
(Source: emarketer.com)
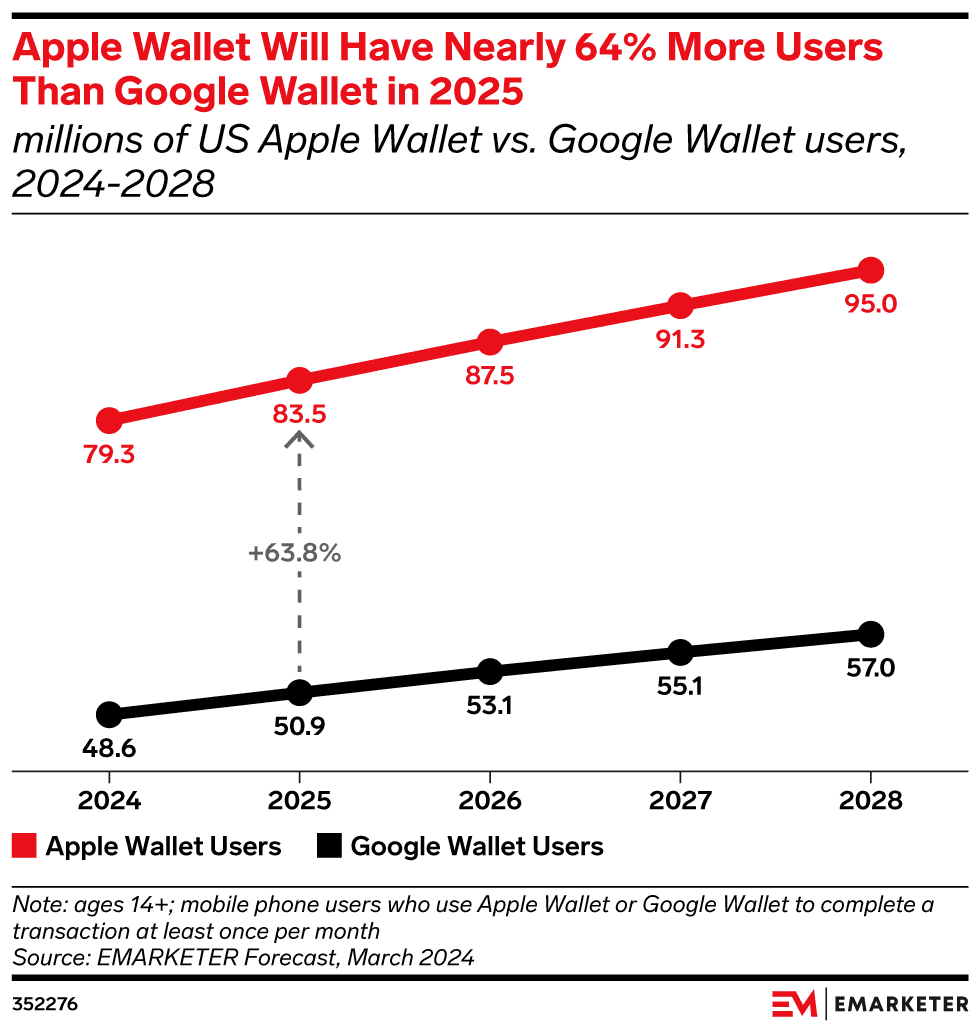
- As of 2025, in the U.S., Apple Pay/Wallet is forecast to reach around 83.5 million users, ahead of Google Wallet/Pay at 50.9 million.
- In the coming years, user counts of Apple Pay and Google Pay are expected to be 87.5 million & 53.1 million (2026), 91.3 million & 55.1 million (2027), and 95 million & 57 million (2028).
- Apple Pay leads the U.S. mobile-wallet race with a 57% share, while Google Pay dominates India, with around 72% of smartphone owners using it.
By User Demographics Statistics
| Apple Pay | Google Pay |
| About 70% of Apple Pay users are 18 to 34 years old (Gen Z + Millennials). | Around 85% of Google Pay users are aged 18 to 45. |
| 73.1% of Gen Z wallet owners use Apple Pay at least weekly; 71% say they prefer Apple Pay over other wallets. | CoinLaw reports Gen Z adoption up by 30%, especially for P2P payments and subscriptions. |
| Only 4.0% of all U.S. Millennials use Apple Pay, but 51.1% of Millennial digital-wallet owners use it weekly. | Millennials (25 to 40) make up 45% of the global Google Pay user base, the largest single age group. |
| 1.1% of Gen X and 0.2% of pre-1965 consumers use Apple Pay, yet over 50% of Gen X digital wallet owners use it weekly. | Google Pay has cross-generational appeal: CoinLaw notes that the remaining 55% of users are spread across Gen Z, Gen X, and Boomers. |
| About 55% male and 45% female globally. | |
Top Sites Usage Analysis
- In the global top 1k most visited sites, Apple Pay is used on 105 sites, whereas Google Pay is used on 74 sites, indicating that Apple Pay has wider adoption in the very highest traffic tier.
- Within the top 10k sites, Apple Pay is implemented on 630 sites, while Google Pay is present on 471 sites, showing that Apple Pay continues to hold a stronger footprint in this broader premium segment.
- Across the top 100k sites, Apple Pay is detected on 4,316 sites compared with 3,495 sites using Google Pay, which reflects a consistently higher integration level for Apple Pay among high-traffic domains.
- In the top 1 million sites, Apple Pay appears on 38,518 sites, whereas Google Pay is used on 39,695 sites, indicating that Google Pay slightly overtakes Apple Pay when adoption is assessed across a wider mid to long tail of websites.
- Considering the entire internet, Apple Pay is in use on 2,169,711 sites, while Google Pay is present on 1,813,130 sites, suggesting that Apple Pay maintains a broader overall deployment across all indexed websites.
| Metrics | Apple Pay | Google Pay |
| Sites in Top 1k | 105 | 74 |
| Top 10k | 630 | 471 |
| Top 100k | 4,316 | 3,495 |
| Top 1 million | 38,518 | 39,695 |
| Entire Internet | 2,169,711 | 1,813,130 |
Usage Frequency Statistics
- Apple Pay was used several times a day by 17% of users, while 12% used it about once a day. A share of 22% reported usage a few times a week, 15% used it about once a week, and 34% used it about once a month or less.
- Google Pay was used several times a day by 14% of users, while 12% used it about once a day. A share of 20% reported usage a few times a week, 15% used it about once a week, and 41% used it about once a month or less.
| Types | Several times a day | About once a day | A few times a week | About once a week | About once a month or less |
| Apple Pay | 17% | 12% | 22% | 15% | 34% |
| Google Pay | 14% | 12% | 20% | 15% | 41% |
Countrywise Adoption Statistics
- Apple Pay operates in more than 70 countries, recently adding Colombia and Bahrain, while Google Pay’s biggest market is India, where it handles USD 610 billion in value, up 22% year-on-year.
- Apple Pay transactions come from 45% in North America, 30% in Europe, and 20% in Asia-Pacific; Google Pay accounts for 43% of its volume in North America and 21% in Europe, driven by partnerships with the UK, Germany, and France.
- Apple Pay usage in India and Brazil climbed 35%; Google Pay adoption surged 46% in Southeast Asia (Indonesia, Thailand, Vietnam) and 39% in Latin America, led by Brazil and Mexico.
- Apple Pay supports cross-border spending in 50+ currencies; Google Pay volumes rose 18% in Africa and the Middle East through fintech uptake and 24% in Australia across transit, retail, and hospitality.
- In the EU, 60% of French iPhone owners and 40% of German iPhone owners use Apple Pay, while Google Pay merchant connections in Japan increased 28%.
- Apple Pay ranks as the top digital wallet in 25 nations, powering 80% of transit fares in China and Singapore; Google Pay broadens its role worldwide as mobile-wallet and fintech adoption rise.
Technological Comparison Statistics
By Apple Pay
- Apple Pay puts strong security first in mobile payments.
- It swaps real card numbers with changing tokens, so shops never see your card.
- Face ID or Touch ID confirms 99% of purchases.
- Fraud stays around 0.01%, much lower than normal cards.
- Lost iPhones can be turned off, setup needs two-factor login, meets PCI DSS rules, and every payment is fully encrypted.
By Google Pay
- Google Pay now supports 65+ currencies through multi-currency wallets.
- In 2025, 72% of users relied on biometrics, and 94% of Android devices supported NFC payments.
- Split bills hit 38% adoption, while AI-based protection stopped USD 1.4 billion in fraud.
- Crypto wallet linking rose 41%, while almost 62% of merchants reported better retention and ROI.
- Offline payments are now available in 12 countries worldwide for everyday purchases.
Global Online Payment Market Statistics
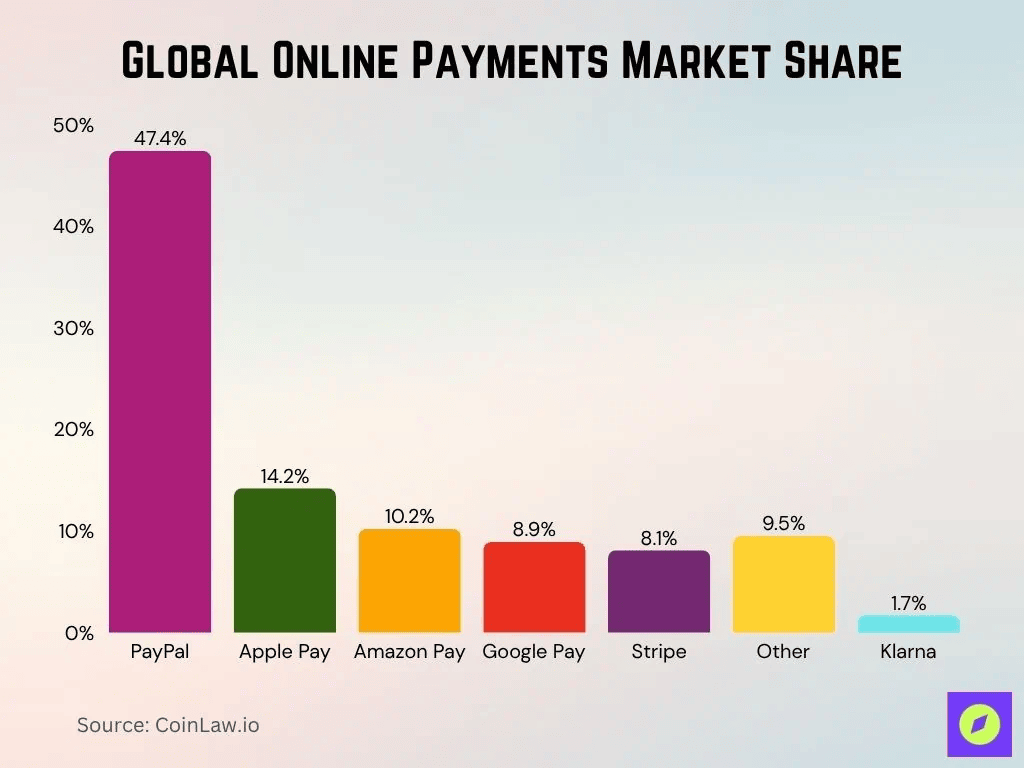
(Source: coinlaw.io)
- As of 2025, among companies that use online payment services, PayPal is first with 47.4% market share, followed by Apple Pay at 14.2%, Amazon Pay at 10.2%, Google Pay at 8.9%, Stripe at 8.1%, and Klarna at 1.7%.
- Meanwhile, all other online payment providers together accounted for 9.5%.
By Customers
- Apple Pay was observed on 6,638,135 websites, with 2,169,711 live implementations and 4,468,424 former users, while 6,309 sites were identified in India, based on data from builtwith.com.
- Google Pay appeared on 5,311,372 domains, with 1,813,130 active users and 3,498,242 former adopters, along with 34,781 sites located in India.
- The United States recorded 1,250,300 Apple Pay users and 1,017,659 Google Pay users, showing strong usage in both ecosystems.
- The United Kingdom registered 109,314 Apple Pay users against 118,516 Google Pay users, reflecting close adoption levels.
- Germany showed 85,579 Apple Pay users and 83,835 Google Pay users, indicating similar utilization across both platforms.
- Australia demonstrated 77,640 Apple Pay users and 77,642 Google Pay users, reflecting nearly identical adoption patterns.
- Canada reached 50,358 Apple Pay users compared with 47,308 Google Pay users, showing slightly higher activity for Apple Pay.
- France reported 43,462 Apple Pay users and 15,101 Google Pay users, indicating wider preference for Apple Pay.
- The Netherlands recorded 27,264 Apple Pay users and 24,797 Google Pay users, showing higher traction for Apple Pay.
- Italy showed 26,893 Apple Pay users and 28,261 Google Pay users, where Google Pay maintained a minor lead.
- Russia reported 20,043 Apple Pay users and 3,150 Google Pay users, indicating dominant adoption of Apple Pay in the market
Countries using Apple Pay and Google Pay by number of users (as of October 2025) are mentioned in the table below:
| Country | Apple Pay | Google Pay |
| United States | 1,250,300 | 1,017,659 |
| United Kingdom | 109,314 | 118,516 |
| Germany | 85,579 | 83,835 |
| Australia | 77,640 | 77,642 |
| Canada | 50,358 | 47,308 |
| France | 43,462 | 15,101 |
| Netherlands | 27,264 | 24,797 |
| Italy | 26,893 | 28,261 |
| Russia | 20,043 | 3,150 |
By Availability and Compatibility
| Metrics | Apple Pay | Google Pay |
| Device coverage | Works on iPhone 8+ and all Apple Watches, reaching 97% of active iOS devices. | Compatible with 93% of Android phones and 100% of Wear OS watches. |
| Global availability | Payments are supported in 81 countries. | Payments are available in 76 countries. |
| App & online reach | In-app/web payments enabled for 1.2 million+ U.S. apps and retailers. | Native apps on three major platforms: ChromeOS, Windows, and Wear OS. |
| Cards & passes support | Up to 12 cards, plus transit passes and digital IDs in selected U.S. states. | Multiple cards plus accounts; supports 65+ currencies in multi-currency wallets. |
| Language & NFC features | Tap-to-pay across NFC-enabled Apple devices worldwide. | NFC interactions are available in 18 languages, and NFC payments are supported on 94% of Android devices. |
| Integration | Linked with CarPlay, enabling fuel payments via voice or touchscreen. | The offline payment mode is available in 12 countries and has strong links to transit, retail, and hospitality. |
| Peer payments & bill split | Apple Cash supports person-to-person transfers in eligible regions. | Bill-splitting and P2P across Google Workspace contacts; 58% of users use it monthly. |
| Security authentication add-ons | Face ID / Touch ID used in 99% of payments; setup requires 2FA; fraud around 0.01%. | Adds Visa Secure and Mastercard ID Check, boosting authentication success by 31%; 72% of users use biometrics. |
By Transaction Limits
- Apple Pay’s Apple Cash P2P in the U.S. allows USD 10,000 in total across any rolling 7-day period, with a USD 10,000 per-message limit for standard users and USD 2,000 for Apple Cash Family.
- For Apple Cash balance and bank transfers, users can hold up to USD 20,000 after ID verification and move up to USD 20,000 to a bank every 7 days, capped at USD 10,000 per transfer.
- Tap to Cash on Apple Pay is a smaller scale, limited to USD 2,000 total in a rolling 7-day window and effectively USD 2,000 per period.
- Regular Apple Pay in-store and online card payments have no Apple-set daily ceiling; the card issuer controls spending and can exceed typical contactless thresholds (roughly USD 58 equivalents).
- In the U.S., Google Pay balance payments are capped at USD 2,500 per day, with a maximum of 15 transactions per day and a maximum of USD 2,000 per transaction.
- Google Pay cross-border transfers from the U.S. allow USD 5,000 per 7-day period for verified users, with a USD 2,000 per transfer limit and a wallet balance ceiling of USD 25,000.
- In India, Google Pay UPI usage roughly equals USD 1,150 per day (converted from the standard cap) and 20 transactions.
- At the same time, high-value categories can reach USD 5,750-USD 11,500 per day, with per-transaction caps of USD 2,300-USD 5,750.
Conclusion
To sum up, both Apple Pay and Google Pay are important in the mobile payment world, but they are strong in different ways. Apple Pay is more common among iPhone users, while Google Pay is more common on Android phones and in some specific countries.
The numbers for users, payments, and market share show that both are still growing. For shops and app makers, offering both options can attract more customers. As digital payments grow, these services will continue to improve and compete.
FAQ.
Apple Pay works only on Apple devices, while Google Pay mainly runs on Android phones and other Google-supported platforms worldwide.
Both are secure; safety depends more on your device settings than on the payment app.
Yes, both support online and in-app payments on many websites, apps, and digital services today.
Usually, there are no extra user fees; instead, normal bank or card charges still apply.
Acceptance varies by region, but generally both work wherever merchants support contactless cards.

Maitrayee Dey has a background in Electrical Engineering and has worked in various technical roles before transitioning to writing. Specializing in technology and Artificial Intelligence, she has served as an Academic Research Analyst and Freelance Writer, particularly focusing on education and healthcare in Australia. Maitrayee's lifelong passions for writing and painting led her to pursue a full-time writing career. She is also the creator of a cooking YouTube channel, where she shares her culinary adventures. At Smartphone Thoughts, Maitrayee brings her expertise in technology to provide in-depth smartphone reviews and app-related statistics, making complex topics easy to understand for all readers.