Average Conversion Rate Benchmark Statistics By Industry, Ad Type, Region And Category (2025)
Updated · Jul 22, 2025

Table of Contents
- Introduction
- Editor’s Choice
- Average Conversion Rate By Industry
- E-commerce Conversion Rate By Channel
- Average Conversion Rate By Ad Type
- Average E-commerce Conversion Rate
- Average Conversion Rate By Region
- Average E-commerce Conversion Rate By Platform
- Average Conversion Rate By Category
- Average Website Conversion Rate For Financial Services Websites
- SaaS Conversion Rate Benchmarks
- How To Increase Conversion Rates?
- Conclusion
Introduction
Average Conversion Rate Benchmark Statistics: Conversion rate is one of the vital performance metrics in the digital marketing arena. It denotes the number of people visiting the site and doing the desired action, whether it is making a purchase, subscribing to the newsletter, or filling out a particular form.
By knowing the average conversion rate benchmarks for 2024, a business can gauge its performance and adjust its strategy accordingly. Irrespective of whether it is an online store, SaaS business, or B2B service, this article shall present all the recent industry information regarding average conversion rate benchmark alongside sector-specific benchmarks and ways to bolster conversion rates.
Editor’s Choice
- Legal Services, Hotels & Resorts, and Healthcare stand tall in the average conversion rates at 3.8%, 3.6%, and 3.1%, respectively.
- The Entertainment and Staffing & Recruiting sectors come in at a close 2.9%, followed by Higher Education and HVAC Services at 2.8%.
- Software Development and B2B SaaS sit firmly at the bottom with a rate of 1.1% and 1.2% respectively, emphasising agony within longer decision cycles and complex funnels.
- The rest are considered low performers, including Engineering (1.2%), IT & Managed Services (1.5%), and Medical Devices (1.5%).
- On average, the conversion rate for e-commerce stands at 2.2%, while some industries, such as Food & Beverage, Oil & Gas, and Industrial IoT, have a slight superiority at 2.6%.
- Construction, Pharmaceutical, and Biotech observe a mid-tier level at around 1.8%–1.9%. Real Estate and Manufacturing maintain an average spectrum of 2.1%–2.2%, with Addiction Treatment standing at 2.1%.
- On the other hand, Luxury sectors with Luxury Goods, and Transportation & Logistics have comparatively lower conversion rates of 1.4%.
Average Conversion Rate By Industry
(Reference: firstpagesage.com)
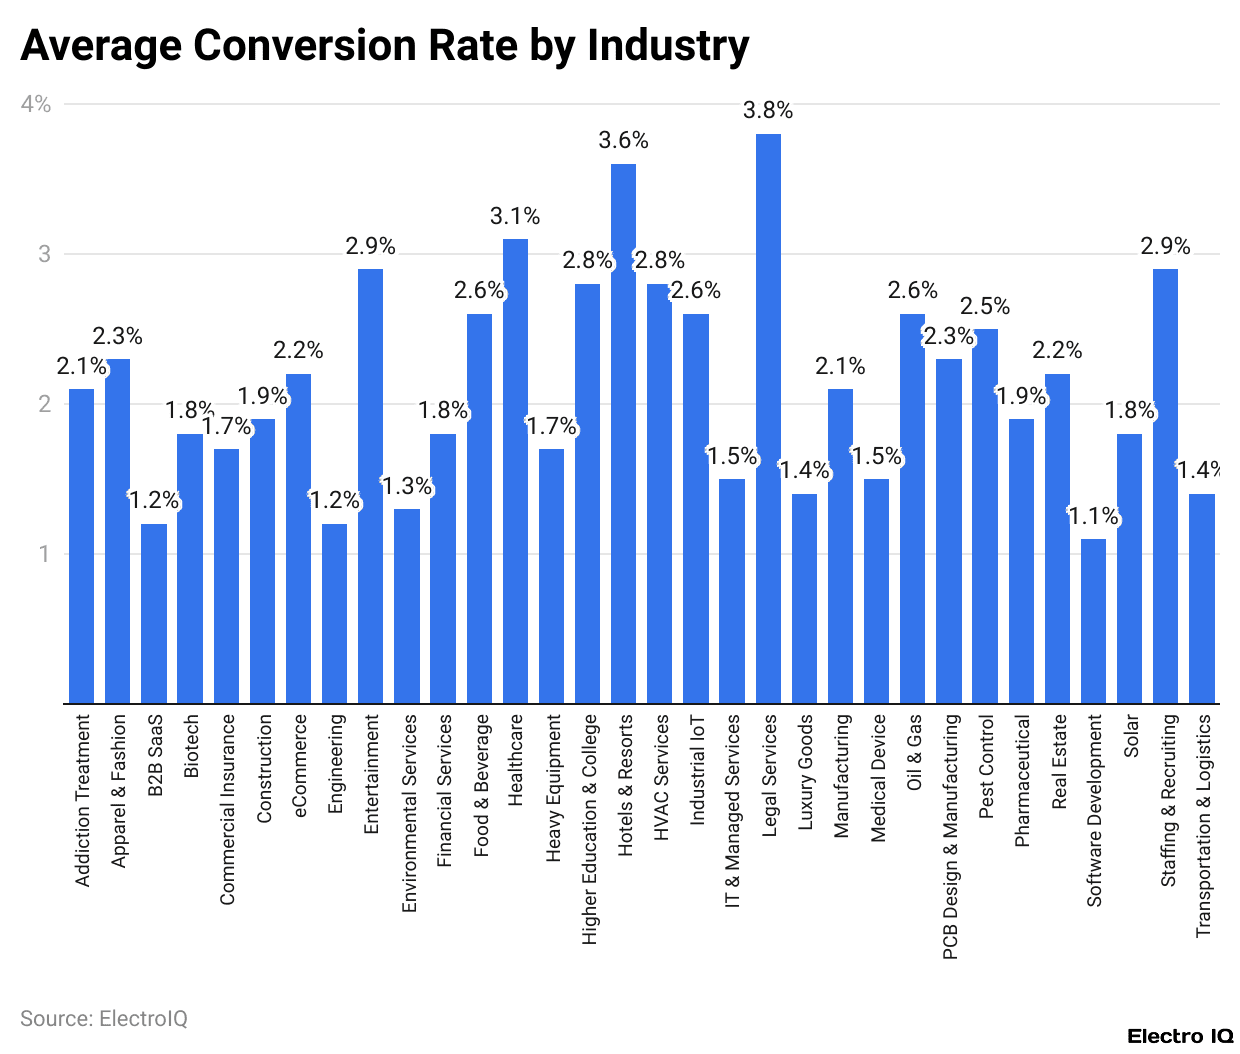
- As per Firstpagesage, the data presented above is the average conversion rate benchmark of different industries in the year 2024, providing a gauge with which any business can measure its success versus industry benchmarks.
- At the upper side of the scale are Legal Services (3.8%), Hotels & Resorts (3.6%), and Healthcare (3.1%), reflecting excellent lead or sale conversions in these areas.
- Other industries that still do well are Entertainment and Staffing & Recruiting, each with a conversion rate of 2.9%, compared with Higher Education and HVAC Services, which fall slightly below with 2.8%.
- Software Development and B2B SaaS lag with some of the lowest conversion rates, at 1.1% and 1.2%, respectively. But with the longitudinal decision-making cycles arise complicated sales funnel structures often associated with the very industries.
- Some other technical sectors like Engineering (1.2%), IT & Managed Services (1.5%), and Medical Device (1.5%) also witness a lower average conversion. While the eCommerce sector at 2.2% conforms to industry standards, sectors like Food & Beverage (2.6%), Oil & Gas (2.6%), and Industrial IoT (2.6%) average slightly higher.
- Mid-range industries like Construction (1.9%), Pharmaceutical (1.9%), and Biotech (1.8%) indicate moderate conversion performance.
- Likewise, Addiction Treatment (2.1%), Manufacturing (2.1%), and Real Estate (2.2%) stand above the crucial 2% mark. Luxury-oriented industries such as Luxury Goods (1.4%) and Transportation & Logistics (1.4%) rank relatively avariciously, possibly owing to their exorbitant pricing or the greater time consumed for the purchase itself.
- Broadly, this data goes on to show how conversion rates may drastically change depending on the industry, influenced by factors such as sales complexity, consumer trust, purchase intent, and lead nurturing cycles.
E-commerce Conversion Rate By Channel
- Among the social media sites, Facebook stands out with an astounding average conversion rate of 9.21%, varying across industries. This implies that, to a certain extent, conversion from engaged users to purchasers is especially effective on Facebook.
- While conversions vary on Facebook, an example of such variance is industries such as the fitness industry, with very high conversion rates up to 14.29%, whereas a much more niche and technical sector like industrial services might only reach a level of about 0.71%.
- Instagram boasts the concept of visibility and engagement for brands but holds on to an average conversion rate of about 1%, opines Bazaarvoice; meaning for every 100 instances recorded as engagements of a brand on Instagram, only one of those engagements ends with a purchase or other action, making it more of a platform for discovery and building awareness than for immediate sales.
- Pinterest, which is also often used for product inspiration and planning, has an average conversion rate of 1.16%.
- The platform’s strong visual format allows product browsing, but its impact is usually somewhat more in the earlier stages of the customer journey rather than direct conversions.
- Accordingly, while Facebook heads the list of platforms with the most conversion-efficient ads, Instagram and Pinterest take key roles in product discovery and brand engagement.
Average Conversion Rate By Ad Type
| Types |
Average Conversion Rate
|
| Search Ads | 3.35% |
| Display Ads | 0.55% |
| Video Ads | 4.80% |
| Social Media | 0.71% |
| Organic | 16.00% |
| Paid | 2.50% |
(Source: businessdasher.com)
- According to Businessdasher, the given data outlines the average conversion rate benchmark performances for different types of ads and traffic sources.
- Video advertisements have one of the highest conversion rates of 4.8%, signifying that engaging visual product-based content truly turns viewers into customers.
- Search ads- ads on Google, for example- follow closely, with an average conversion rate of 3.35%, denoting good performance from a purely intent perspective, would-be buyers are already searching for particular products or services.
- Display ads, which include banner advertisements on websites, have much lower conversion rates at 0.55%. They are often considered passive and less targeted, which possibly may account for their poor showing.
- Social media ads also have a relatively low average conversion rate of 0.71%, the figures for which could differ depending on the platform used and the quality of the campaign.
- When discussing other major traffic categories, organic traffic has abnormally high conversion rates, averaging a 16% conversion rate. This is presumed to be because website visitors coming from an organic search are highly motivated and tend to act.
- Paid acquisition traffic, on the other hand, conversion-wise, averages about 2.5%, lower than organic conversion, but promising conversions when targeted well. This acts in comparison to stress the long-term value of investing in quality organic content in line with paid campaigns.
Average E-commerce Conversion Rate
(Reference: oberlo.com)
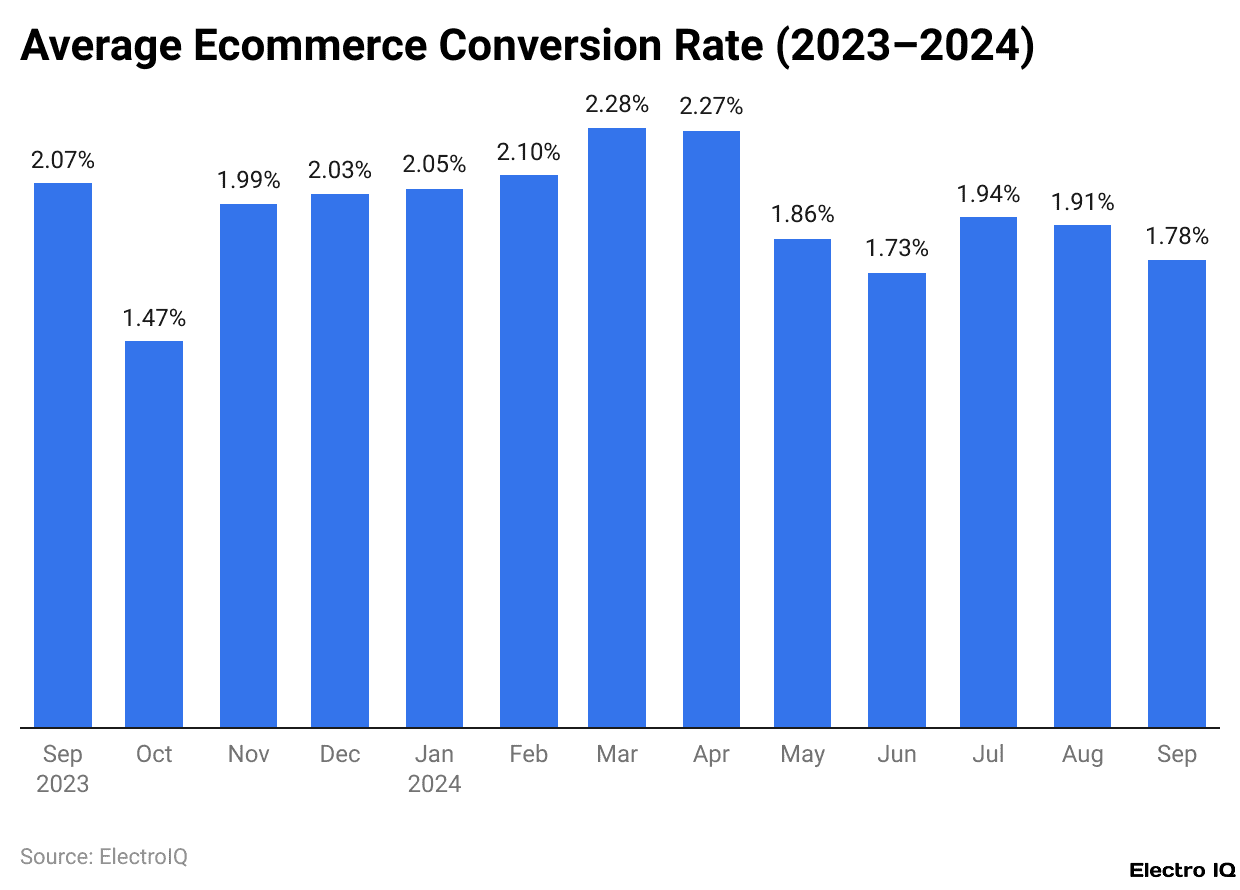
- According to data from September 2024, eCommerce businesses registered an average conversion rate of 1.58%, representing a fall of 0.07 percentage points from the previous month and 0.47 percentage points from the same time last year.
- Though the conversion rates have lowered, an increment has occurred in average order values on a year-to-year comparison. This 1.58% is the lowest in the last 12 months and marks the third consecutive month of declining conversion rates.
- A conversion rate peaks at 2.27% in November 2023, the highest within the past twelve months, a seasonal spike driven mainly by holiday shopping, which is among the busiest periods for online retailers.
Average Conversion Rate By Region
| Region / Country |
Average Conversion Rate Benchmark
|
| United States | 2.06% |
| United Kingdom | 4.10% |
| Europe (Overall) | 2.58% |
| Asia-Pacific | 0.5% – 2% |
(Source: aureatelabs.com)
- The U.S., with an average conversion rate of 2.06%, is considered the most mature digital market where consumers hold trust in such platforms.
- In contrast, the UK stands with a conversion rate of 4.1%, further supported by a well-established e-commerce environment and consumer confidence in performing such purchases online.
- Conversion rates across Europe average at 2.58%, though it may vary by country depending on factors such as the economy, internet usage, and local-standing e-commerce infrastructure.
- Conversion rates in Asia-Pacific are on the lower side, ranging from 0.5% to 2%.
- The wide range of conversion rates can be attributed to variations in digital adoption rate, consumer behaviours, regional disparities in internet access, and logistics infrastructure.
Average E-commerce Conversion Rate By Platform
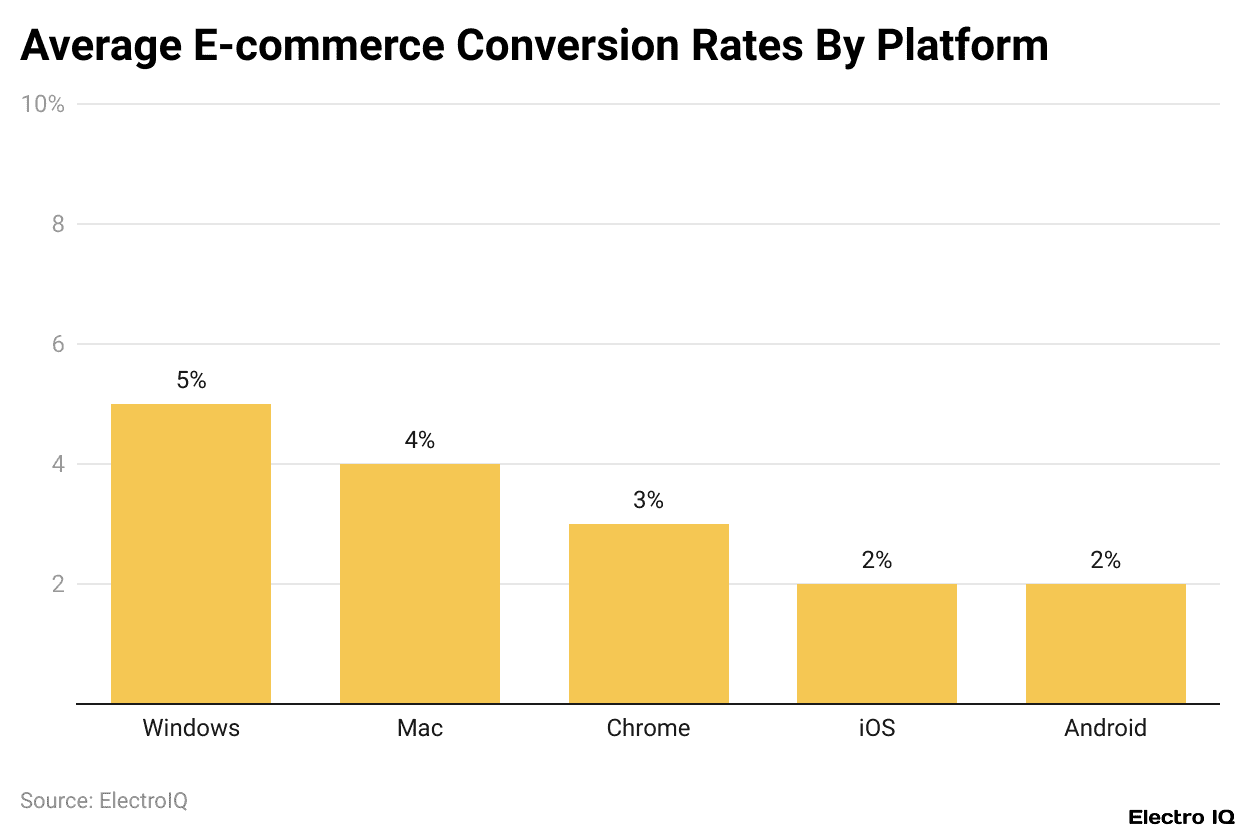
(Reference: tidio.com)
- Windows is a leader when it comes to conversion performance, with an estimated average rate of 5%, i.e., the highest rate of channelling site visitors into buyers.
- Mac users seem to possess a decent level of engagement as well, having a conversion rate of 4%. Chrome shows a marginally lesser performance of 3%, whereas iOS and Android perform below it, at 2% conversion rates.
- The least performing Windows Phone and Linux stand on the lower scale, having conversion rate values lying a little above 0%, revealing almost no buying action undertaken by users on these platforms.
Average Conversion Rate By Category
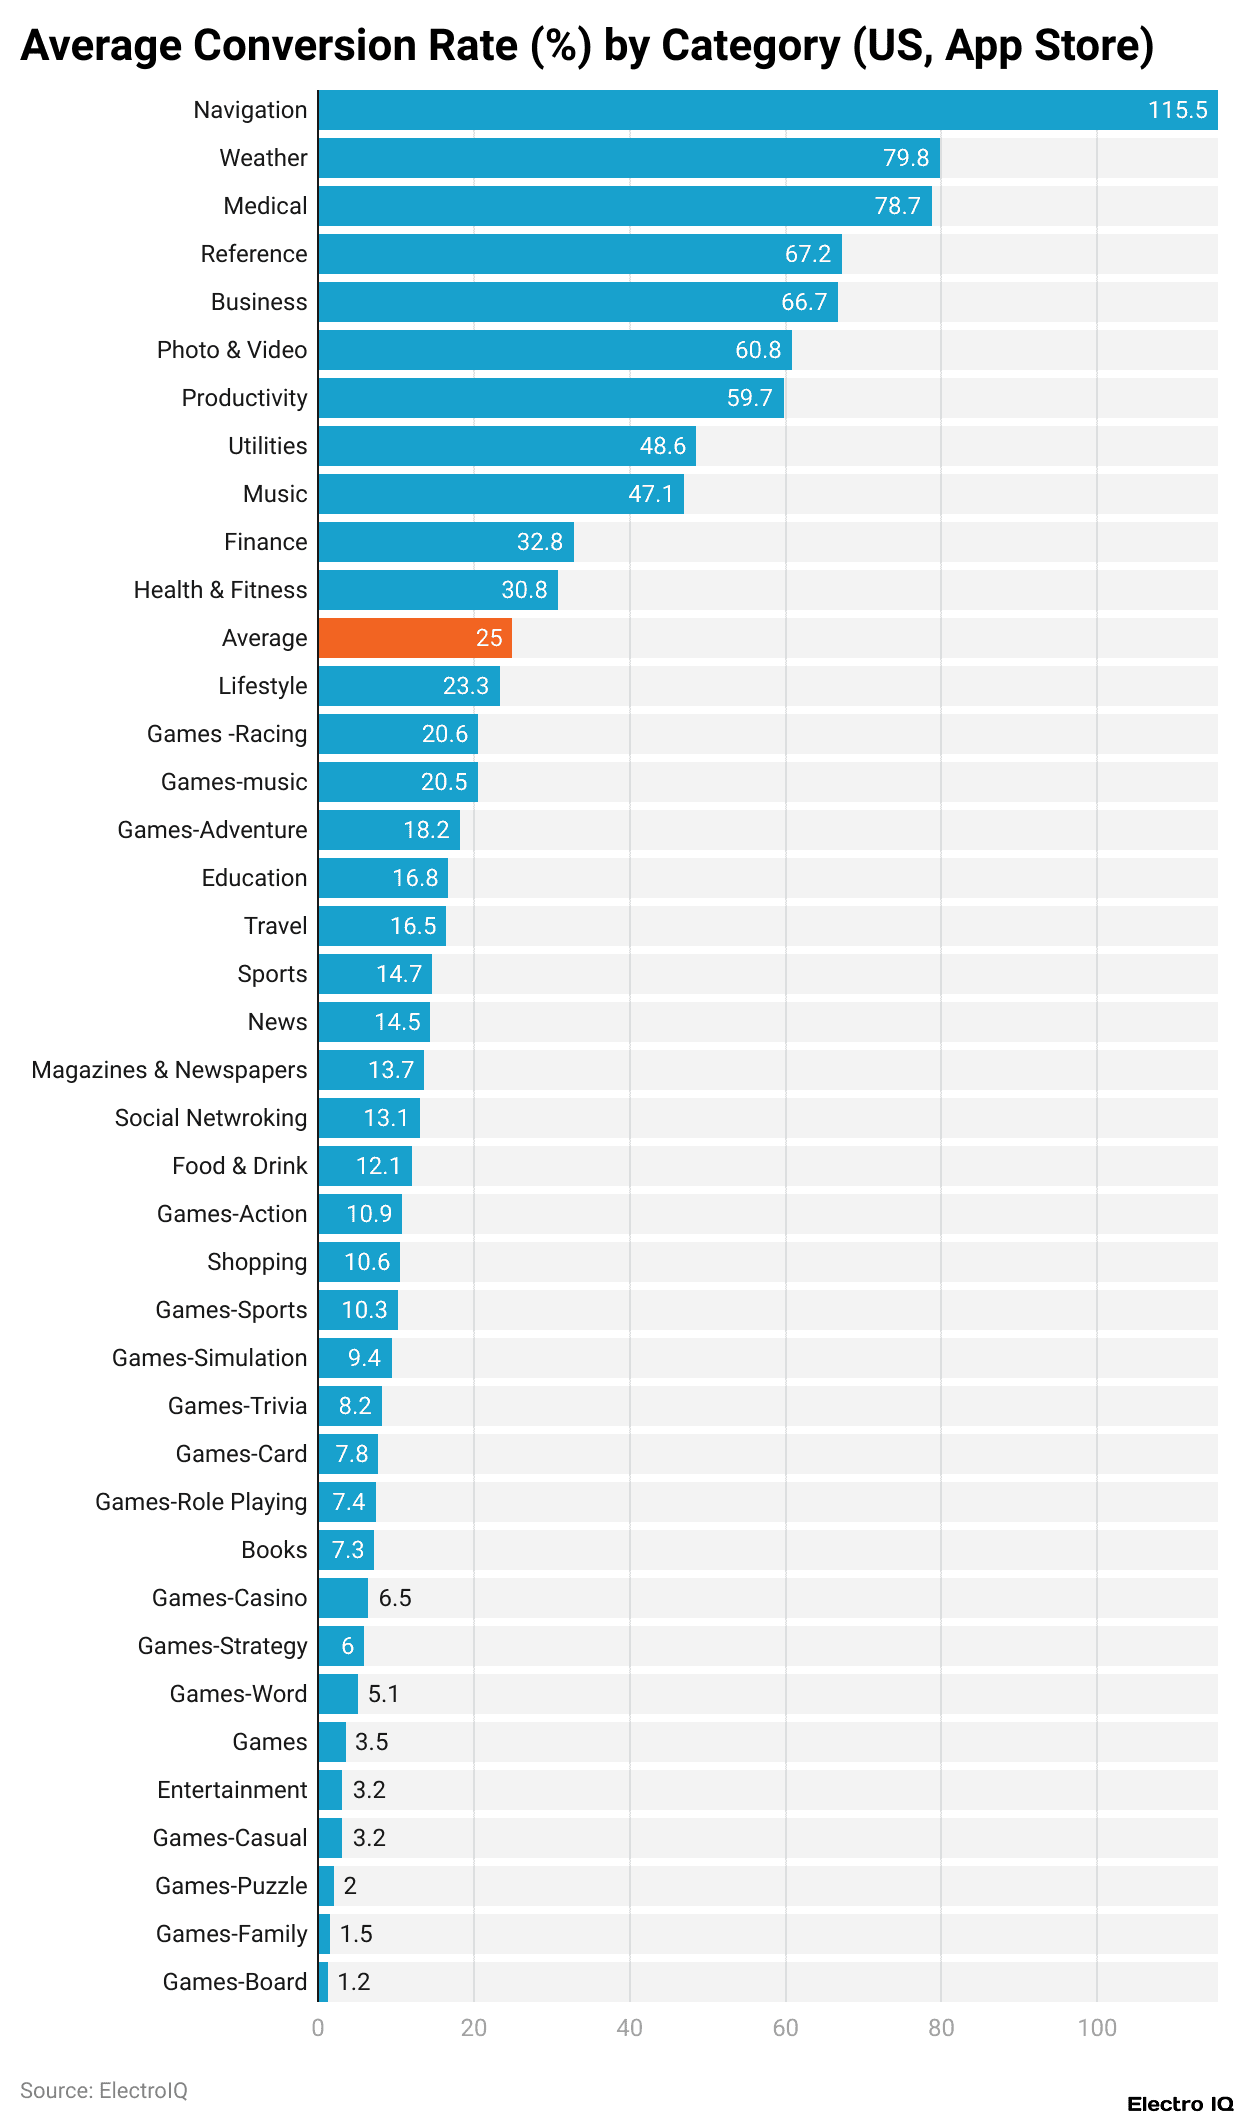
(Reference: apptweak.com)
- In the U.S. App Store’s first half of 2024, the average app conversion rate was 25%, though this figure fluctuated massively between app profiles.
- Some categories performed so well that the Navigation category had an average conversion rate that hit an unbelievably high 115.5%, perhaps due to users going almost immediately to download after viewing an app, maybe from search or direct linking.
- Games — Board witnessed the lowest average conversion rate of just 1.2%, implying lower immediate motivation or higher competition on that front.
- These drastic variations suggest that while the overall average is beneficial, more refined insights come from the category-specific trends.
Average Website Conversion Rate For Financial Services Websites
- According to Unbounce, having a median website conversion rate of 8.3% describes the financial services.
- Wide differences are observed in results from different subcategories. Insurance websites have it all: conversions of 18.2%, which is 119% higher than the average across the sector.
- On the heels of insurance are credit and lending websites, performing steadily and consistently at 8.8%. Investment sites are the sore point, with only 3.9% conversion, marking an area that could need attention to user experience or messaging.
- The report also pushes for simplicity of content. Pages written at the 5th-to-7th-grade level of reading get to the top in terms of conversions, reaching conversion rates as high as 18.1%. This means that simple content is best for engagement and user action.
- Financial services saw particularly good mobile conversion with an average of 11.5%, outperforming desktop at 9% and also broader mobile across industries at a median of 11.2%.
- Quite different from many other industries, financial services see mobile traffic converting better than desktops.
- In that instance, desktop strikes below the all-industry 12.1% median, implying a need for businesses to enhance the desktop experience to stay competitive.
SaaS Conversion Rate Benchmarks
- SaaS conversion rate benchmarks differ according to the source of traffic and the type of conversion funnel being analysed.
- From visitors to free trials (opt-in), organic conversion is the slight winner, with 8.5%, compared to paid traffic at 7.1%.
- Once the user has basically moved down the funnel from opting into a free trial to finally signing up for the paid plan, organic leads enjoy a conversion rate of 18.2% with paid lead conversions just trailing at 17.4%.
- Industry expert-conversion rates from visitors to free trials, in the case of opting out for a free trial, are lower (2.5% for organic and 2.2% for paid), but they have a much higher conversion rate from users to paid accounts: 48.8% for organic and 51% for paid, saying the option-out model is better at bringing in paying customers after the users have been in the funnel.
- For the freemium model, users start with a free plan for life. For organic conversion, the paid traffic conversion rate itself stands out better than organic.
- Visiting freemium stands at 13.3% for organic and 15.9% for paid. Conversion from freemium to paid is more challenging and lower. It is 2.6% for organic users and 2.8% for paid-source users. This implies that freemium attracts users, but only a few of them get converted to paying customers without strong feature gating or strong upgrade incentives.
How To Increase Conversion Rates?
- Try testing your website systematically, including testing headlines, images, layouts, CTA buttons, forms, and the design itself, to turn more visitors into customers.
- Run A/B tests comparing two versions of content or design to see which performs better.
- Use user behaviour analytics so you know how visitors interact with your site and where they fall off.
- Set up live chat tools to drive engagement and provide instant support to visitors.
- Use data as the foundation for making changes that optimise the user experience toward better conversion outcomes.
- Test variation in call-to-action placement, style, and wording to see which gets the most clicks.
- Add testimonial reviews to provide social proof, build trust, and reinforce positive brand perception.
- Buyers hate paying for shipping. So, use free shipping as an incentive for conversion and brand loyalty.
- Use eye-catching, high-quality product images to assist decision-making and elevate the shopping experience.
- Add tutorials to product pages so your users know what you sell and how it may solve their problem.
- Try several payment choices to meet a wide range of customer preferences.
- Give a guest checkout option to reduce friction in the buying process and to avoid stumbling at account creation.
- Copywriting can be improved if kept short, persuasive, and customer-benefit-oriented.
Conclusion
Average Conversion Rate Benchmark Statistics: Conversion rates are the yardstick by which marketing success is measured. The average conversion rate for websites in 2024 is 3.68%, but most top-notch websites strive for 5% or more by optimising landing pages, mobile UX, and quality traffic targeting. Comparing performance levels against such industry benchmarks will provide a roadmap to improvement areas and guide strategy for your B2B or B2C business.
Let conversion rates go steadily upward through A/B testing, speed optimisation, strong CTA, and personalisation, which will also be equal to an elevation in revenue.
FAQ.
As of 2024, the average website conversion rate in an industry may hover around 3.68%, with performance considerably varying according to sector, channel, and strategy. Better sites would shoot past the 5% threshold with optimisation in user experience, content, or method of targeting. Setting the benchmark of just where your businesses stand would be helpful for identifying growth opportunities.
In 2024, Legal Services (3.8%), Hotels & Resorts (3.6%), and Healthcare (3.1%) command the highest conversion rates, found to be largely capable of lead generation and efficiency in decision-making. Always nearby, the likes of Software Development (1.1%), B2B SaaS (1.2%), and Luxury Goods (1.4%) find themselves constrained with lengthy sales cycles or very specific targeting.
Leading in conversion rates, video ads attain 4.8%, followed by search ads with 3.35%, underscoring the effectiveness of engaging content and high-intent traffic. Display and social media ads, meanwhile, trail behind at 0.55% and 0.71% conversion rates, respectively.
By 2024, conversion rates will vary among regions: the UK (4.1%), the US (2.06%), and the whole of Europe (2.58%). Asia-Pacific entertains a broad range, anywhere between 0.5% and 2%. By platform, Windows users are the top converters at 5%, followed by Mac users at 4%, Android, and iOS at 2% each, with almost no conversion on Linux and Windows Phone.
SaaS conversion benchmarks are very well nuanced. Organic traffic converts trial-to-paid at 18.2%, closely followed by paid at 17.4%. Opt-out conversions paid the highest, i.e., 51% paid conversion. Financial services exhibit a median conversion rate of about 8.3%; among sites, insurance sites fare best, with 18.2%. Mobile channels perform better, converting at 11.5%, than desktop.

Barry Elad is a passionate technology and finance journalist who loves diving deep into various technology and finance topics. He gathers important statistics and facts to help others understand the tech and finance world better. With a keen interest in software, Barry writes about its benefits and how it can improve our daily lives. In his spare time, he enjoys experimenting with healthy recipes, practicing yoga, meditating, or taking nature walks with his child. Barry’s goal is to make complex tech and finance information easy and accessible for everyone.