Digital Marketing Statistics By Insights, Trends And Facts (2025)
Updated · Dec 15, 2025

Table of Contents
- Introduction
- Editor’s Choice
- Market Analysis of Digital Marketing Statistics
- Digital Advertising Spending Market Statistics
- By Region
- Channels Used in Digital Marketing Statistics
- Social Media Marketing Statistics
- Mobile Marketing Trends
- Video Marketing Statistics
- Email Marketing Statistics
- SEO Statistics
- Content Marketing Statistics
- Influencer Marketing Statistics
- Website Statistics
- B2B and B2C Marketing Statistics
- Paid Search and PPC Statistics
- Local Digital Marketing Statistics
- Blogging Statistics
- Use of Artificial Intelligence (AI) In Content Marketing Statistics
- Conclusion
Introduction
Digital marketing Statistics: Digital marketing is a process used by global businesses that allows promoting products and services using the internet and digital devices. This is an important component of marketing in almost every business, which allows them to reach their customers. This marketing segment basically includes computers, smartphones, social media, other online platforms, emails, search engines, and mobile apps. Digital marketing helps brands to grow enormously and globally by connecting with the right audience at the right time.
This article explores all current trends of digital marketing from different insights that will guide you in understanding the topic effectively. Digital Marketing Statistics mainly cover the overall spending, social media marketing, mobile marketing, email marketing, SEO & content marketing, influencer marketing, B2B vs. B2C marketing stats, and many other factors.
Editor’s Choice
- According to Hostinger’s report analysis, the market size of digital marketing is expected to be worth USD 472.5 billion in 2025.
- Precedence Research also estimated that as of 2025, the global market size of digital ad spending is estimated to reach up to USD 650 billion.
- As per scoop.market.us, the top three used channels in digital marketing are social media, used by 82% of marketers, followed by websites (80%), and email marketing (63%).
- As of 2025, approximately 86% of marketers say they use Facebook for marketing, while 79% use Instagram, and 65% also include LinkedIn in their strategy.
- Today’s FinTech News also shows that global spending on mobile ads is expected to reach USD 540 billion in 2025.
- Digital marketing teams focus on video content, with 47% using product demos, followed by explainers (35%) and webinars (33%).
- By the end of 2025, the total number of emails sent per day will reach 376.4 billion, according to Shopify.com.
- According to SQ Magazine reports of 2025, businesses around the world are expected to spend about USD 127.5 billion on SEO services.
- The DigitalSilk report also depicts that around 83% of marketers believe content marketing works best for creating demand, while 63% say it helps them keep customers loyal and engaged over time.
- Amra and Elma’s report of 2025 represents that the global market size of influencer marketing will reach around USD 32.55 billion, increased from USD 24 billion in 2024.
- As per the reports of Seoprofy, there are approximately 1.2 billion websites in the world today, but only 17% of them are active, and the remaining 83% are not being used.
- Sellers Commerce analysis of 2025 shows that the global market size of B2B e-commerce is expected to reach around USD 32.11 trillion.
- According to the Keevee report analysis by 2025, the global B2C e-commerce is expected to hit USD 6.4 trillion.
- The Media Valet report further shows that globally, there are more than 600 million blogs, representing 1.9 billion websites on the internet.
Market Analysis of Digital Marketing Statistics
 (Source: hostinger.com)
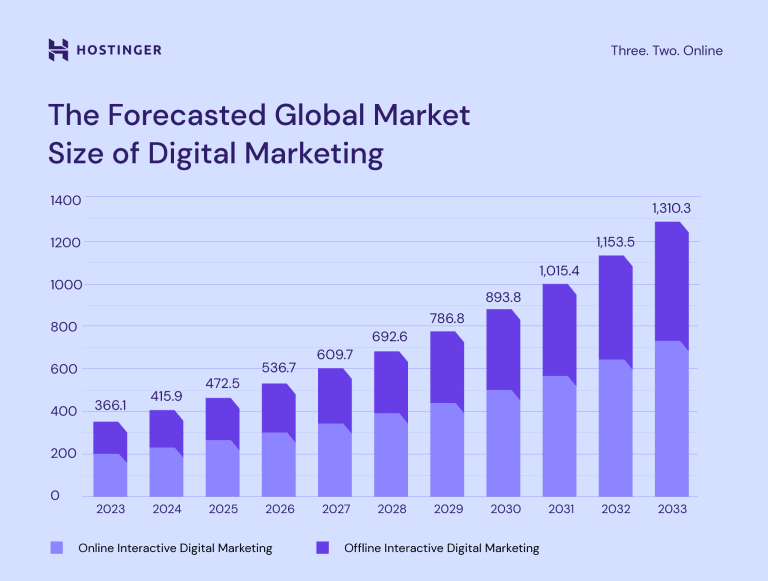
- The above graphical analyses state that the market size of digital marketing is expected to be worth USD 472.5 billion in 2025 and is likely to grow steadily at 13.6% every year until 2033, resulting in USD 1.3 trillion.
- In the coming years, the global market size of digital marketing is expected to reach USD 536.7 billion (2026), USD 609.7 billion (2027), USD 692.6 billion (2028), USD 786.8 billion (2029), USD 893.8 billion (2030), USD 1,015.4 billion (2031), USD 1,153.5 billion (2032).
- North American and European companies allocated 7.7% of their total revenue to marketing in 2024.
- The Hostinger report further states that companies in North America and Europe spend 25.6% of their marketing budget on paid media like PPC ads, video ads, and sponsored social posts.
- Besides, marketing technology tools get 25.4%, while 24.6% goes to labour and 23.3% to agencies.
- 82% of CMOs focused more on digital marketing, but only 59% made changes to offline marketing strategies.
- 47% of digital marketers find data helps most in email marketing, followed by 46% for customer experience and 41% for ads.
Digital Advertising Spending Market Statistics
 (Reference: precedenceresearch.com)
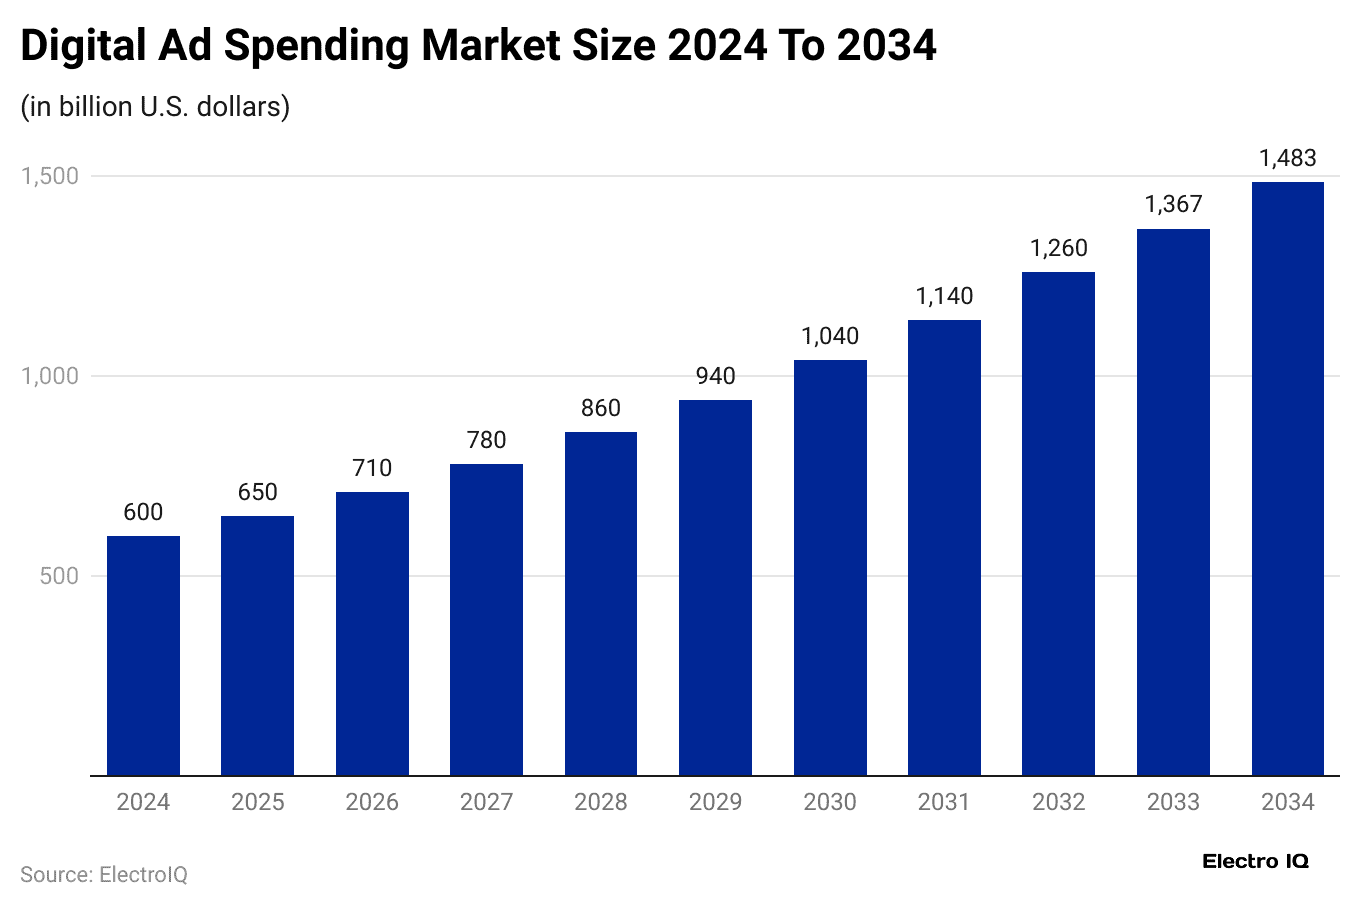
- As of 2025, the global market size of digital ad spending is estimated to reach up to USD 650 billion, an increase from USD 600 billion in 2024.
- The market is expected to exceed around USD 1,483 billion by the end of 2034, growing at a CAGR of 9.47% from 2025 to 2034.
- The estimated market size in the coming years is 2026 (USD 710 billion), 2027 (USD 780 billion), 2028 (USD 860 billion), 2029 (USD 940 billion), 2030 (USD 1,040 billion), 2031 (USD 1,140 billion), 2032 (USD 1,260 billion), 2033 (USD 1,367 billion).
- A report published by Hostinger further states that by 2025, the video advertising market is expected to reach a value of USD 207.5 billion.
- By 2026, search engines may earn USD 357 billion from ads, while Facebook is likely to make USD 203 billion.
By Region
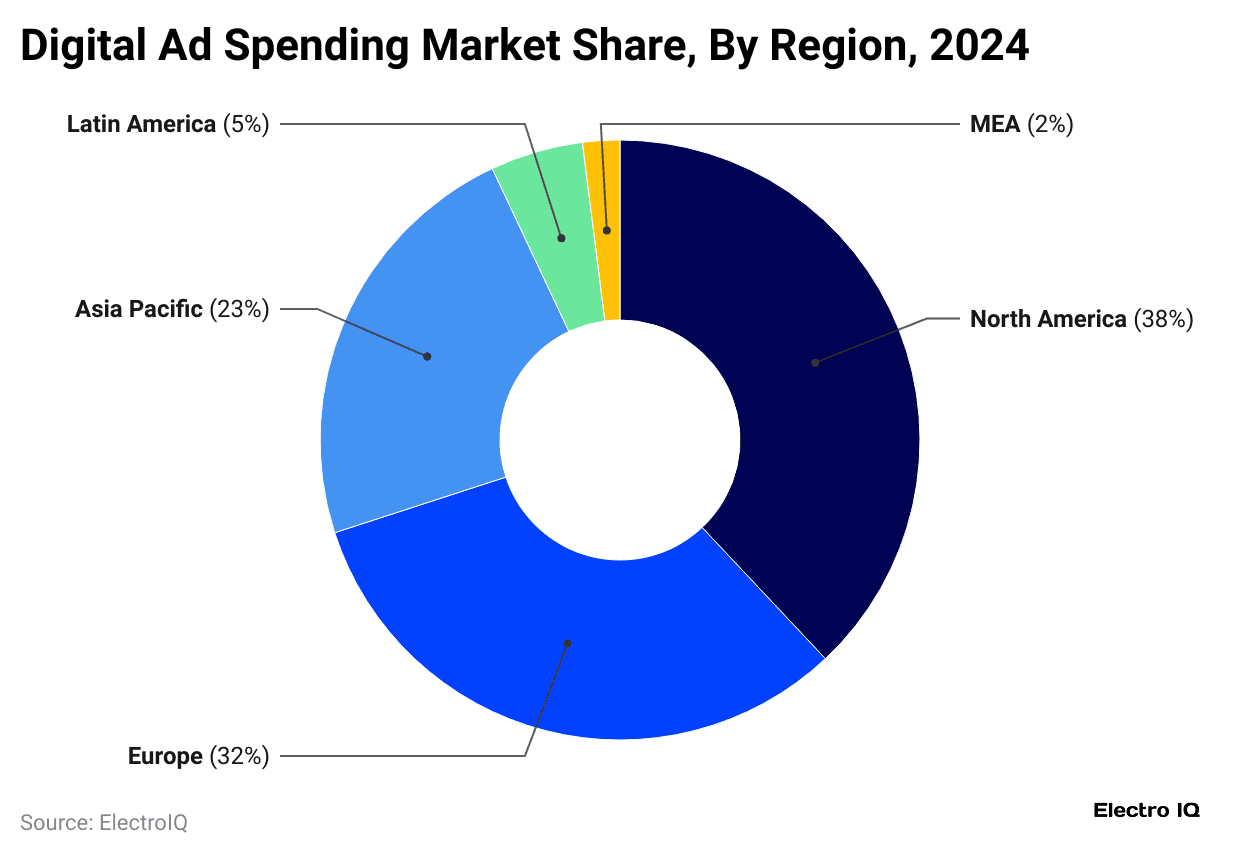
- As of 2024, the North American region captured the highest market share in the digital ad spending, accounting for 38%, followed by Europe (32%).
- Furthermore, other regions’ market shares are stated as Asia Pacific (23%), Latin America (5%), and MEA (2%).
Channels Used in Digital Marketing Statistics
 (Reference: scoop.market.us)
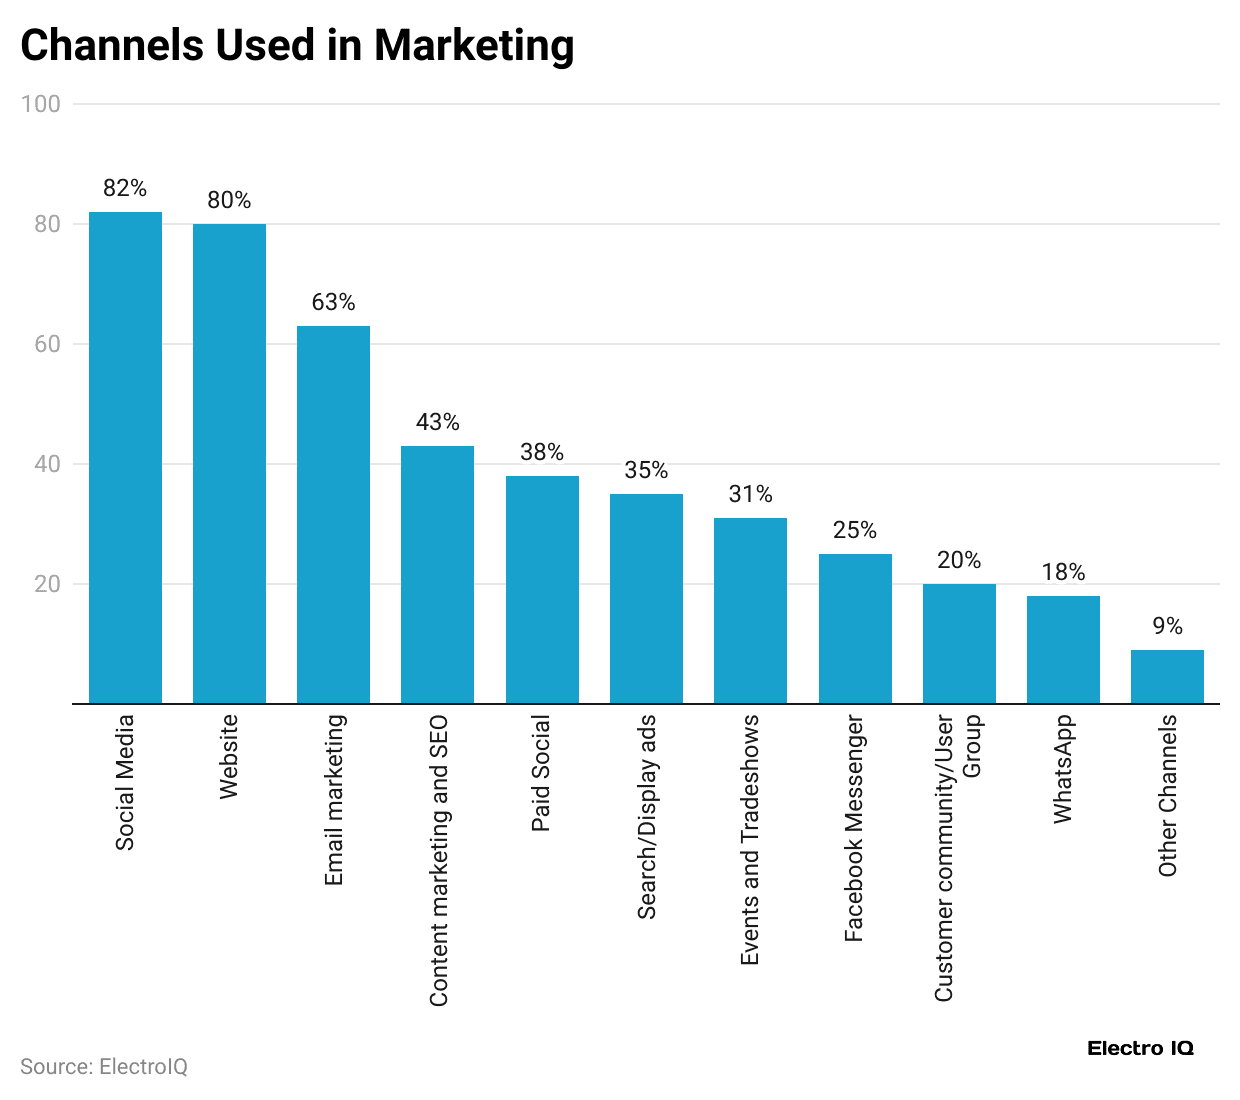
- The above chart shows that the top three used channels in digital marketing are social media, used by 82% of marketers, followed by websites (80%), and email marketing (63%).
- Content marketing and SEO are used by 43%, while paid social and search/display ads are used by 38% and 35% respectively.
- Events and tradeshows are chosen by 31%, and Facebook Messenger is used by 25%.
- Meanwhile, customer communities or user groups and WhatsApp are used by 20% and 18%, respectively.
- Other channels account for 9%, making them the least used in this list.
Social Media Marketing Statistics
- According to the Sprout Blog report analyses, almost 5.42 billion people are expected to use social media by the end of 2025, and each person will use about seven platforms every month.
- By 2030, social media ad spending may hit USD 276.7 billion, with around 83% coming from mobile ads.
- 78% of people enjoy learning about products through short videos, and 93% of marketers plan to use more social media.
- Digital Marketing Statistics also show that by the end of 2025, businesses are expected to spend around USD 276.7 billion on social media ads.
- Ads on platforms like Instagram, Facebook, and TikTok are now the top way for brands to get noticed by people aged 16 to 34.
- From 2025 to 2030, social media ad spending is predicted to grow by about 9.37% each year.
- In recent years, nearly 3 out of every 10 digital ad dollars go to social media, with marketers spending about USD 46.47 per user.
 (Reference: strapiapp.com)
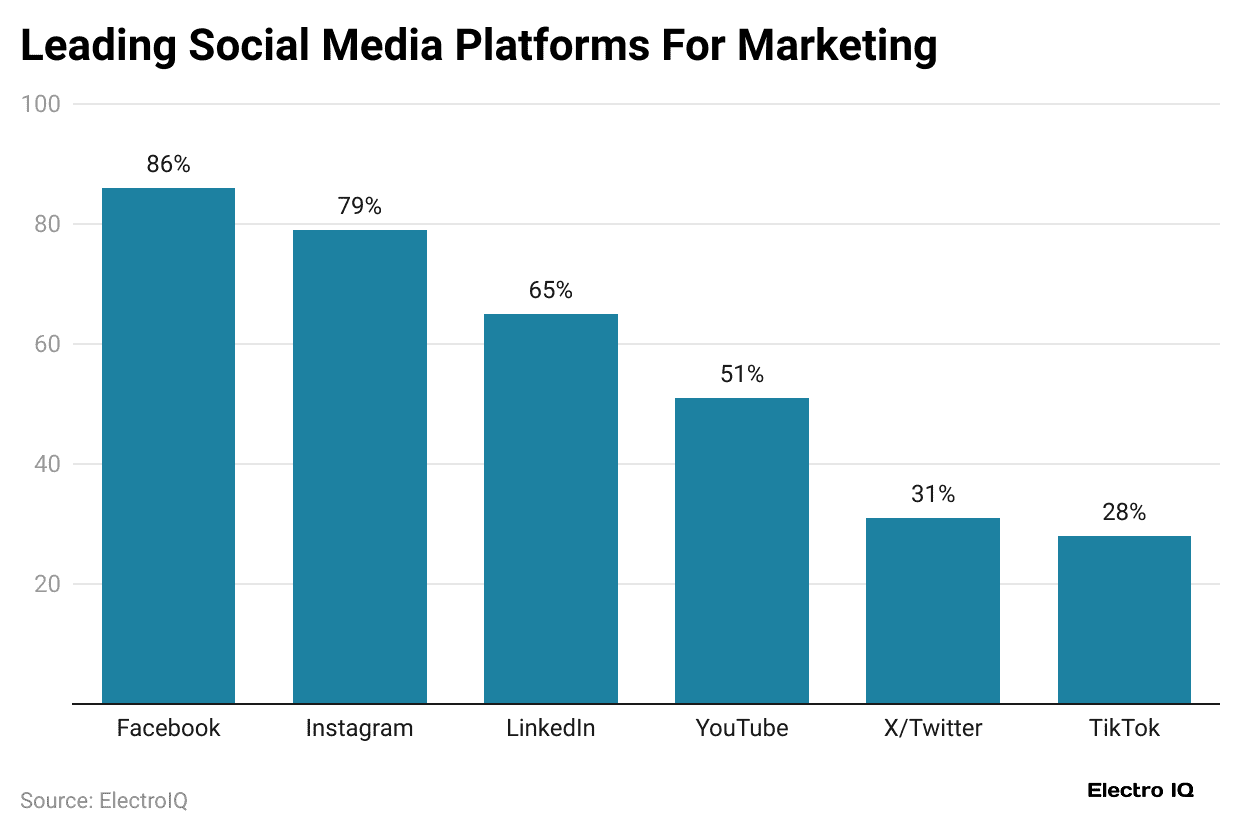
- As of 2025, approximately 86% of marketers say they use Facebook for marketing, while 79% use Instagram, and 65% also include LinkedIn in their strategy.
- Other leading social media platforms for digital marketing include YouTube (51%), X/Twitter (31%), and TikTok (28%).
| Platform | MAUs (billion) | Marketers share | Avg Engagement Rate |
| 2.98 | 86% |
0.5% to 1% |
|
|
|
2.4 | 79% | Almost 1.2% per post (especially carousels & Reels) |
| 1.0 | 65% |
0.67% (long‑form & polls perform best) |
|
|
YouTube |
2.5 to 2.7 | Approx. 62% of U.S. brands are present.
33% of global influencers use it. |
1.6% engagement; long‑form 1.6%, shorts higher |
|
X (Twitter) |
0.55 | 9.9% of influencer campaigns | 0.04% engagement (very low) |
| TikTok | 1.58 to 1.9 | – |
5.4% (highest) or 2.63% (median) |
Mobile Marketing Trends
- Today’s FinTech News also shows that in Q1 2025, 62% of global web traffic comes from mobile devices.
- Global spending on mobile ads is expected to reach USD 540 billion in 2025, representing around 74% of total digital ad spend.
- According to the Vidico report analysis, in the U.S., around 63% of all Google searches are made using mobile phones.
- Around 98.5% of Facebook users use the platform through mobile devices.
- Meanwhile, mobile shopping is expected to account for 72.9% of all online sales in 2025.
- Also, 61% of people say they trust brands more if their websites work well on mobile.
- About 63% of consumers like using their mobile devices to look up information about brands.
- Nearly 37% of shoppers say they’re more likely to buy from brands that use mobile-based Augmented Reality (AR) features.
- In 2025, around 187.5 million people in the U.S. are expected to buy something using their mobile phone at least once.
Video Marketing Statistics
- According to a report by Hostinger.com, global online video viewers could reach 3.88 billion by the end of 2025.
- In the same period, about 82% of internet users are expected to watch videos online.
- By 2024, digital video viewership had already grown to around 3.88 billion people worldwide.
- Meanwhile, short, interactive videos are helping businesses increase their sales and conversions by up to 80%.
- The report also shows that 90% of people spend their free time watching TikTok, YouTube Shorts, or Instagram Reels.
- Most companies use YouTube (90%) to share videos, followed by Facebook (86%), Instagram (79%), and LinkedIn (79%).

- Digital marketing teams focus on video content, with 47% using product demos, followed by explainers (35%) and webinars (33%).
- How-to videos (31%) and customer testimonials (27%) are also widely used.
- Additionally, 25% focus on social or promo videos, while thought leadership (20%) and FAQ videos (18%) are gaining traction for their educational value.
Email Marketing Statistics
- A report published by sixthcitymarketing.com also states that by 2025, nearly 4.5 billion global people will be using email, and that number is expected to cross 4.8 billion by 2027.
- Statista reports further show that email users will reach about 4.73 billion by 2026.
- According to a study by Harvard Business Review, working professionals check their email roughly 15 times a day or about once every 37 minutes.
 (Reference: shopify.com)
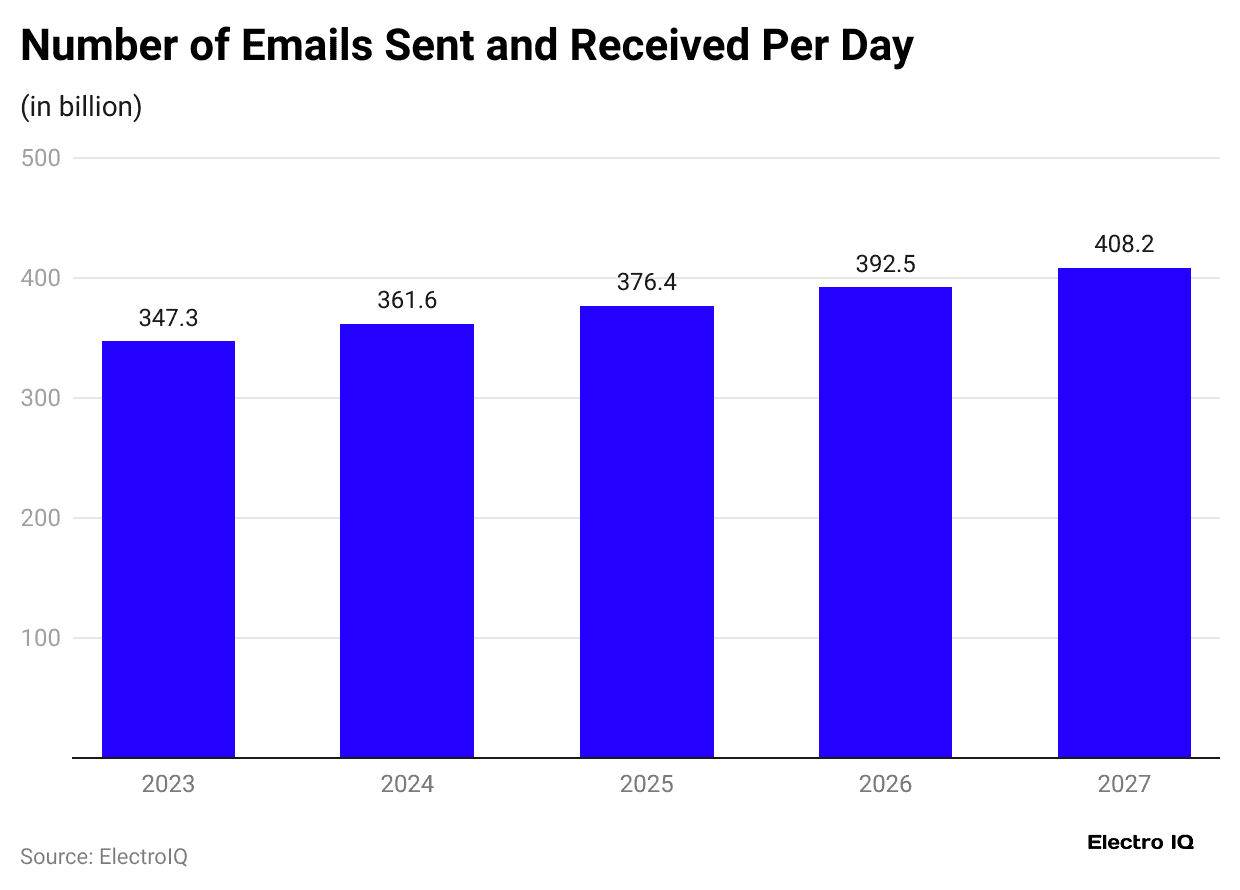
- The above graph states that in 2024, people sent and received 361.6 billion emails daily, up 4.1% from 347.3 billion in 2023.
- By the end of 2025, the total number of emails sent per day will account for 376.4 billion, followed by 392.5 billion (2026), and 408.2 billion (2027).
- Optinmonster reports also mentioned that about 99% of email users look at their inbox daily.
- Around 58% check emails right after waking up.
- Approximately 59% of Millennials and even more Gen Z users (67%) read their emails using smartphones.
- As of 2025, Gmail is the most used email service with 1.5 billion users, followed by iCloud Mail (850M), Outlook (400M), Yahoo! (230M), and Proton Mail with 50 million users.
- Email marketing gives high returns, earning up to USD 36 for every USD 1 spent. These results are most effective when campaigns are sent to a well-targeted email list built through lead magnets, opt-ins, and customer engagement strategies.
- The average click-through rate (CTR) for marketing emails is 2.3%, while the click-to-open rate (CTOR) is considered strong at around 11%.
 (Reference: tidio.com)
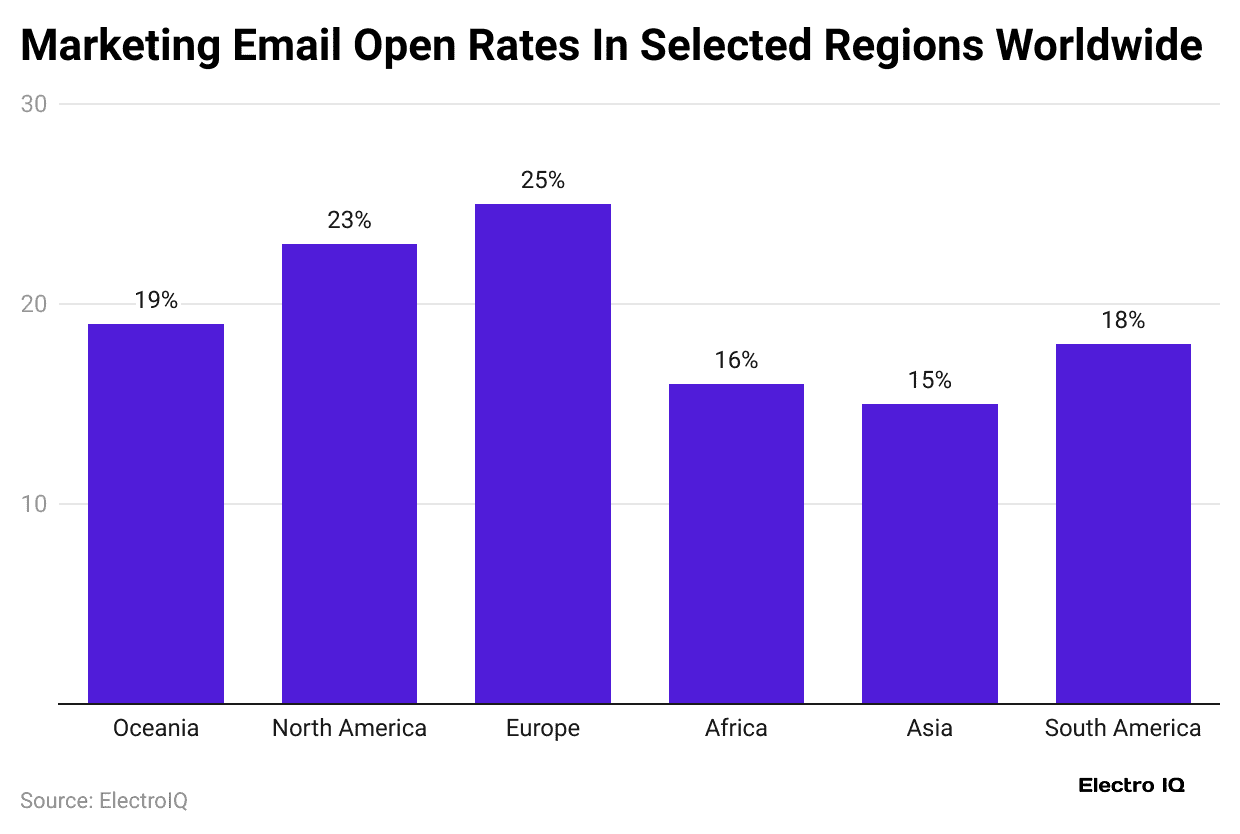
- Europe captured the highest open rates of email marketing, resulting in 25%, followed by the North American region (23%), and Oceania (19%).
- Other regions’ email open rates are followed by South America (18%), Africa (16%), and Asia (15%).
- Tidio report states that emails sent on Tuesdays see the highest open rates at 25%, followed by Mondays (22%) and Wednesdays (21%).
- Marketing emails get the most attention between 12 PM and 3 PM (27%), followed by 9 AM and 12 PM (24%) and 3 PM to 6 PM (18%).
- Engagement is lowest early morning (6 AM to 9 AM), evening (6 PM to 9 PM), and late night (9 PM to 12 AM).
SEO Statistics
- According to SQ Magazine reports of 2025, businesses around the world are expected to spend about USD 127.5 billion on SEO services, which is a 16% increase from last year.
- Among all digital channels, around 64% of marketing teams say SEO gives them the best return on investment (ROI).
- About 72% of companies that already use SEO are now also using AI tools to help with keyword tracking, improving content, and generating reports.
- The number of SEO agencies worldwide is expected to go beyond 13,000 by 2025.
- Organic search brings in 53.1% of all global website traffic, while paid search adds 15.7%, and direct visits account for 25.6%.
- Almost 88% of B2B marketers plan to use SEO as part of their content marketing plans in 2025.
 (Reference: bloggerspassion.com)
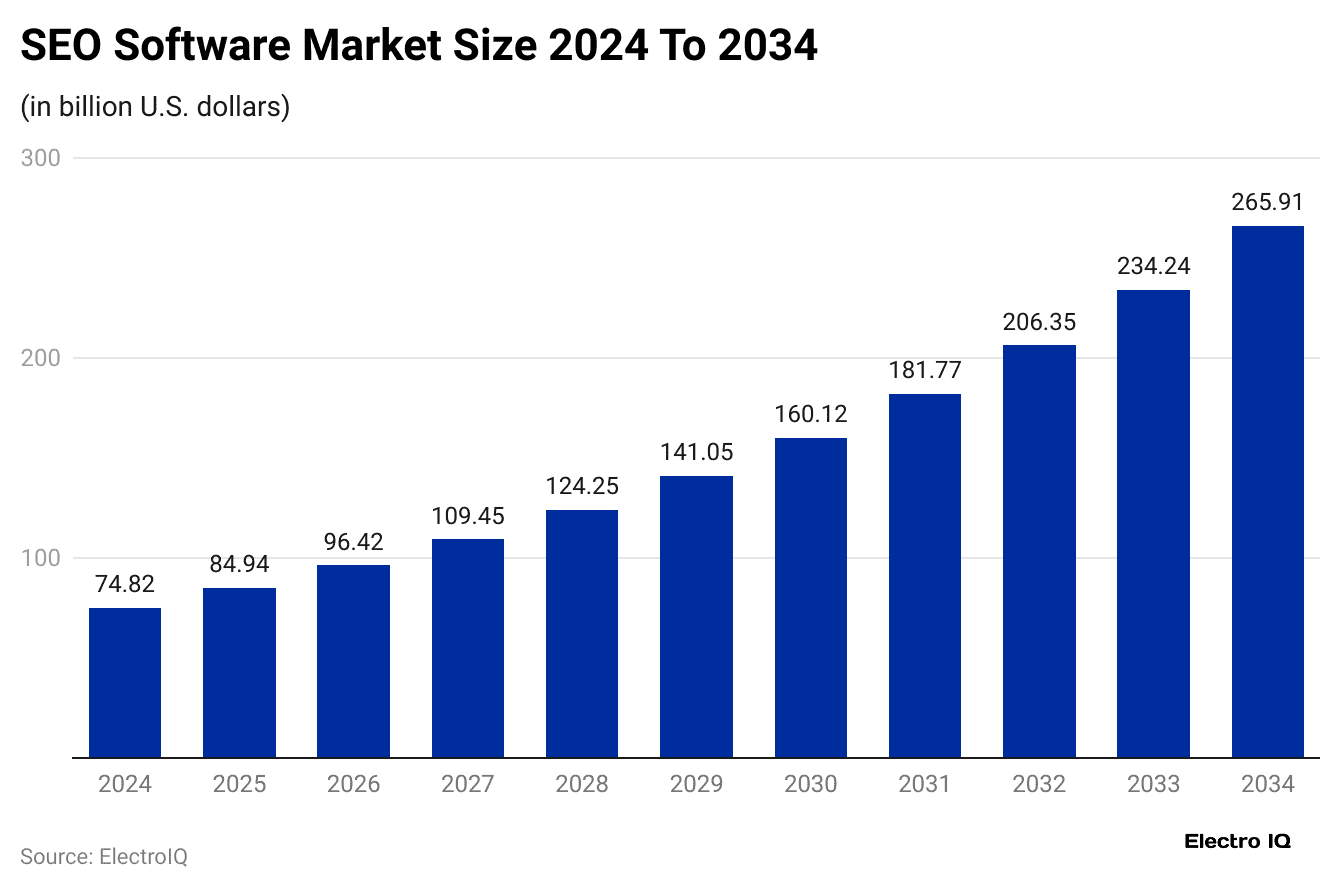
- As of 2025, the global SEO software market is expected to reach around USD 84.94 billion, an increase from USD 74.82 billion in 2024.
- The market will grow at a CAGR of 13.52% from 2025 to 2034, resulting in USD 206.35 billion.
 (Reference: bloggerspassion.com)
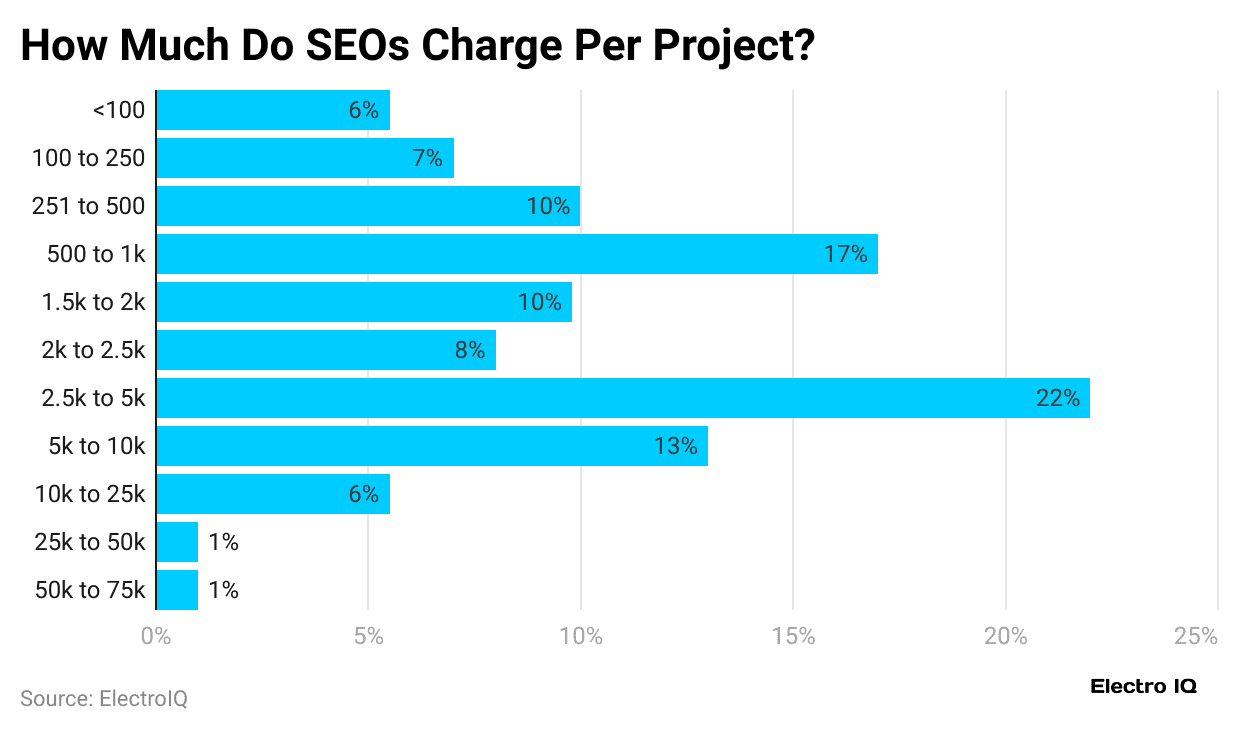
| Monthly Retainer Range (USD) | Approximate Respondents Share |
| 2.5k to 5k | 22% |
| 500 to 1k | 17% |
| 5k to 10k | 13% |
| 251 to 500 | 10% |
| 2k to 2.5k | 8% |
| 100 to 250 | 7% |
| <100 | 5.5% |
| 10k to 25k | 5.5% |
| 1.5k to 2k | 9.8% |
| 25k to 50k | 1% |
| 50k to 75k | 1% |
Content Marketing Statistics
- According to DigitalSilk, 83% of marketers believe content marketing works best for creating demand, while 63% say it helps them keep customers loyal and engaged over time.
- As of 2024, only 14% of companies got the best returns from content marketing.
- Approximately 92% of brands will invest more, while 80% of small owners write content themselves.
 (Reference: digitalsilk.com)
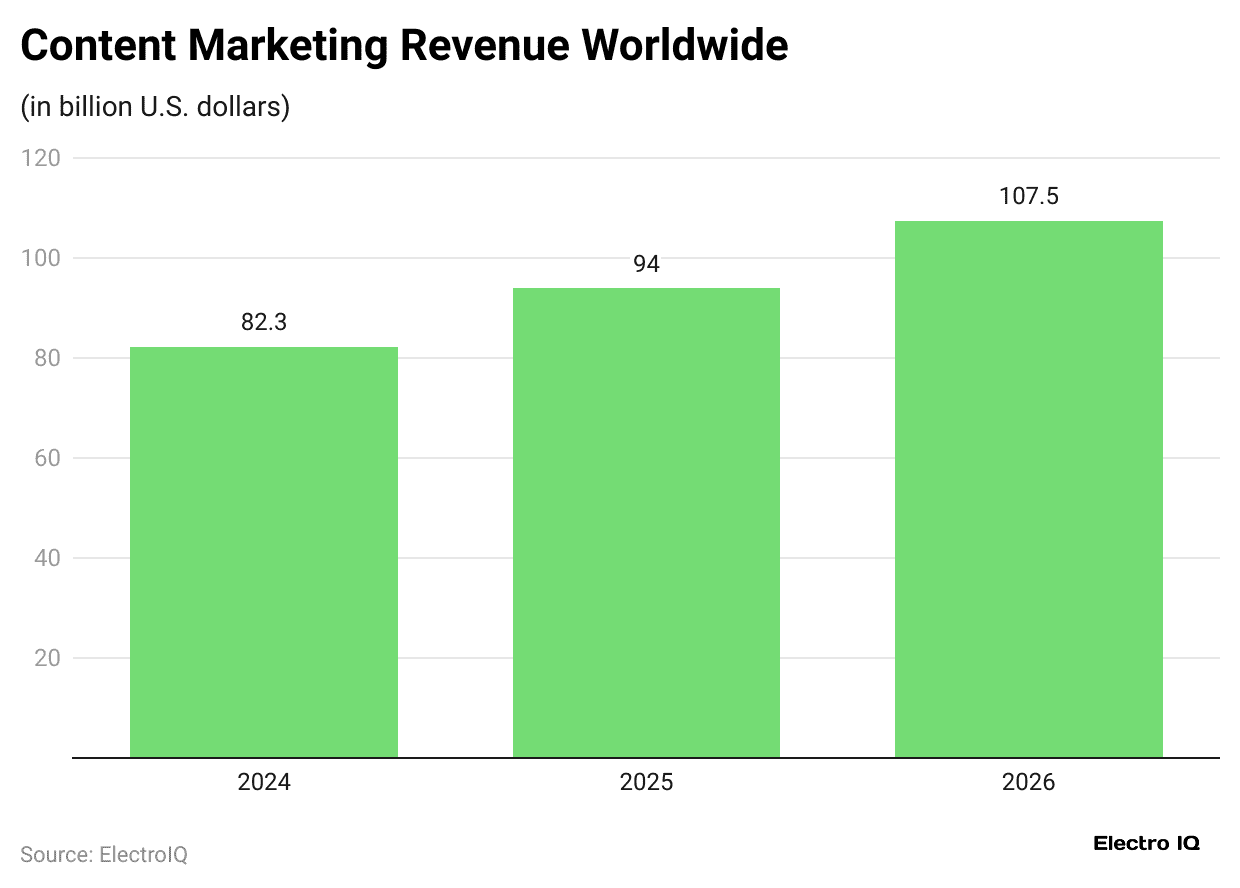
- By 2025, the global content marketing revenue is estimated to reach USD 94 billion, up from USD 82.3 billion in 2024.
- It is expected that by the end of 2026, the content marketing revenue will reach around USD 107.5 billion.
 (Reference: hostinger.com)
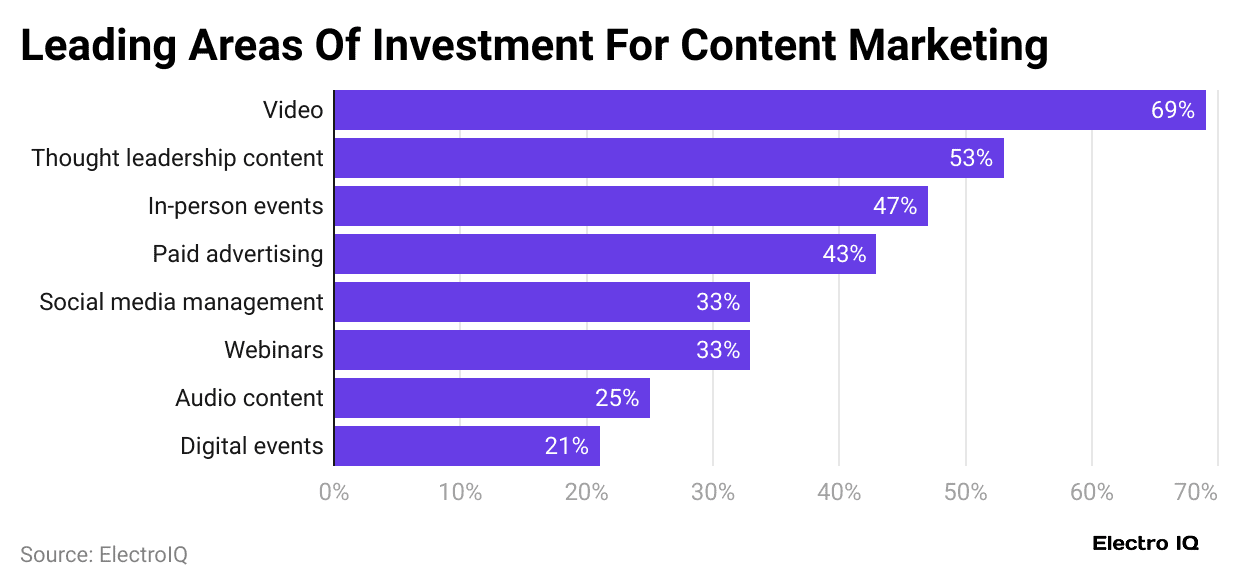
- According to the above chart analysis, video content is the top priority in content marketing investments, with 69% of marketers focusing on it.
- Thought leadership content follows closely, attracting 53% of investment, followed by in-person events (47%), paid advertising (43%), social media management (33%), webinars (33%), audio content (25%), and digital events (21%).
Influencer Marketing Statistics
- Amra and Elma’s report depicts that by 2025, the global market size of influencer marketing will reach around USD 32.55 billion, an increase from USD 24 billion in 2024.
- As of 2025, influencer marketing budgets are supposed to increase by 71% among marketers.
- In the same period, brands are earning an average of USD 5.78 for every USD 1 spent on influencer marketing, with top campaigns returning up to USD 20.
- Many marketers report influencer strategies performing up to 11 times better than traditional digital ads.
- Roughly 63% are using AI to run their influencer campaigns.
- About 86% of U.S. marketers now collaborate with influencers.
- As of 2024, 80% of companies allocate a specific budget for 2024.
- In contrast, only 14.5% of brands spend over USD 500,000 annually.
 (Reference: shopify.com)
- In 2024, almost 47.4% of brands plan to spend less than USD 10,000 on influencer marketing.
- Around 20.9% expect to invest between USD 10,000 and USD 50,000, while 8.9% are planning a budget between USD 50,000 and USD 100,000.
- Another 8.3% of companies will spend between USD 100,000 and USD 500,000.
- Interestingly, about 14.5% of brands are ready to go beyond USD 500,000 for their influencer marketing efforts.
Website Statistics
 (Source: seoprofy.com)
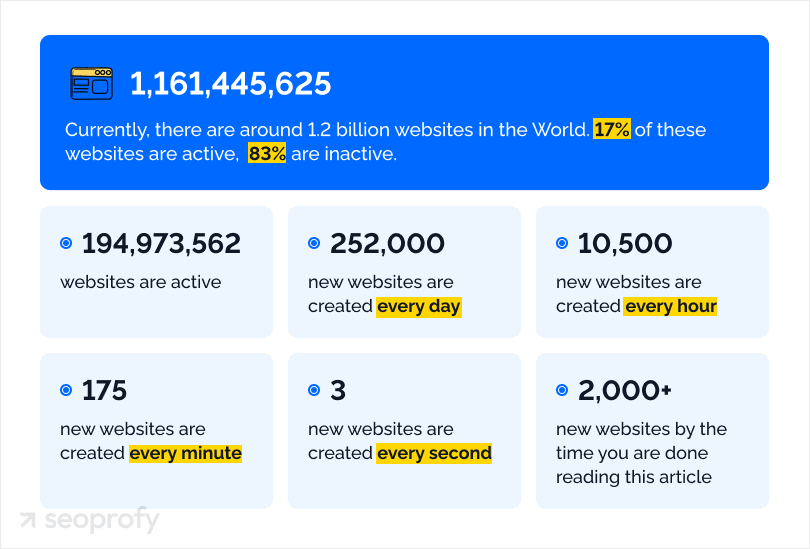
- There are approximately 1.2 billion websites in the world today, but only 17% of them are active, and the remaining 83% are not being used.
- Regularly, almost 252,000 new websites are created, while every hour, 10,500 websites are created.
- Every minute, 175 new websites are created, and three websites are created every second.
- Websites that show up first in search results usually load in about 1.65 seconds.
- A report by Dynamic Web says 57% of businesses get most of their sales orders through their websites.
- Agency Analytics shares that people spend an average of 52 to 54 seconds on a single page view.
- HubSpot highlights five key metrics web analysts watch: sales or conversion rates (31%), total visitors each month (30%), click-through rates (28%), search traffic (26%), and bounce rates (21%).
- According to WebflowSix, 6 out of 10 marketing leaders feel their current website tools don’t fully meet their needs.
- Around 93% of them believe their website needs improvement.
- Statista also found that Americans react differently to cookie notices: 32% accept all, 15% adjust settings, 31% decide based on the site, and 9% reject all cookies.
B2B and B2C Marketing Statistics
 (Reference: sellerscommerce.com)
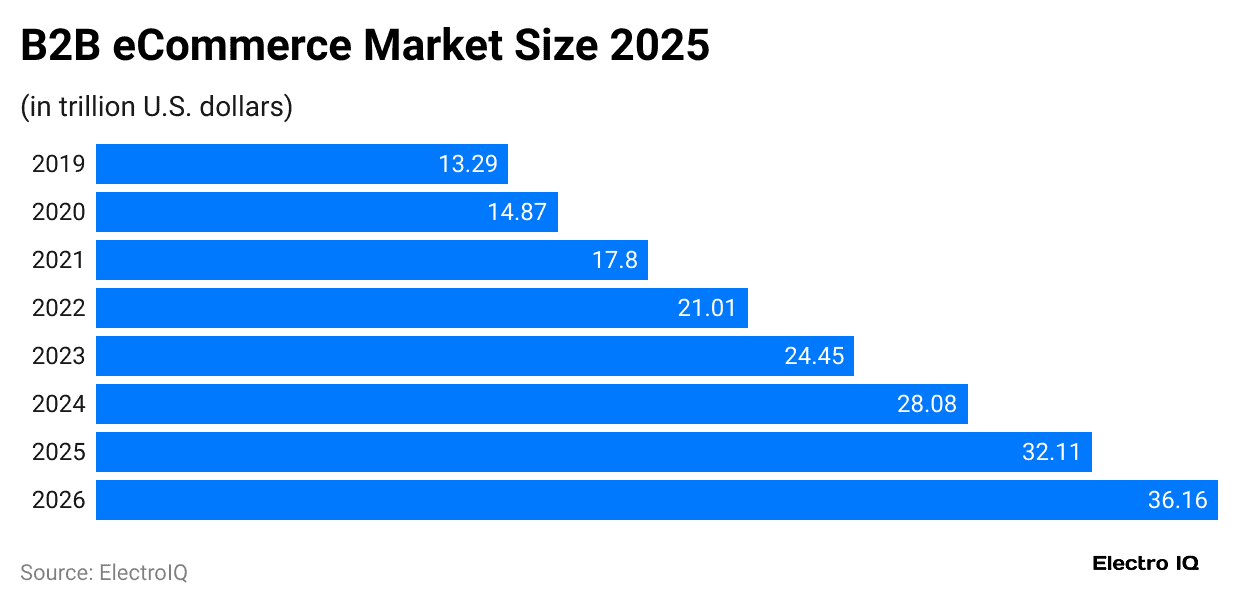
- As of 2025, the global market size of B2B e-commerce is expected to reach around USD 32.11 trillion, and will reach up to USD 36.16 trillion by 2026, and the market will grow at a CAGR of 14.5%.
- According to the Demand Sage report in the U.S., B2B digital ad spending is expected to reach USD 19.22 billion by the end of 2025.
- Many B2B buyers depend on digital content when choosing what to buy, with 60% making final decisions based on it.
- Around 72% of marketers say videos are a must, and 89% search online before purchasing.
- Social media helps 75% make choices, while two-thirds shop on marketplaces.
- Over half of B2B marketers now use AI tools to improve their marketing work.
The table below states the preferred social media platforms used by B2B Marketers:
| Platform | Share of B2B marketers |
| 80% | |
| YouTube | 63% |
| 57% | |
| 52% | |
| 39% | |
| TikTok | 16% |
- According to the Keevee report analysis by 2025, the global B2C e-commerce is expected to hit USD 6.4 trillion.
- Most marketers are increasing digital budgets, with 86% focusing on online strategies.
- Nearly half the spending goes to social media, and 65% targets mobile users.
- The North American region leads with 38% of total B2C marketing investments worldwide.
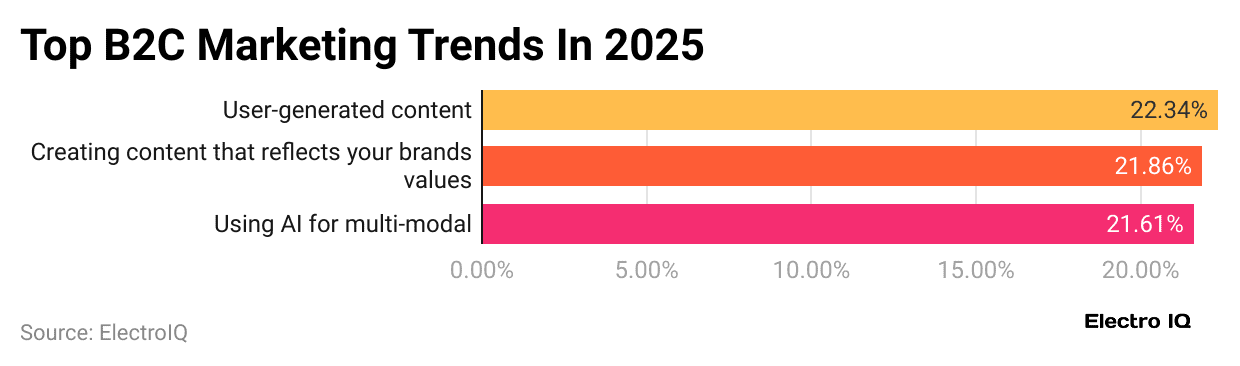 (Reference: hubspot.com)
- Around 22.34% of B2C marketers use content made by customers to promote their brand.
- 86% create content that shows their brand’s values, like social responsibility.
- 61% use AI to turn text into videos, podcasts, demos, and other types of content for different platforms.
Paid Search and PPC Statistics
- According to The Loop Marketing report (April 2025), about 42.7% of internet users worldwide and 32.2% of Americans now use ad blockers.
- Moreover, Google Ads remains the top pay-per-click (PPC) platform, used by 96% of brands and improves brand awareness by up to 80%
- Google states that for every USD 1 spent on ads, businesses typically earn USD 2 in return, offering a 200% return on investment.
- In Q1 2025 alone, Google earned USD 66.9 billion from ad revenue, which made up nearly 75% of its total income.
- Based on Digital Marketing Statistics, companies spend between USD 108,000 and USD 120,000 each year on PPC advertising.
- Around 74% of brands say PPC plays a big role in their success, and 64% plan to increase their ad spending next year.
- The costliest keyword on Google Ads is “insurance,” priced at more than USD 54 per click.
- As of May 2025, the average cost per click (CPC) across all industries is USD 5.26 for search ads and around USD 0.66 for display ads.
- Video ads also perform better, getting 73% more clicks than banner ads.
Local Digital Marketing Statistics
- SEO.com report further states that as of 2025, people make around 97 billion local searches online each month, and 1.5 billion of those lead to store visits.
- Almost 97% of users have looked online for a nearby business, while searches with “near me” have grown by 500%.
- Digital Marketing Statistics also show that having more than 100 images on a Google Business Profile can increase clicks by over 1000%.
- Nearly 88% of people using phones to find local businesses visit a store within a day.
- About 61% prefer contacting businesses with mobile-friendly websites.
- Around 56% shop both online and offline. Local searches make up 46% of Google searches, and 28% of them result in a purchase.
Blogging Statistics
- The Media Valet report further shows that globally, there are more than 600 million blogs, representing 1.9 billion websites on the internet.
- A report published by Siege Media states that between 2024 and 2025, marketing budgets will either grow or stay the same, as claimed by 88.2% of content marketers.
- About 40% of them plan to outsource at least 25% of their content work this year.
- The use of AI in content marketing is rising, with about 90% plan to use it in 2025, up from 83.2% in 2024.
- Over 90% of bloggers use social media to share their blog posts.
- About 41% write content based on their research.
- 38% of bloggers who get better results often use more than one editor, as compared to 34% who use just one.
- When it comes to analytics, 32% always check, 30% check often, while 5% don’t have access.
Use of Artificial Intelligence (AI) In Content Marketing Statistics
- A report published by Digital Silk found that about 35% of marketers mainly use AI for creating content, and 86% say it saves them over an hour on creative work.
- In contrast, only 14% of marketers skip editing AI-made content.
- Around 29% of media and marketing leaders use ChatGPT to help with content tasks.
- About 67% of small businesses use AI for SEO or content marketing, while 68% say AI improved their content marketing returns.
 (Reference: digitalsilk.com)
- According to the above chart, about 46% of them use AI to write marketing copy, and another 41% rely on AI to help create content outlines.
- Additionally, 34% use AI tools for research, followed by 34% (brainstorming).
- Digital marketers mainly outsource writing to AI, with 42% using it for this task, followed by 40% who depend on AI to handle their social media content creation.
- Around 34% use AI for personalization, while 33% delegate design work to AI systems.
- AI handles both content classification and SEO tasks for 32% of marketers.
Conclusion
After completing the article on Digital Marketing Statistics, it can be concluded that in the fast-moving digital world, digital marketing helps global businesses to stay more competitive against competitors. They include smart strategies, the right tools, and constant adaptation. Digital marketing helps brands reach the right people at the right time using tools like SEO, content creation, social media, and analytics.
As technology changes and customer habits shift, companies that use data and creative ideas will stay ahead. In the end, good digital marketing isn’t just about getting noticed, but it’s about creating strong connections and achieving real results.
Sources
FAQ.
Philip Kotler is known as the father of digital marketing.
Customer, Content, Context, Community, Convenience, Cohesion, and Conversion are the seven elements of digital marketing.
Popular tools include Google Analytics, SEMrush, HubSpot, Mailchimp, and Canva.

Maitrayee Dey has a background in Electrical Engineering and has worked in various technical roles before transitioning to writing. Specializing in technology and Artificial Intelligence, she has served as an Academic Research Analyst and Freelance Writer, particularly focusing on education and healthcare in Australia. Maitrayee's lifelong passions for writing and painting led her to pursue a full-time writing career. She is also the creator of a cooking YouTube channel, where she shares her culinary adventures. At Smartphone Thoughts, Maitrayee brings her expertise in technology to provide in-depth smartphone reviews and app-related statistics, making complex topics easy to understand for all readers.