Holiday Spending Statistics By Device, Revenue, Destination And Trend (2025)
Updated · Jul 01, 2025

Table of Contents
- Introduction
- Editor’s Choice
- Holiday Spending Device Statistics
- Holiday Spending Revenue Statistics
- By Key Days
- Holiday Spending Conversion Rate Statistics by Desktop vs Mobile, 2024
- Consumer Holiday Spending Plans
- Consumer Holiday Shopping Destination Statistics
- Holiday Spending Discount Statistics (December 31, 2024)
- Valentine’s Day Spending Statistics
- St. Patrick’s Day spending statistics
- Easter Spending Statistics
- Mother’s Day Spending Statistics
- Memorial Day spending statistics
- Father’s Day spending statistics
- Fourth of July Spending Statistics
- Labor Day Spending Statistics
- Halloween Spending Statistics
- Thanksgiving Spending Statistics
- Christmas and New Year’s Eve Spending Statistics
- Conclusion
Introduction
Holiday Spending Statistics: Over the last few decades, a holiday has become not only a celebration but also a special occasion for consumer spending. Every year, millions of shoppers plan their purchases earlier, explore multiple channels, and demand faster, more personalized experiences.
In recent years, more people are now shopping online, and the economy is changing how and when they spend during the holidays. From mobile deals and social media influence to buy-now-pay-later options and record online sales, this article explores several key statistics and insights that drive holiday shopping behavior, providing a deeper understanding of the topic.
Editor’s Choice
- The Ufleet report further states that, for starters, holiday shopping reached a new record of USD 1.2 trillion globally by the end of 2024.
- According to Adobe’s reports for Business, as of December 31, 2024, total holiday spending reached USD 241.4 billion.
- In the same period, the overall buy-now, pay-later holiday spending secured USD 18.2 billion in revenue.
- Meanwhile, mobile spending totaled USD 131.5 billion, followed by buy now, pay later, which accounted for USD 18.2 billion.
- As of December 2024, online retail spending during the holiday season was approximately USD 241.4 billion, accounting for 53.36% of the total and representing an 8.7% increase from the previous year.
- Moreover, in November 2024, total holiday spending was approximately USD 112.6 billion, accounting for a 46.64% share.
- Holiday spending has increased, as people are purchasing more gifts for family members, resulting in a total of USD 902 spent per person.
- The top destination for holiday spending remains online shopping, with 57% of all adult consumers and 59% of customers aged 18 to 24.
Holiday Spending Device Statistics
 (Reference: adobe.com)
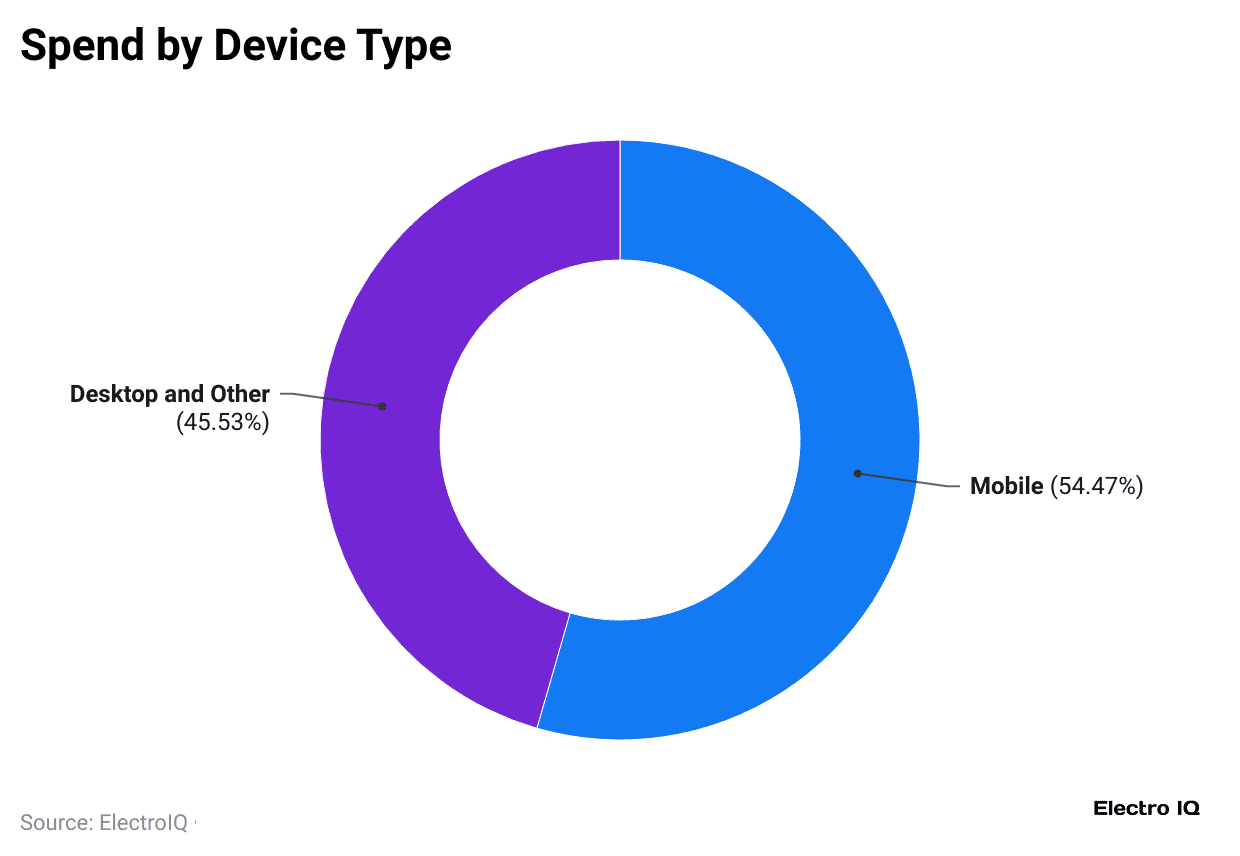
- The above image states that as of December 2024, online spending during the holiday season by overall devices was approximately USD 241.4 billion.
- Meanwhile, revenue generated by mobile devices was USD 131.5 billion, accounting for a 54.47% share of the total.
- Additionally, desktops and other devices generated USD 109.9 billion in revenue, accounting for a 45.53% share of the total.
 (Reference: adobe.com)
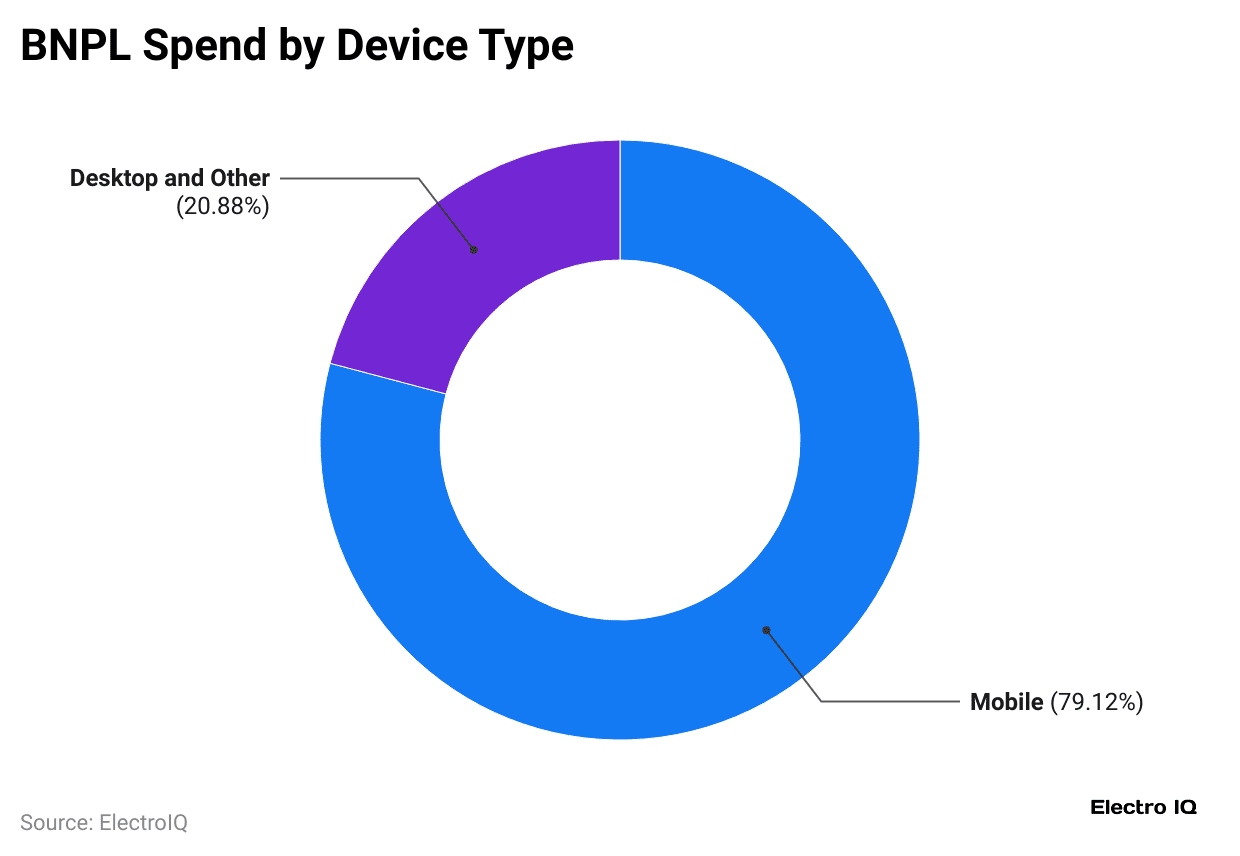
- As of December 31, 2024, the overall buy-now, pay-later holiday spending secured USD 18.2 billion in revenue.
- Meanwhile, the highest BNPL spending on mobile devices was secured, amounting to USD 14.4 billion, with a share of 79.12%.
- Besides, on desktops & other devices, revenue accounted for USD 3.8 billion (20.88% share).
Holiday Spending Revenue Statistics
- Adobe for Business further states that, as of December 31, 2024, revenue from holiday spending was approximately USD 3.1 billion.
- As of 2024, the highest daily revenue was recorded on December 1, at USD 13.3 billion.
- The Ufleet report further states that, for starters, holiday shopping reached a new record of USD 1.2 trillion globally by the end of 2024.
- In the United States, holiday season sales recorded USD 282 billion in the same duration, with a growth rate of 4% YoY.
By Key Days
- As mentioned in the chart above, the highest holiday spending occurred on Cyber Monday, resulting in USD 13.3 billion in revenue in 2024 and USD 12.4 billion in 2023.
Furthermore, holiday spendings on other key days are stated in the table below:
| 2024 (USD billion) | 2023 (USD billion) | |
| Black Friday | 10.8 |
9.8 |
|
Thanksgiving |
6.1 | 5.6 |
| Thanksgiving Eve | 4.1 |
3.9 |
|
Veteran’s |
3.3 |
3.1 |
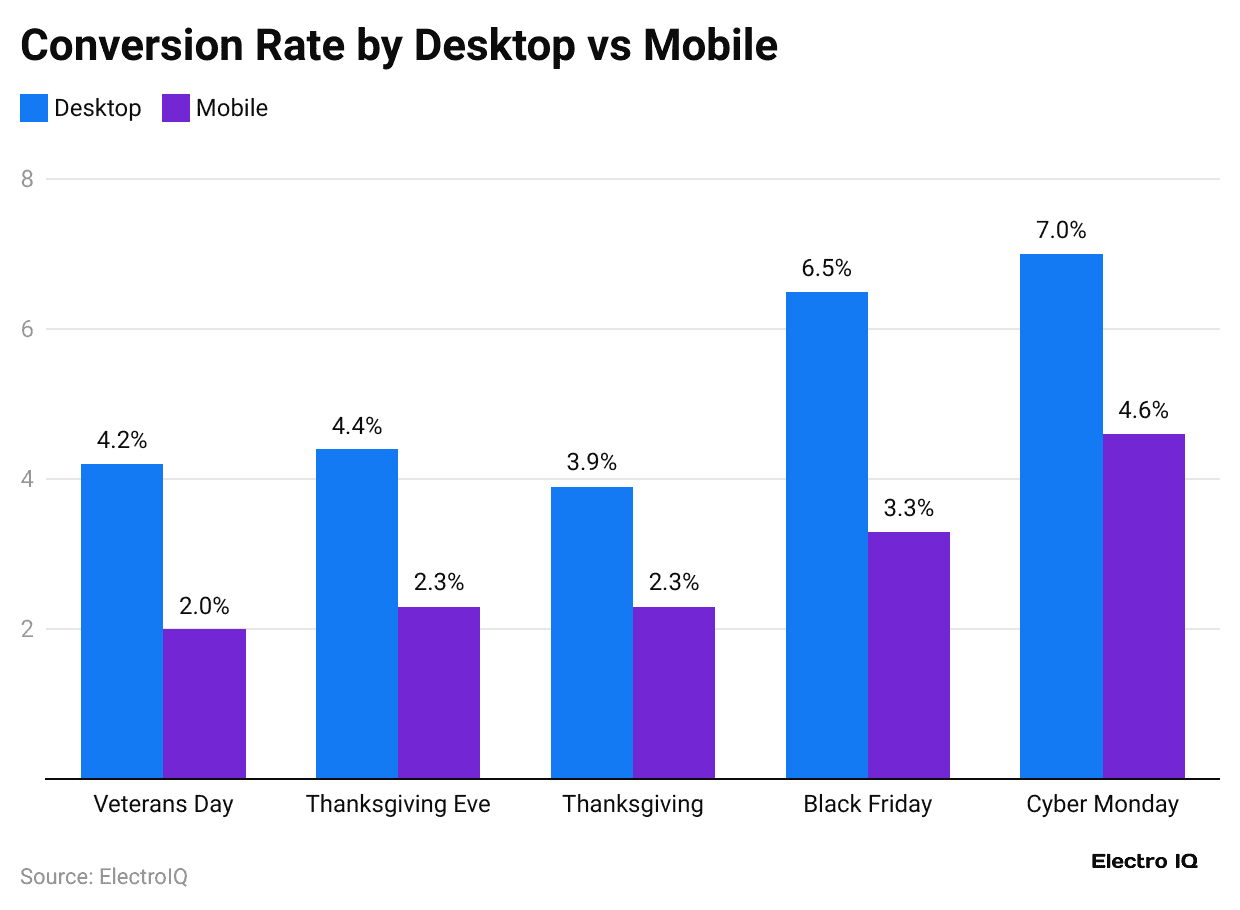
Holiday Spending Conversion Rate Statistics by Desktop vs Mobile, 2024
| Desktop | Mobile | |
| Cyber Monday | 7% |
4.6% |
|
Black Friday |
6.5% | 3.3% |
| Thanksgiving | 3.9% |
2.3% |
|
Thanksgiving Eve |
4.4% | 2.3% |
| Veteran’s | 4.2% |
2% |
Consumer Holiday Spending Plans
 (Reference: nrf.com)
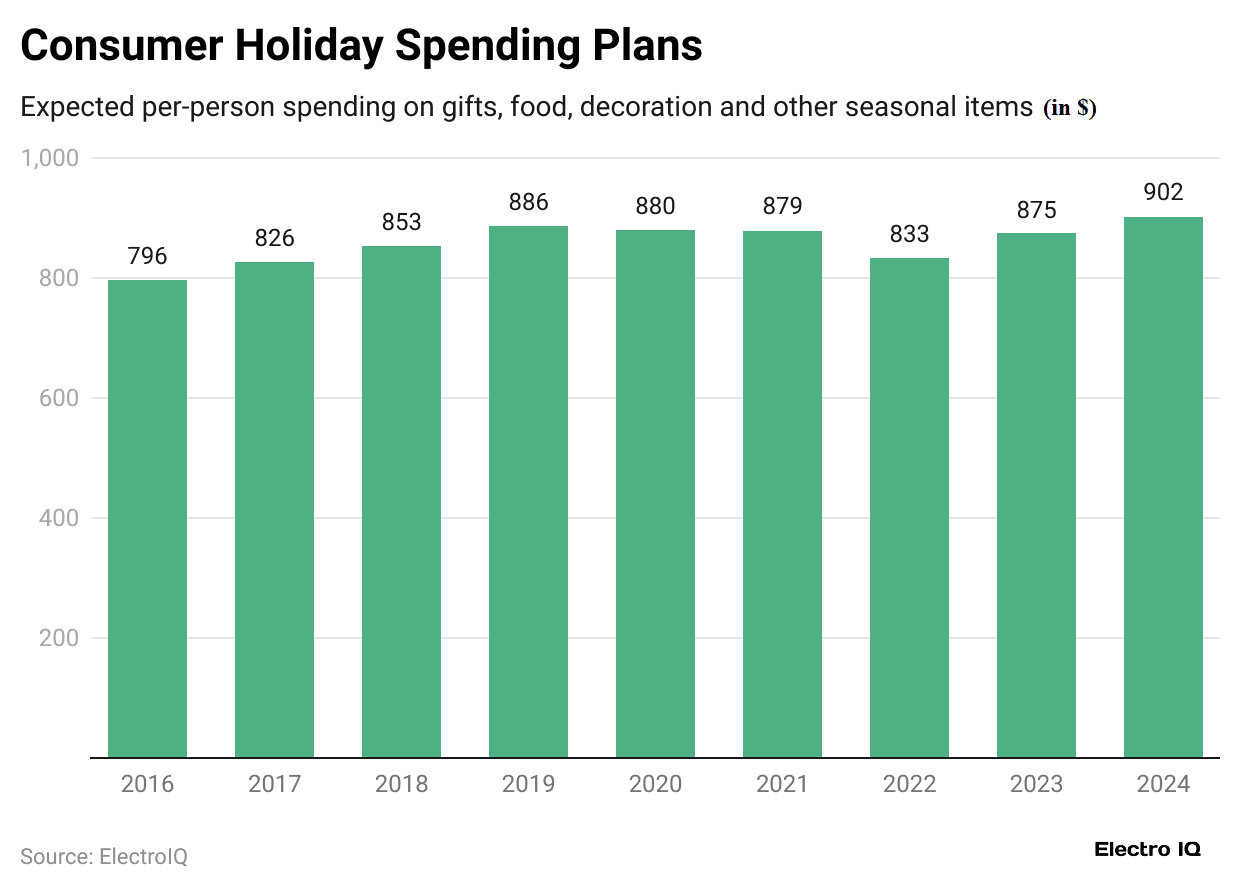
- The above graph indicates that holiday spending has increased, as people are purchasing more gifts for family members, resulting in a total of USD 902 spent per person, up from USD 875 in 2023.
- As of 2024, approximately USD 641 was allocated toward gifts for family, friends, coworkers, and others.
- Meanwhile, the remaining USD 261 will be used for other holiday needs, such as food, candy, decorations, greeting cards, and similar items.
Consumer Holiday Shopping Destination Statistics
- The top destination for holiday spending remains online shopping, with 57% of all adult consumers and 59% of customers aged 18 to 24.
The share of consumers shopping at each destination is mentioned in the table below:
| Destinations | All adults share | 18-24 years share |
| Department store | 46% |
49% |
|
Grocery store |
46% | 43% |
| Discount store | 45% |
44% |
|
Clothing store |
31% | 47% |
| Small business | 23% |
26% |
|
Electronics store |
19% | 31% |
| Craft store | 16% |
19% |
|
Outlet store |
12% | 14% |
| Speciality store | 12% |
14% |
|
Thrift store |
12% | 20% |
| Drug store | 10% |
11% |
|
Catalogue |
6% |
6% |
Holiday Spending Discount Statistics (December 31, 2024)
| Products | Discounts |
| Electronics |
5.3% |
|
Toys |
12.3% |
| Apparel |
3.7% |
|
Televisions |
7.2% |
| Sporting Goods |
2.7% |
|
Computers |
2.3% |
|
Furniture |
2.7% |
| Appliance |
2.8% |
Valentine’s Day Spending Statistics
- A LendingTree report further states that in 2024 and 2025, around 82% of Americans who are dating, engaged, or married have bought Valentine’s Day gifts.
- Meanwhile, in 2025, the total Valentine’s Day spending was USD 179, while in 2024, it was USD 180.
- Men and women spent a total of USD 258 and USD 106, respectively, on this day in 2025.
- In 2025, Gen Z in relationships plan to spend USD 257 on Valentine’s gifts, more than others.
- In the same year, 33% of consumers used credit cards or debit cards to purchase gifts.
- Meanwhile, 23% of them gifted chocolate, candy, or a special meal.
- 12% start planning for Valentine’s Day early, while 14% wait until just before it.
- In contrast, 44% plan to shop at big-box stores, followed by 35% at groceries, and 31% online.
St. Patrick’s Day spending statistics
 (Reference: nrf.com)
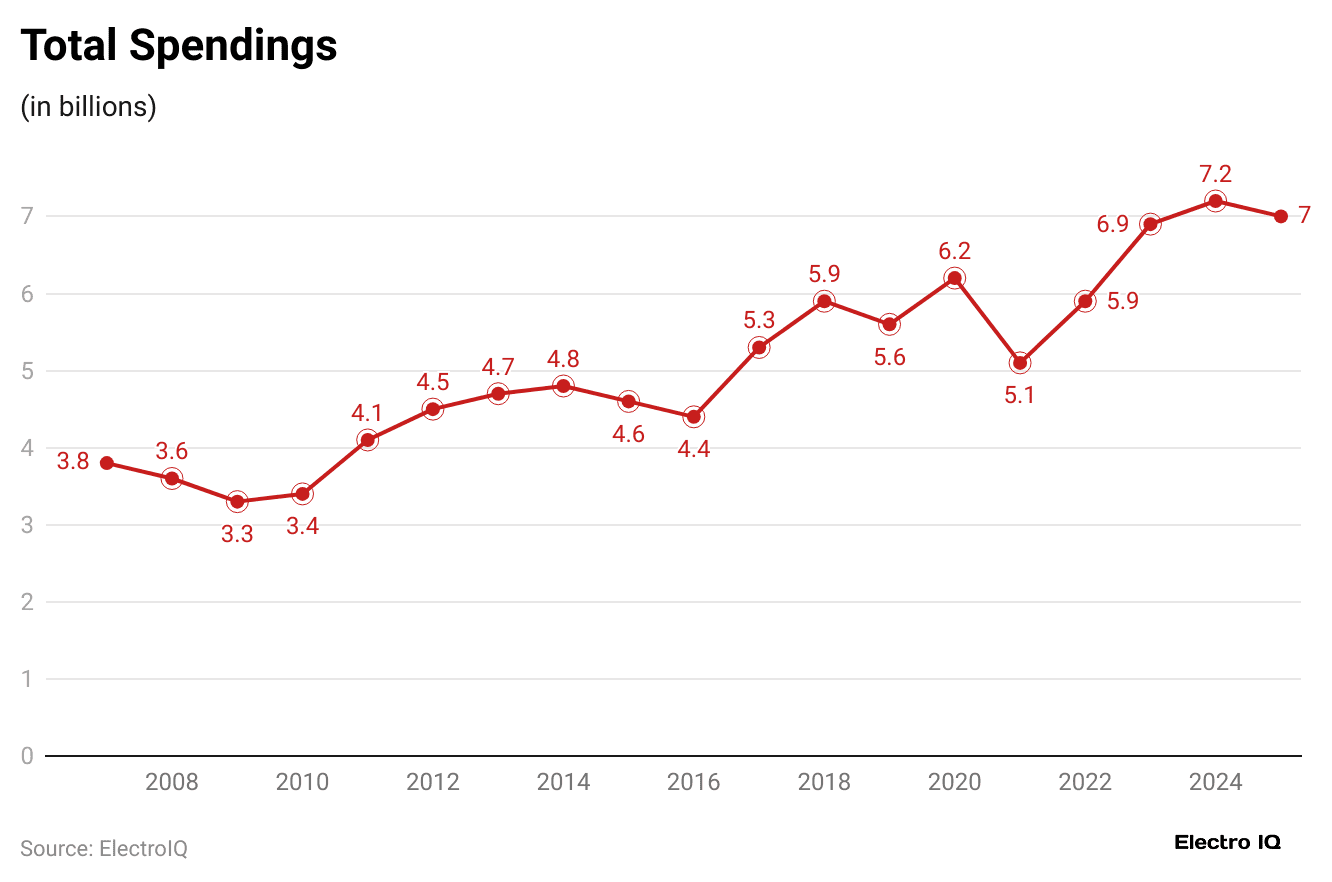
- By the end of 2025, St. Patrick’s Day spending will reach up to USD 7 billion, up from USD 7.2 billion in 2024, according to the National Retail Federation.
Other spending is stated below:
| 2024 | 2025 | |
| Per-person Spending | USD 44.40 |
USD 43.64 |
|
Celebrating Share |
62% |
61% |
- In 2024, average household spending for St. Patrick’s Day rose slightly to USD 44.40 from USD 43.84.
- Only 33% of Americans celebrated St. Patrick’s Day in 2025, marking one of the lowest participation rates for a holiday.
- In contrast, 46% of St. Patrick’s Day plan to buy alcohol, mostly beer (60%).
- This year, 53% of shoppers spent less than USD 50.
Easter Spending Statistics
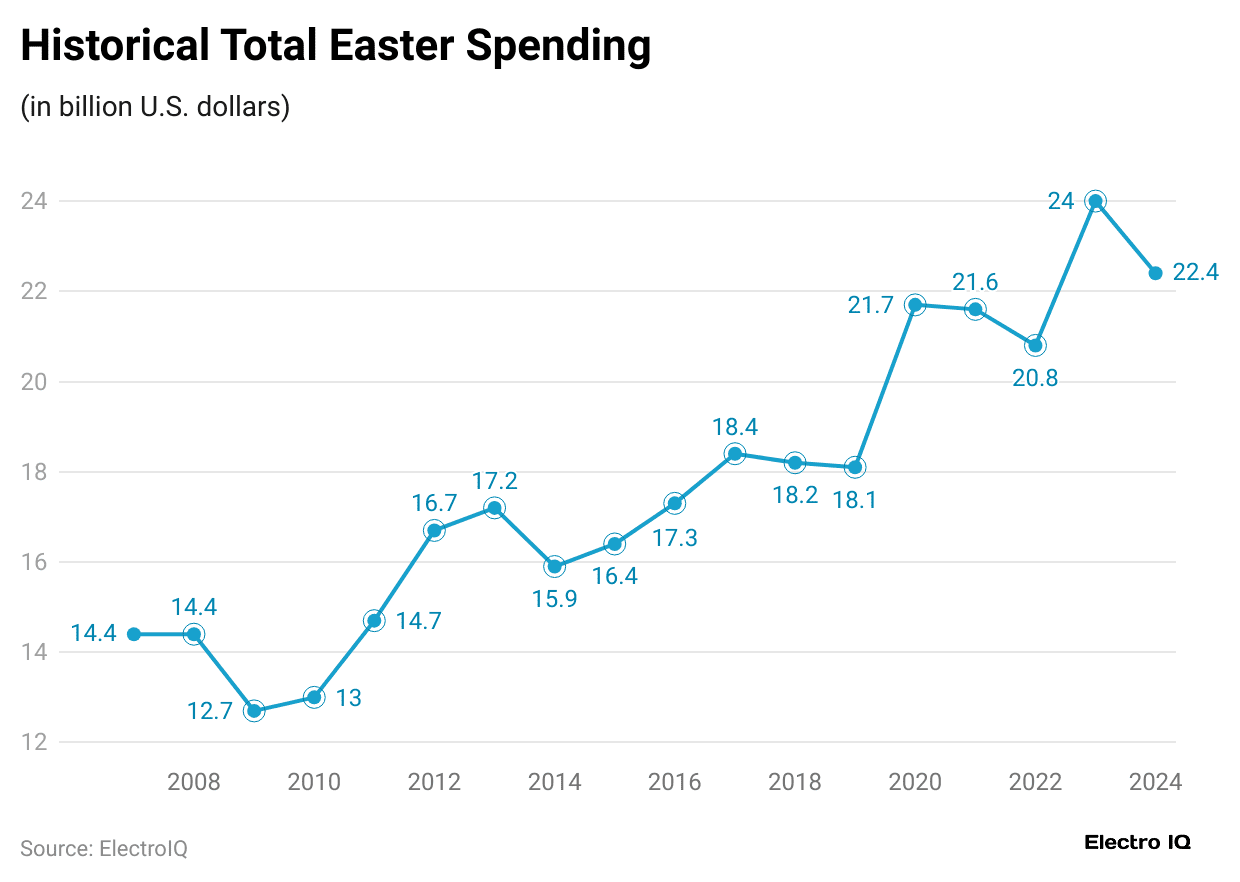
- According to the annual survey by NRF, consumer spending during Easter was approximately USD 22.4 billion in 2024, compared to around USD 24 billion in 2023.
- On average, in Easter 2024, each person was expected to spend around USD 177.06.
 (Reference: infogram.com)
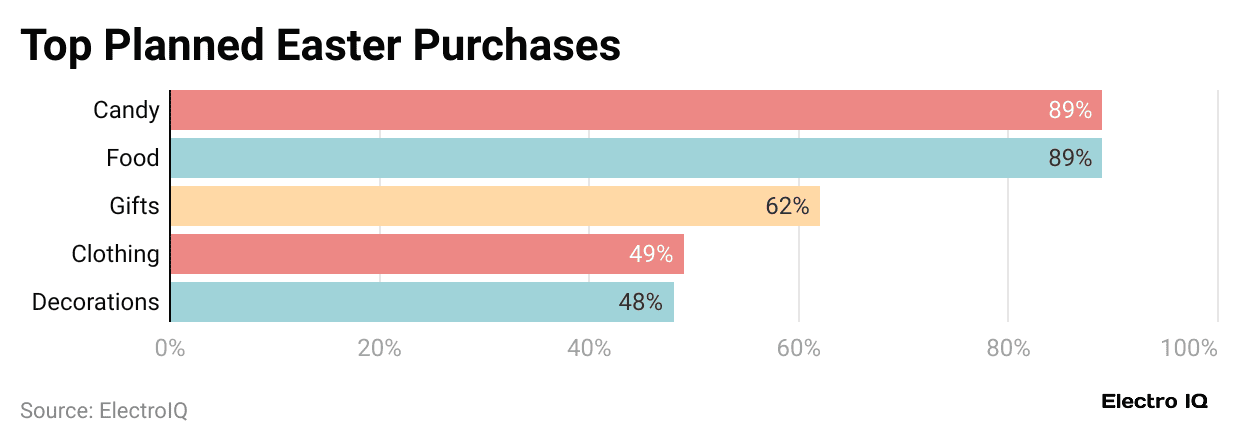
- People spend the most money on food, totalling around USD 7.3 billion, which accounts for 89%.
- Furthermore, others are followed by Clothing (USD 3.5 billion) (49%), gifts (USD 3.4 billion) (62%), Candy (USD 3.1 billion) (89%), and decorations (USD 1.6 billion) (48%).
Mother’s Day Spending Statistics
 (Source: infogram.com)
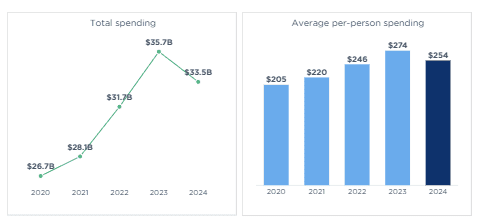
- The above image indicates that in 2024, the total spending on Mother’s Day was USD 33.5 billion, with an average per-person spending of USD 254.
- People aged 35 to 44 have spent the most this holiday season, with an average budget of USD 345.75.
- This year, people have spent around USD 7 billion on jewelry, followed by special outings (USD 5.9 billion), electronics (USD 3.5 billion), flowers (USD 3.2 billion), and greeting cards (USD 1.1 billion).
- Among holiday shoppers, 59% are buying gifts for their mother or stepmother, while 22% (wife) and 12% (daughter).
- Based on the reports of Hallmark, Mother’s Day ranks third in the U.S. for card-giving, with 113 million cards exchanged yearly.
Memorial Day spending statistics
- LendingTree’s report further states that in 2025, almost 46% of people plan to celebrate Memorial Day.
- A record 45.1 million Americans travelled over 50 miles for Memorial Day in the same period, and over 20 million people were expected to fly out of U.S. airports.
- During the Memorial Day weekend in 2024, the average airfare to Europe was USD 974, which is 2% lower than in 2023.
- Renting a car costs about USD 43 per day.
- For Memorial Day 2025, 82% of people plan to buy food, and 45% plan to purchase alcohol.
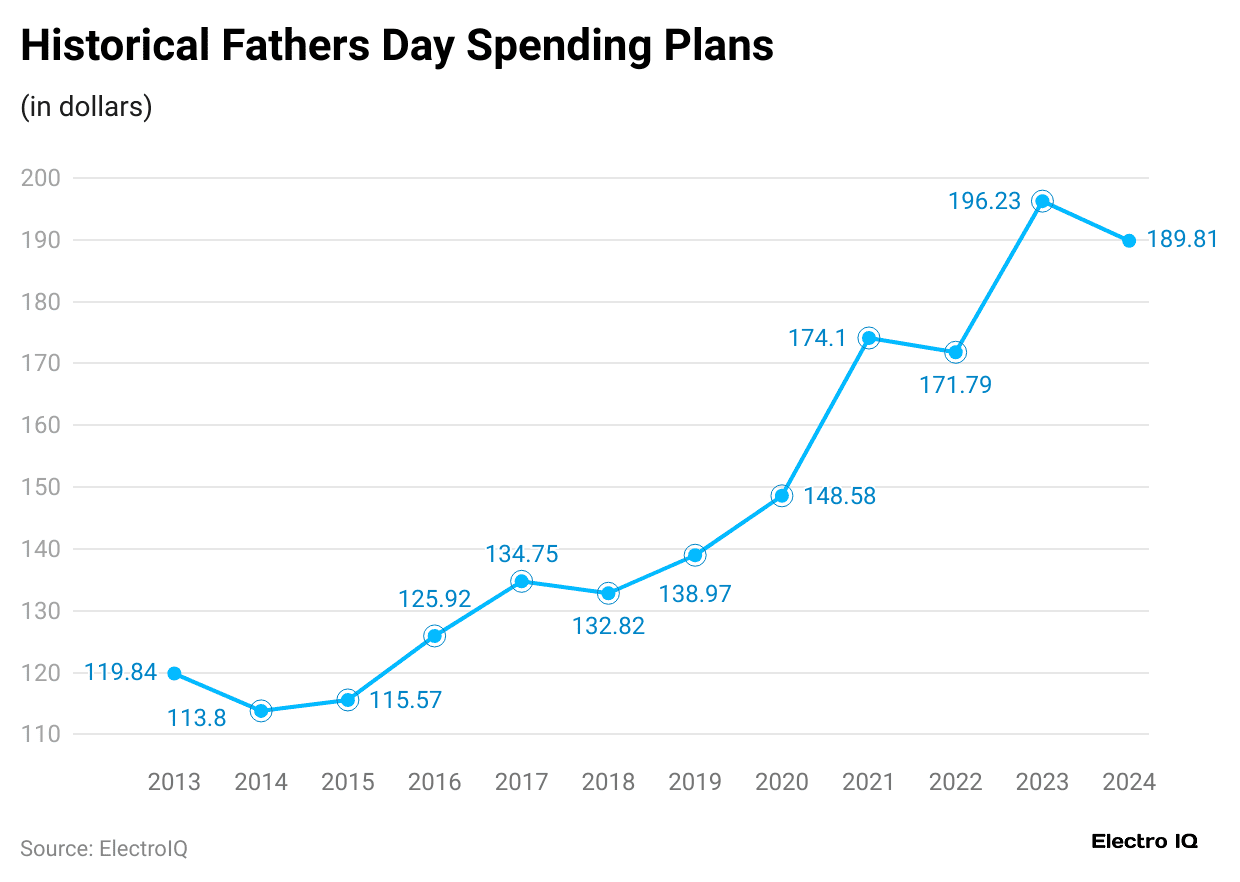
Father’s Day spending statistics
 (Reference: nrf.com)
- As of 2024, people have spent approximately USD 22.4 billion on Father’s Day, slightly less than the USD 22.9 billion spent in 2023.
- People spent approximately USD 189.81 on shopping, which is slightly less than last year’s high of USD 196.23.
- People aged from 25 to 34 spent the most this year, averaging USD 275.67.
- About 50% of people plan to buy a gift for their husband (26%), son (10%), brother (8%), friend (8%), or grandfather (6%).
- The top 5 gift categories of Father’s Day are followed by special outings (USD 4.5 billion), clothing (USD 3.5 billion), gift cards (USD 2.9 billion), electronics (USD 2.4 billion), and personal care (USD 1.6 billion).
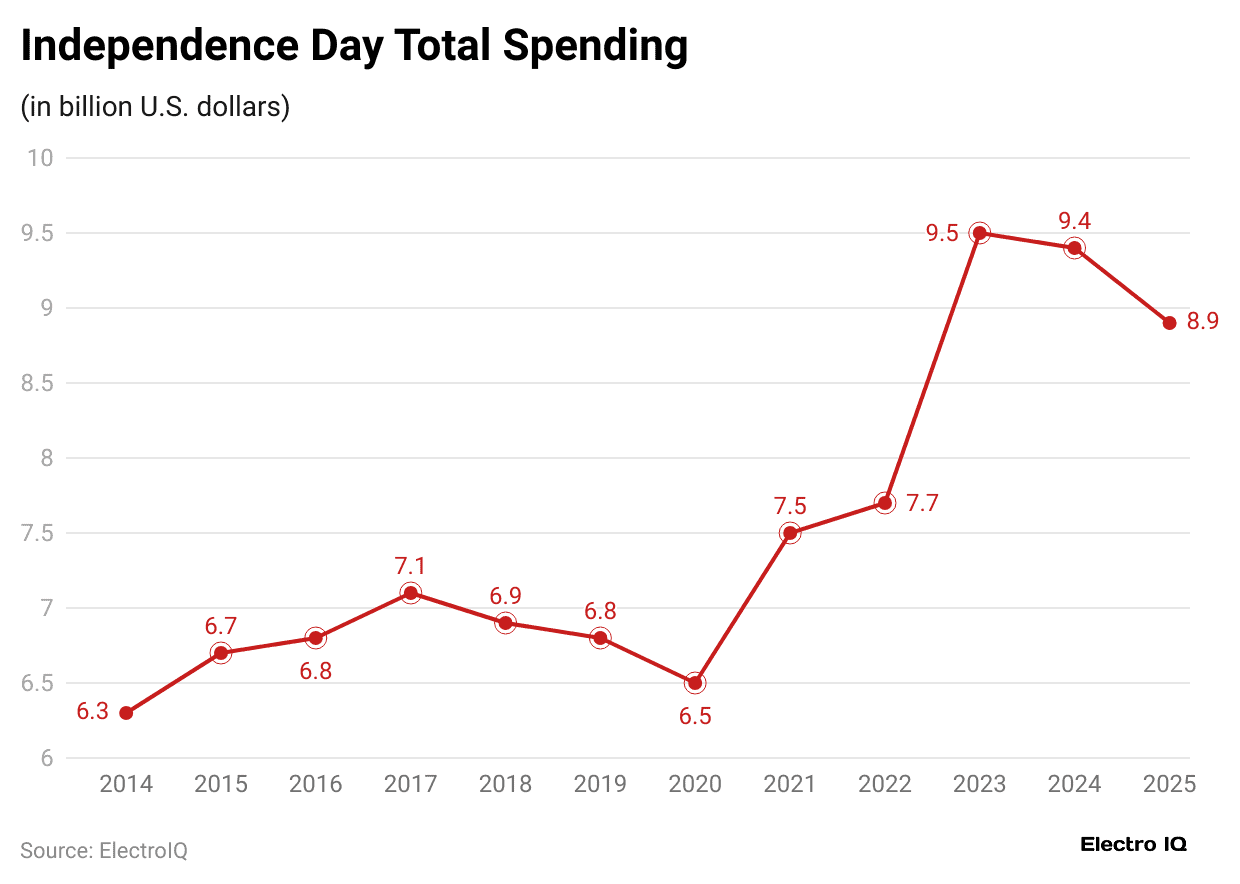
Fourth of July Spending Statistics
 (Reference: infogram.com)
- The Fourth of July is celebrated as Independence Day of the United States. In 2025, the total spending on Independence Day food items was USD 8.9 billion, up from USD 9.4 billion in 2024.
- During the same period, per-person spending on this day was USD 92.44, and the share of celebrants will be 86%.
- In 2025, approximately 67% of Americans plan to celebrate the Fourth of July.
- 49% of them get ready one to two weeks in advance, more than any other holiday tracked.
- This day is considered the fourth most food-focused holiday, according to 79% of respondents who say they will buy food for the celebration.
- A record published by AAA states that 70.9 million Americans planned to travel at least 50 miles during the Independence Day 2024 weekend.
Labor Day Spending Statistics
- During Labor Day weekend in 2024, AAA reports helped over 300,000 travelers whose vehicles broke down, according to Lending Tree.
- In 2025, only 40% of Americans planned to celebrate Labor Day.
- Additionally, 82% of people celebrating Labor Day plan to buy food, which matches the numbers for Thanksgiving and Memorial Day.
- About 91% of celebrators expect to make purchases for the holiday
- Still, 51% of those who do plan to celebrate say they will gather with friends or family.
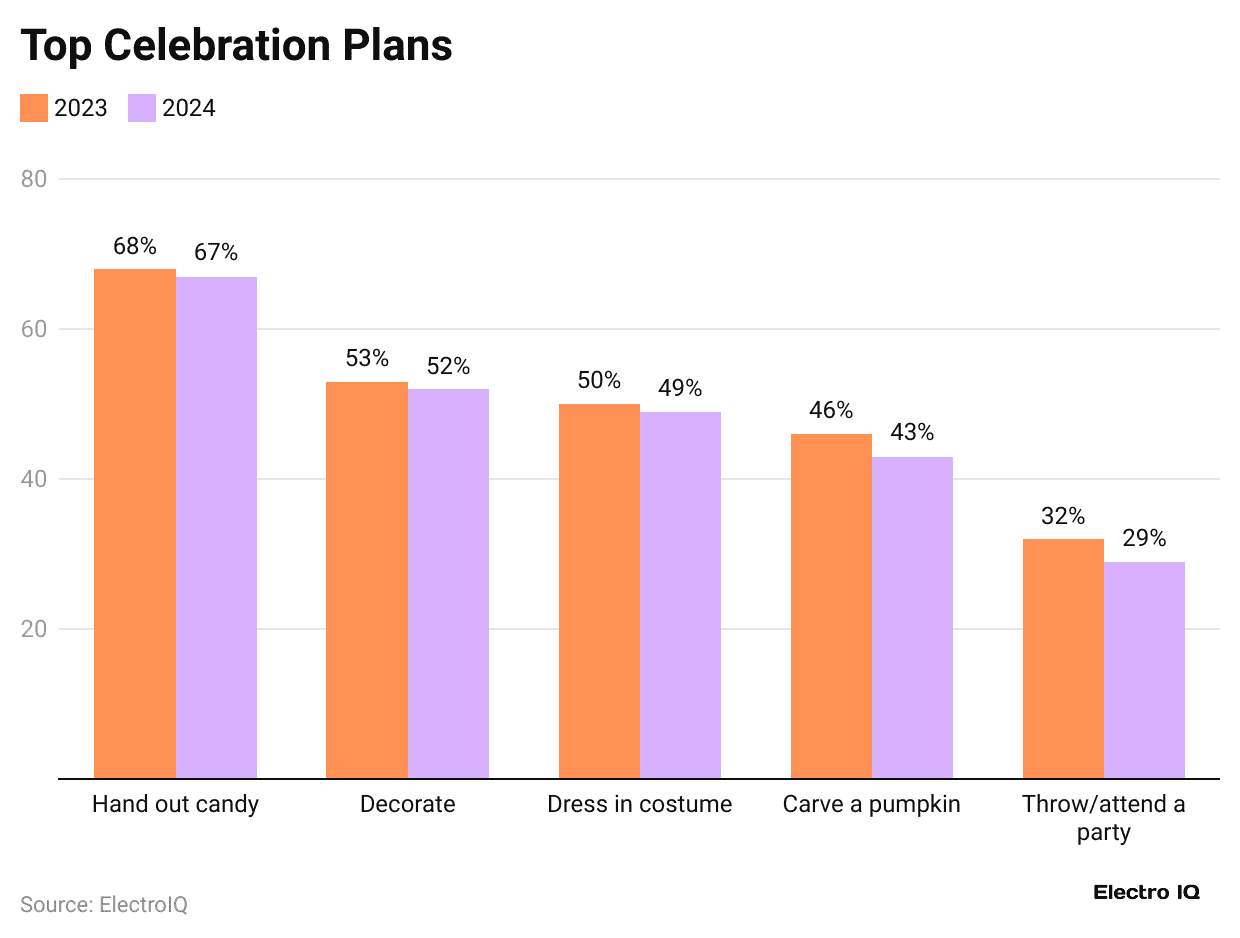
Halloween Spending Statistics
 (Reference: infogram.com)
- The above infographic states that the total spending on Halloween in 2024 was approximately USD 11.6 billion, with an average per-person spending of USD 104.
- Besides, 72% of people celebrated Halloween in the same period.
- As of 2024, Americans celebrated Halloween and spent an average of USD 172.
- The top celebration plans in 2024 were handing out candy (67%), decorating (52%), dressing up in costume (49%), carving a pumpkin (43%), and throwing or attending a party (29%).
- In contrast, the total spending is followed by costumes (USD 3.8 billion), decorations (USD 3.8 billion), Candy (USD 3.5 billion), and greeting cards (USD 0.5 billion).
Thanksgiving Spending Statistics
- According to LendingTree, people hosting Thanksgiving in 2024 have spent an average of USD 431, up from USD 361 spent in 2023.
- Approximately 51% of shoppers spent more than USD 100 on Thanksgiving 2025. Gen Z hosts were expected to spend USD 491, followed by millennials (USD 483), Gen X (USD 385), and baby boomers (USD 292).
- Out of the total, USD 265 was planned for food and drinks, and USD 166 for home items.
- S. consumers plan to spend USD 1,012 on Christmas gifts. Around 197 million people shopped during Thanksgiving weekend.
- Hopper reported round-trip flights at USD 298 and car rentals at USD 49 per day.
Christmas and New Year’s Eve Spending Statistics
- Exploding Topic further states that U.S. consumers planned to spend USD 1,012 on Christmas gifts.
- In addition to gifts, they’ll spend around USD 507 on non-gift items such as food, decorations, and experiences.
- The LendingTree report analysis also states that new year budgets vary widely, with 36% spending under USD 50, followed by 25% between USD 50 and USD 100, and 38% over USD 100.
- 93% of Americans who celebrate plan to spend on New Year’s Eve 2025, with 73% buying food and 51% purchasing alcohol.
- Grocery stores are the top choice for party supplies (51%), followed by big-box (47%) and online stores (18%).
Conclusion
This article concludes that Holiday spending is growing enormously every year, driven by rising consumer confidence, early shopping trends, and digital convenience. From gift-giving and travel to food, decorations, and entertainment, shoppers are planning ahead but still make room for last-minute purchases. Mobile shopping, flexible payments like BNPL, and seasonal sales all play a major role in shaping holiday budgets.
As spending spreads across both online and in-store channels, businesses that offer value, flexibility, and seamless experiences are best positioned to benefit during the festive season.
FAQ.
Always add new expenses during the season, such as unexpected travel, extra groceries, or last-minute gifts.
The best way to spend a holiday is to go on an adventure with a friend.
Figure out your after-tax income, choose a budgeting system, track progress, automate savings, practice budget management, allow up to 50% of your income for needs, leave 30% of your income for wants, and commit 20% of your income to savings and debt paydown.
Through huge savings, with a loan or another form of credit.
Set spending limits for the holiday season, avoid impulse purchases, start shopping early to find deals, give the gift of experiences, and give back with a charitable donation.

Maitrayee Dey has a background in Electrical Engineering and has worked in various technical roles before transitioning to writing. Specializing in technology and Artificial Intelligence, she has served as an Academic Research Analyst and Freelance Writer, particularly focusing on education and healthcare in Australia. Maitrayee's lifelong passions for writing and painting led her to pursue a full-time writing career. She is also the creator of a cooking YouTube channel, where she shares her culinary adventures. At Smartphone Thoughts, Maitrayee brings her expertise in technology to provide in-depth smartphone reviews and app-related statistics, making complex topics easy to understand for all readers.