Paramount+ Statistics And Facts (2025)
Updated · Oct 20, 2025

Table of Contents
- Introduction
- Editor’s Choice
- Paramount+ Subscribers
- Monthly Cost Of SVOD Services In The US
- Paramount+ Revenue By Segment
- Paramount+ Net Cash Flow
- SVOD Services Market Share
- Paramount+ Content Statistics
- Paramount Distribution Of Content Spending By Genre
- Paramount+ Website Traffic By Country
- Paramount+ Demographics
- Paramount+ Marketing Channels
- Paramount+ Social Network Distribution
- Paramount+ Total Assets
- Paramount+ Liabilities
- Conclusion
Introduction
Paramount+ Statistics: Paramount+ experienced significant growth in 2024, reaching 77.5 million subscribers globally, marking an increase of 10 million from the previous year. This surge was driven by strategic pricing, a strong slate of original content, and global expansion efforts. The service’s revenue for the year rose by 33% to $5.9 billion, with a 16% increase to $1.56 billion in Q4 alone.
In the third quarter, Paramount+ added 3.5 million new subscribers, contributing to its momentum. Internationally, Paramount+ expanded its offerings in Canada, Australia, and Europe, introducing new pricing tiers and premium plans to cater to diverse markets. The platform’s growth was also bolstered by exclusive content, including live sports events like the NFL and UEFA Champions League, which attracted new viewers.
Despite these gains, Paramount+ remains focused on achieving full-year domestic profitability in 2025, aiming to solidify its position in the competitive streaming landscape. This article will highlight the Paramount+ statistics and developments that shaped its 2024 performance.
Editor’s Choice
- Paramount+ experienced strong subscriber growth, increasing from 10.4 million in Q3 2019 to 77 million by Q4 2022—over a sevenfold rise in three years.
- In August 2024, Paramount+ will increase its ad-supported tier to US$7.99 (up US$2) and the Premium tier to US$12.99 (up US$1), diverging from other platforms that mainly raise ad-free prices.
- An improvement was seen in free cash flow, which surged from US$56 million in 2023 to US$489 million in 2024, hinting at operational efficiency.
- Paramount+, tied with Apple TV+ for a 9% share of the U.S. SVOD market, puts Netflix and Amazon ahead with 22% apiece.
- With an offering of 3,606 titles, Paramount+ remains oriented towards good content rather than library bulk.
- Among its content budget spends, Paramount+ makes up 28% for sci-fi and fantasy, then 17% for children/family, and 16% for crime/thrillers.
- Paramount Global’s total assets shrank by 13.8% to US$46.17 billion in 2024, with major goodwill reductions from US$16.52 billion to US$10.51 billion.
- Total current liabilities slipped slightly to US$9.63 billion in 2024, with significant declines reported for accounts payable and accrued programming costs.
Paramount+ Subscribers
(Reference: zippia.com)
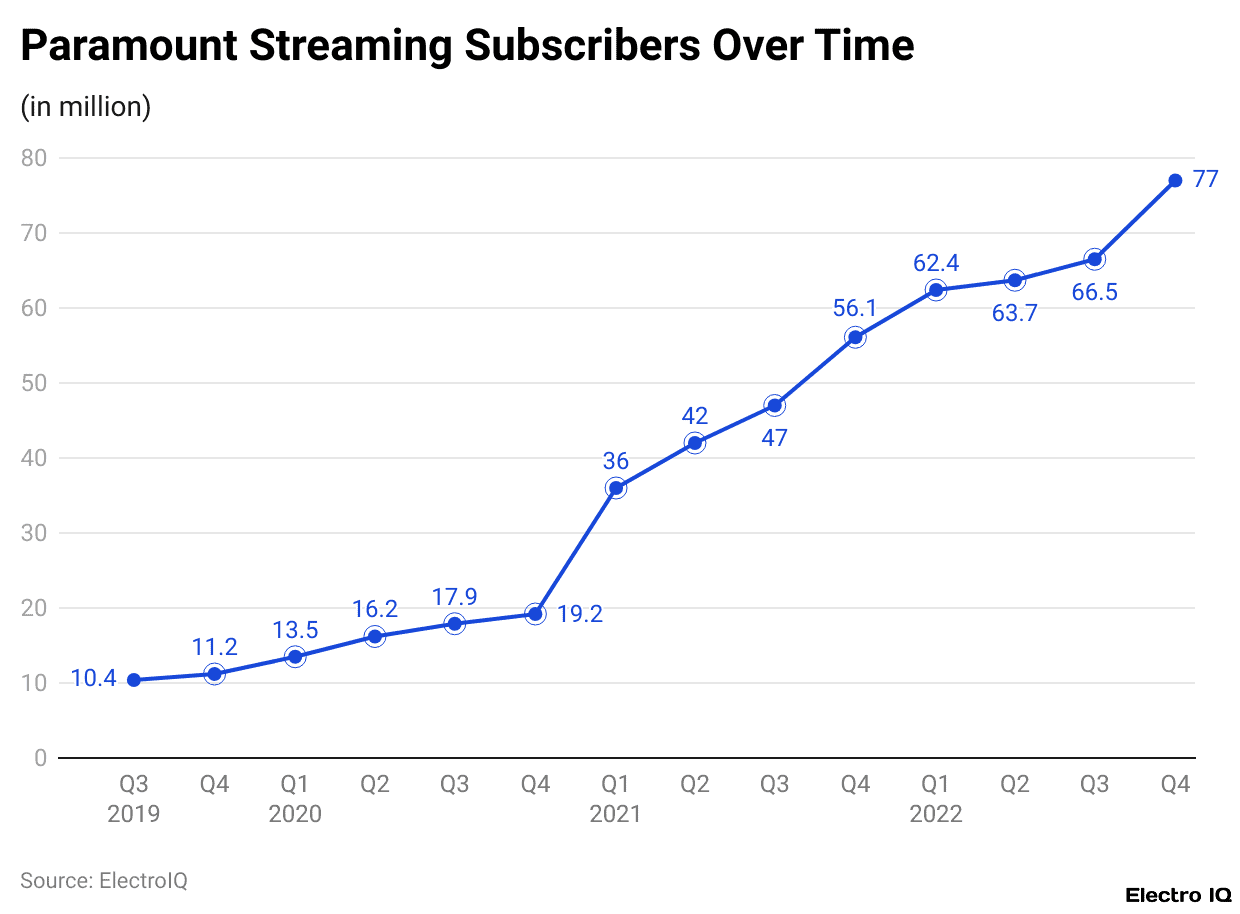
- The above Paramount+ statistics by Zippia reveal that the platform subscribers have experienced a tremendous growth rate in the track, with Paramount’s streaming service subscribers from Q3 2019 to Q4 2022.
- Beginning with 10.4 million subscribers by the end of Q3 2019, the figure rose to 11.2 million by the end of the year.
- In 2020, subscriptions increased each quarter, climbing from 13.5 million in Q1 to 19.2 million in Q4, a strong 71% increase throughout the year.
- The year 2021 saw an even acceleration in growth. Subscriber numbers went from a mere 36 million in Q1 to 56.1 million in Q4, marking an extraordinary gain of more than 55% in just one year. This is because of increased content offerings and international rollout attempts.
- The trend continued until 2022, where in Q1, it is noted Paramount had 62.4 million subscribers, rising to 63.7 million in Q2, to 66.5 million in Q3, and then to its peak at 77 million by Q4.
- A robust Q4 saw over 10 million new subscribers, the biggest quarterly increase ever recorded in the data.
- Therefore, in all, between Q3 2019 and Q4 2022, Paramount’s streaming platform grew more than seven times, from 10.4 million subscribers to 77 million subscribers.
- This prolonged rise indicates the ever-growing reach of the platform and content appeal, along with its strengthening position in the competitive streaming ecosystem.
Monthly Cost Of SVOD Services In The US
(Reference: nscreenmedia.com)
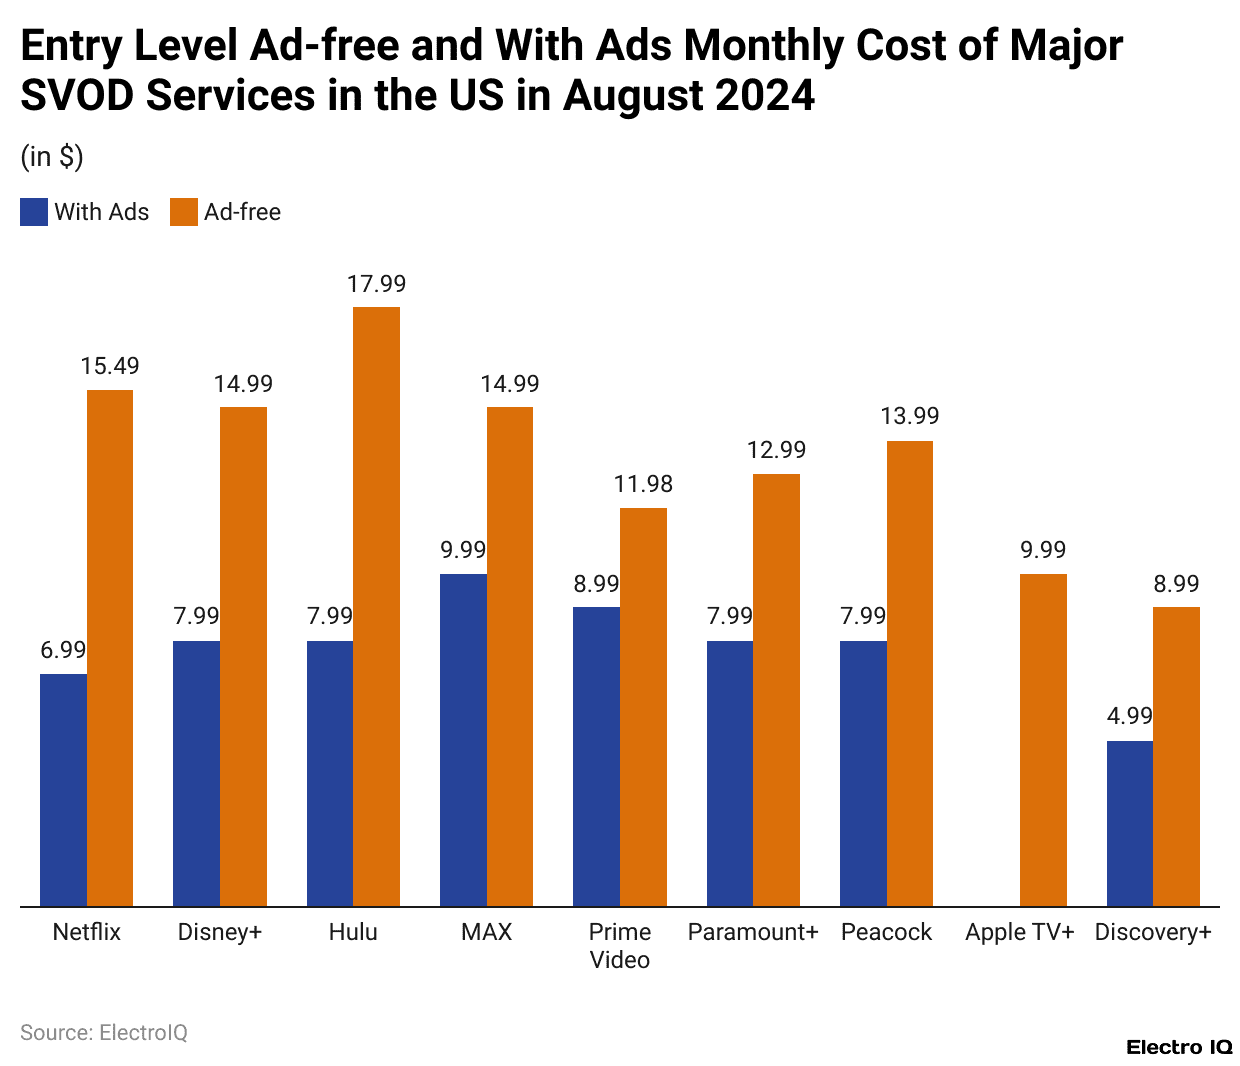
- According to a report by nscreenmedia.com on Paramount+ statistics, the new price hikes by most streaming services, Paramount+ is trying a different way.
- In August 2024, it would hike its price to US$7.99, while Premium (limited ad) would be US$1, reaching US$12.99.
- This is contrary to what is being followed by most big platforms. For example, Disney+ raised its price for ad-free subscriptions by US$4 to US$14.99/month in the absence of price changes to the ad-supported one.
- Meanwhile, Peacock will be hiking prices by US$2 for its ad-supported and premium tiers, but not for its ad-supported option.
- By raising the price of the ad-supported tier more than the price of the premium tier, Paramount+ may be signaling some shift in value radius-signalling, maybe to discourage subscription to the premium tier or increase revenue for ad-supported users who cost less for Paramount but generate more ad revenue.
- Whatever the case with these two price hikes, it is safe to say that streaming via SVOD, such as Paramount+ and Peacock, is still far less expensive than traditional cable TV, which can go for anything upward of US$70-US$100 per month.
Paramount+ Revenue By Segment
(Source: ir.paramount.com)
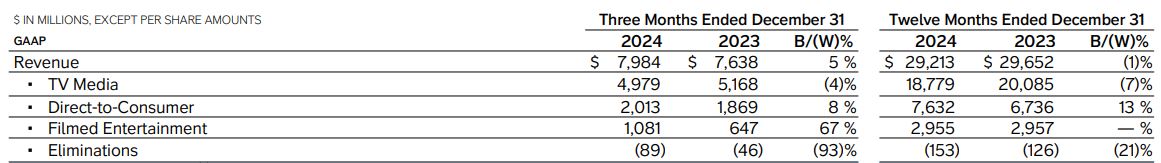
- The Company’s annual financial data on Paramount+ statistics shows its Global performance for the fourth quarter and the full year ending December 31, 2024, broken down by revenue segments and compared to 2023.
- Paramount’s revenues amounted to US$7.984 billion during the fourth quarter of 2024, up 5% from US$7.638 billion in the fourth quarter of 2023, with Filmed Entertainment and Direct-to-Consumer segments accounting for most of this rise.
- In comparison, the TV Media segment, which includes traditional broadcasting and cable channels, brought in US$4.979 billion in Q4 2024, down 4% versus US$5.168 billion in the year-ago period.
- The Direct-to-Consumer segment, led by Paramount+, posted an 8% increase in revenue to US$2.013 billion from US$1.869 billion.
- Filmed Entertainment saw a large 67% year-over-year surge from US$647 million to US$1.081 billion, buoyed by strong movie releases.
- However, Eliminations, internally offsetting revenues between segments, increased on an absolute basis to minus US$89 million, nearly double the minus US$46 million of the previous year.
- Looking at the full year 2024, total revenue slightly declined by 1%, from US$29.652 billion in 2023 to US$29.213 billion.
- The drop was mainly due to a 7% decline in the TV Media segment, which fell from US$20.085 billion to US$18.779 billion, reflecting ongoing challenges in traditional TV advertising and viewership.
- Paramount+ statistics reveal that the Direct-to-Consumer segment had a 13% growth, increasing from US$6.736 billion in 2023 to US$7.632 billion in 2024, owing to the robust performance and increased subscribers of Paramount+.
- Filmed Entertainment revenues remained at about US$2.955 billion, and eliminations increased from US$126 million to US$153 million, up 21%, an indication of increased internal overlapping revenue across segments.
Paramount+ Net Cash Flow
(Source: ir.paramount.com)
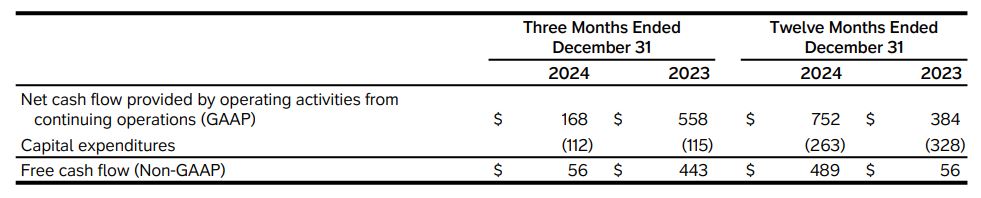
- The company data on Paramount+ statistics shows how the platform calculates its free cash flow by adjusting its net cash flow from its operating activities.
- For the quarter ended December 31, 2024, the company generated US$168 million of operating cash flow, compared to US$558 million for the same period of 2023.
- After deducting capital expenditure of US$112 million in Q4 2024 (against US$115 million in Q4 2023), free cash flow was US$56 million, compared to US$443 million in Q4 2023.
- For all of 2024, Paramount had US$752 million in operating cash flow, up from US$384 million in 2023.
- Capital expenditure for the year was US$263 million, down from US$328 million in 2023. After making these adjustments, the company posted a free cash flow of US$489 million for 2024, a much bigger chunk of change compared to the US$56 million free cash flow in 2023.
- This, however, implies operational and capital efficiency growth throughout the year, although Q4 remained poor.
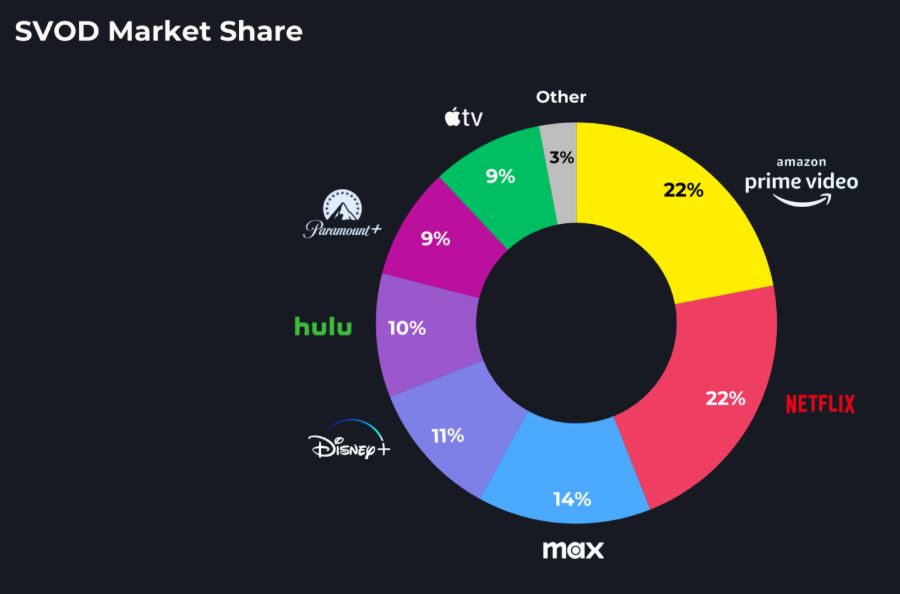
(Source: evoca.tv)
- The above chart depicts the market share division among principal SVOD platforms in the United States. At the very top are Amazon Prime Video and Netflix, each capturing 22% of the market share. Max stands third at 14%, with Disney+ next at 11% and then Hulu at 10%.
- Following closely behind Paramount+ and Apple TV+, each taking 9%, are the other smaller and niche streaming services, holding a 3% block.
- The data points towards a quite competitive landscape, neither of the platforms enjoying dominance, while a handful of them control a big chunk of the market.
Paramount+ Content Statistics
- According to a report by Statista on Paramount+ statistics, the platform currently boasts 3,606 content titles, ranking eighth among major SVOD platforms by content volume.
- Its library is smaller when compared with the giants of Amazon Prime Video, with 10,872 titles, and Disney+ and Hulu, with 9,578 titles, but Paramount+ holds its own on the strength of its franchises and exclusives.
- A clear and shining example would be Sonic the Hedgehog 3–now approaching US$500 million at the global box office, making it the highest-grossing picture of the Sonic franchise and putting it in the top 10 releases by Paramount Pictures in terms of box office revenue in the past decade.
- This level of success showcases how much a handful of hit titles can raise the profile of a platform, consequently outweighing the disadvantages of having comparatively fewer titles than its competitors.
- Other giants whose catalogues boast greater numbers than Paramount Plus include Netflix at 8,391 titles, Hulu at 7,250, Max at 6,928, Peacock at 6,411, and Discovery+ at 6,132. Disney+, offered separately, has 2,525 titles.
- Paramount+ looks to be strategic, high-performing content versus just volume.
Paramount Distribution Of Content Spending By Genre
- Statista’s recent report on Paramount+ statistics shows that Paramount+ spends most heavily on science fiction and fantasy, which receives 28% of the content investments. This indicates a large emphasis being placed upon immersive high-concept storytelling aimed at niche fanbases.
- Crime and thriller genres come next with 16%, reflecting continued interest in suspenseful, plot-driven storytelling.
- Children and family content comprises 17%, suggesting a strategy to target households and younger viewers.
- Comedy accounts for 10% while drama holds 7%, which is comparatively lower than most streaming services that tend to focus on dramatic storytelling.
- Romance and documentaries each get 9%, indicating an attempt to nurture niche yet loyal audiences in balance.
- Action and adventure, quite surprisingly, are allocated only 2%, signalling that it’s not really of interest to Paramount+. Uncategorised content, showing a minimal investment outside the core genres.
Paramount+ Website Traffic By Country
(Reference: similarweb.com)
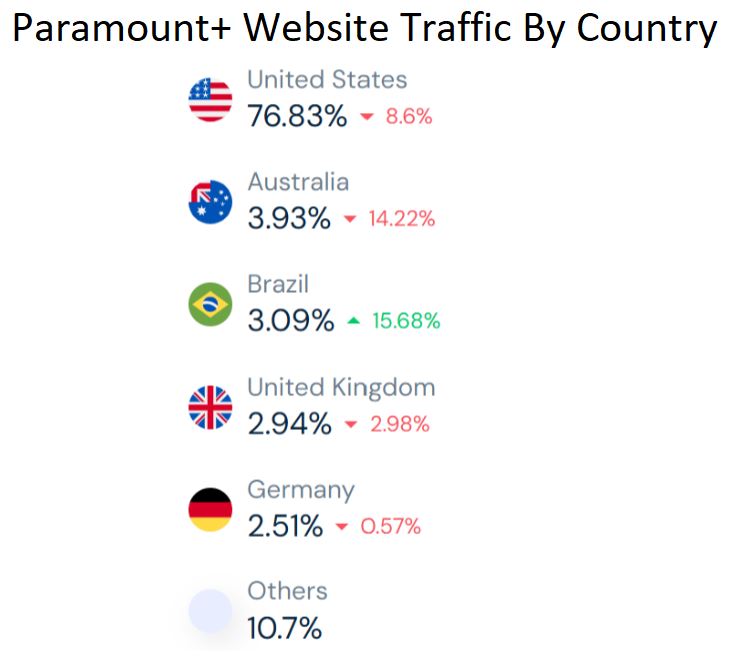
- According to Paramount+ statistics by Similarweb, the U.S. dominates, accounting for almost three-fourths of the total website traffic.
- Meanwhile, the U.S. saw an 8.6% decline in traffic, perhaps signaling market saturation or waning interest.
- The next-largest market is Australia, accounting for 3.93% of traffic, with a major growth spurt at 14.22% hinting at a burgeoning market or interest.
- Brazil holds 3.09% of traffic, with a higher growth rate of 15.68%, indicating even stronger momentum from Latin America.
- The United Kingdom accounts for 2.94% of the total London traffic, but only managed a modest 2.98% growth.
- Germany constitutes 2.51% of traffic; growth, on the other hand, gets appreciably lower at 0.57%.
- The rest of 10.7% is traffic from other countries, showing some small but diverse international presence.
- From these Paramount+ statistics numbers, we can infer that Paramount+ may still be largely U.S.-centric, but there are forces of traction in other markets, especially in Australia and Brazil.
Paramount+ Demographics
(Source: similarweb.com)
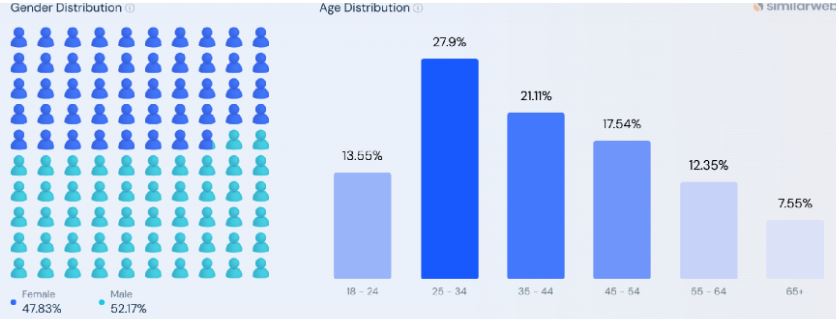
- The demographic data for Paramount+ shows an almost equitable distribution across genders: 52.17% male and 47.83% female.
- On the age side, it is most popular with the 25 to 34 demographic group, considering 27.9% of the viewers.
- The following are the groups of 35 to 44 and 45 to 54, which constitute 21.11% and 17.54%, respectively.
- Young adults in the age category of 18 to 24 make up 13.55% of the users, while older crowd-wise, 55 to 64-year-olds make a presence of 12.35%, and those above 65 are accounted for at merely 7.55%. This indicates that Paramount+ tends to cater mainly to younger and middle-aged crowds in their late 20s to the early 40s.
Paramount+ Marketing Channels
(Reference: similarweb.com)
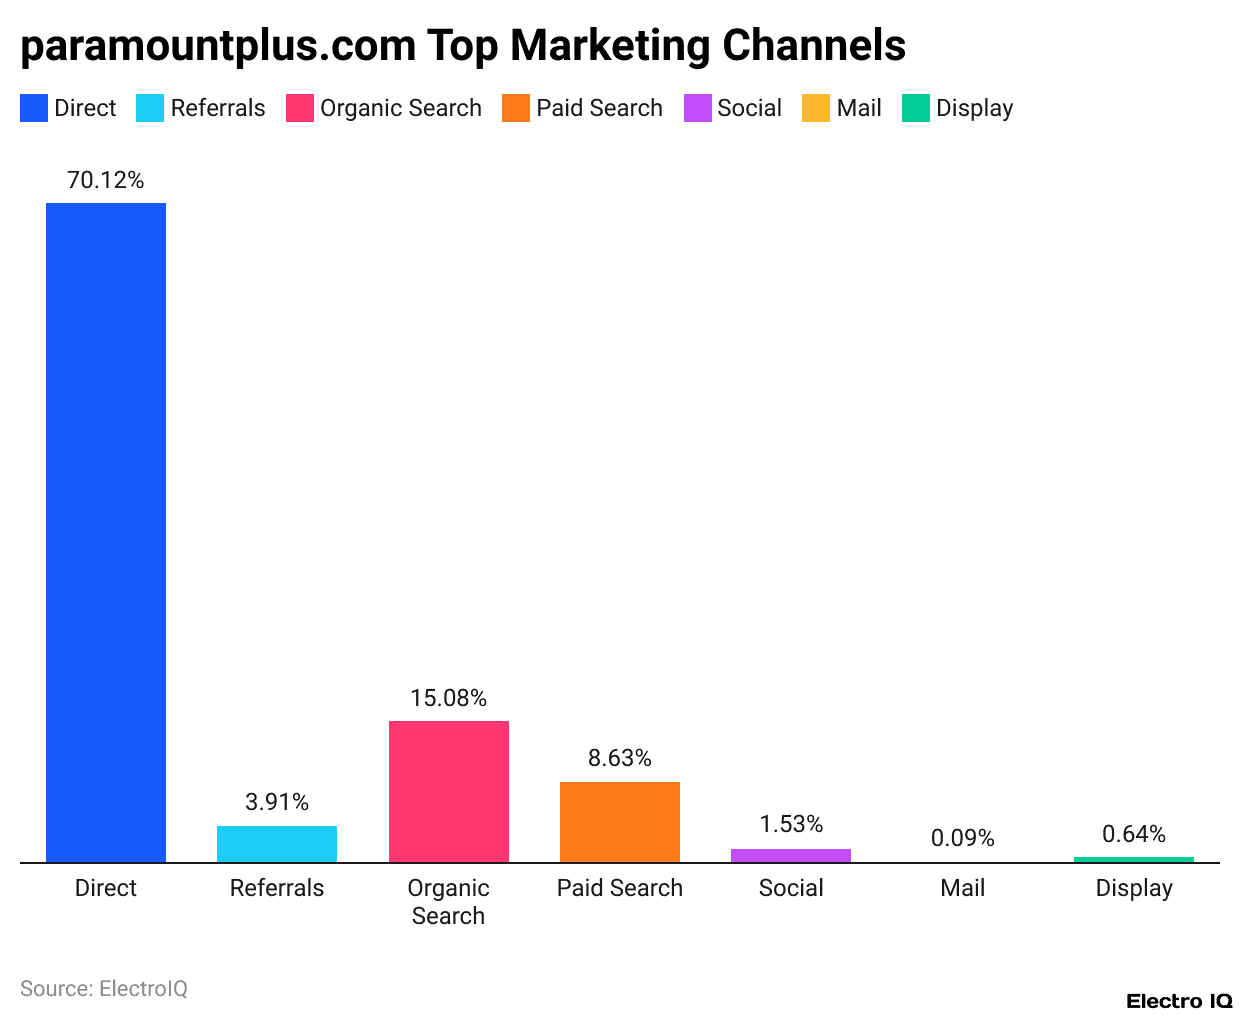
- At this time, Paramount+ can lure viewers via different marketing channels.
- The highest percentage also belongs to direct traffic at 70.12, an indication that users geographically type in the URL, click a favourite icon link, or land on the site directly through other channels.
- Organic search forms 15.08%, thus an indication that people could also come to Paramount+ via search engines, but unpaid ones.
- Paid search gives 8.63%, and this is an indication that some traffic comes from advertisements on search engines.
- Referrals are 3.91%, indicating that visitors come to the site via links on other websites.
- This is followed by social at 1.53%, display ads at 0.64%, and email campaigns at 0.09%, indicating that email marketing is the least used channel.
Paramount+ Social Network Distribution
(Reference: similarweb.com)
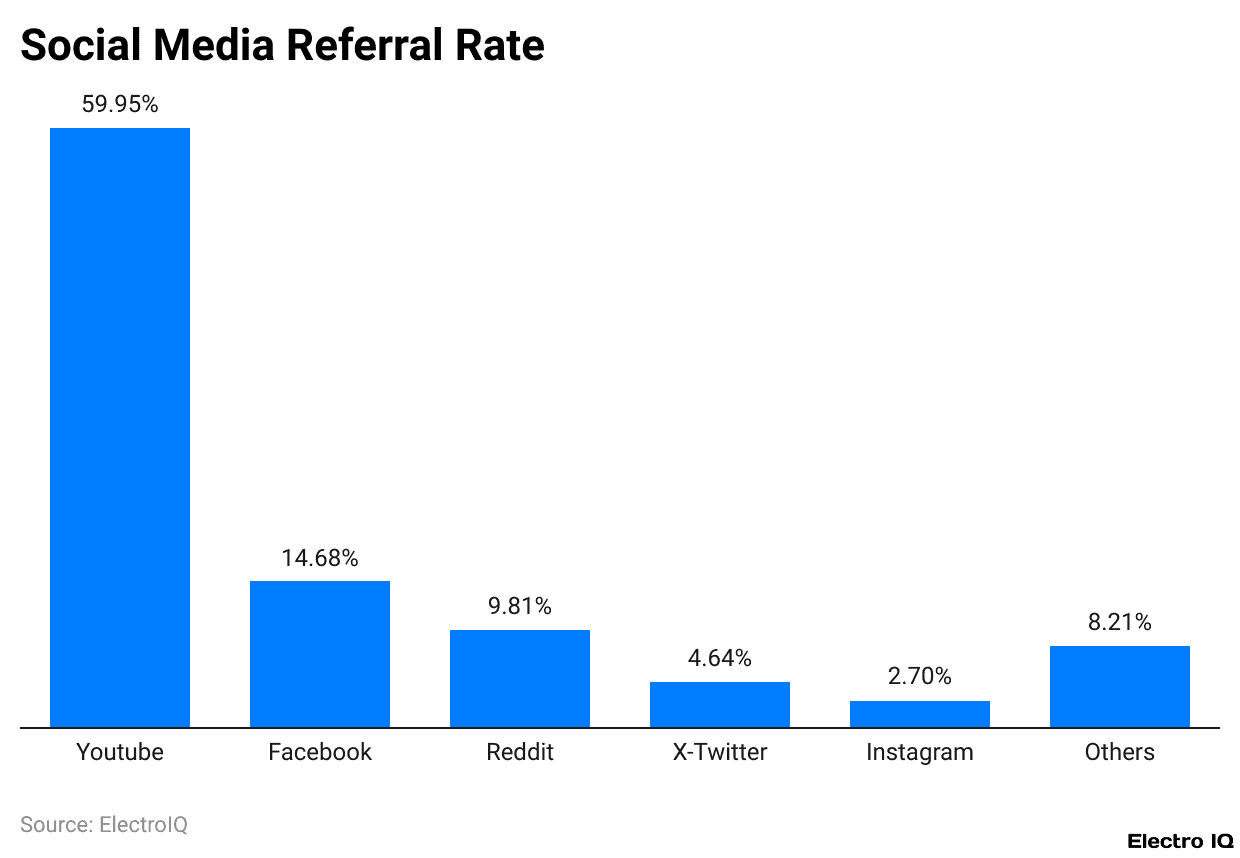
- Concerning social media, YouTube commands the lion’s share, accounting for a 38.48% share of the total traffic.
- This implies a greater presence or engagement in video content.
- Reddit is the second major source in the share, providing about 16.94%, which probably implies active conversations on the subreddit or community posts on Twilio.
- LinkedIn and Facebook come close to each other with 11.91% and 11.86%, respectively, whereas online and professional engagement get mixed.
- WhatsApp has a traffic contribution of 10.96%, standing at an average level in direct or shared messaging.
- The remaining 9.86% is cast onscreen by other social portals that have not been mentioned one by one, signifying a much diversified, although small, share of the traffic.
Paramount+ Total Assets
(Source: ir.paramount.com)
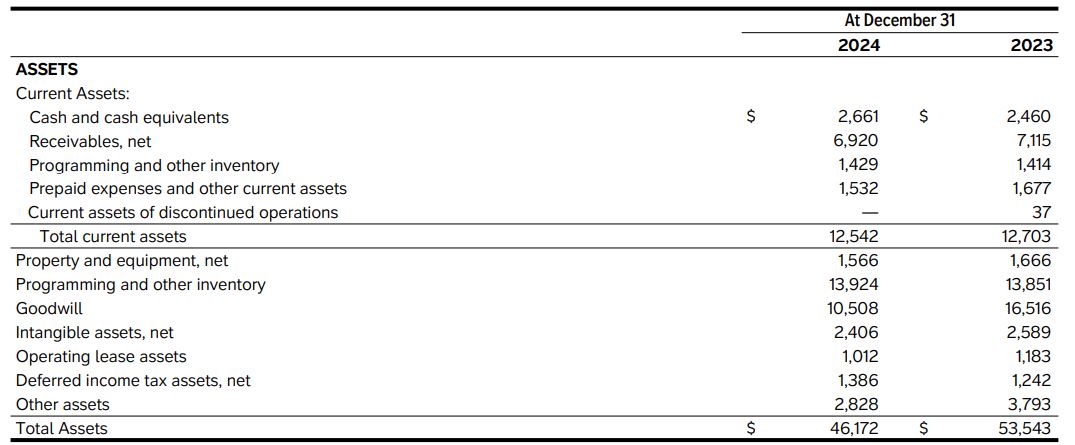
- The company’s report on Paramount+ statistics shows the platform’s total assets as of December 31 for the years 2024 and 2023.
- Total assets fell to US$46.17 billion in 2024 compared with US$53.54 billion in 2023, registering approximately a 13.8% decline.
- On the current asset front, the total in 2024 was US$12.54 billion, slightly down from US$12.70 billion seen the previous year.
- Cash and cash equivalents for the year climbed to US$2.66 billion from US$2.46 billion, showing a stronger cash position.
- However, accounts receivable fell from US$7.12 billion to US$6.92 billion, as did prepaid expenses. Current assets from discontinued operations also declined, from US$37 million to zero, probably indicating either the divestiture of that business or the closure of that segment.
- Noncurrent assets witnessed some strong movements. Goodwill saw a steep reduction from US$16.52 billion to US$10.51 billion, which may indicate that some write-downs or revaluation of acquisitions in the past were recorded.
- Property and equipment also shrank marginally, and intangible assets declined from US$2.59 billion to US$2.41 billion.
- Other assets also suffered a hit, falling from US$3.79 billion to US$2.83 billion, indicating an overall tightening in asset values or restructuring.
- The fall in total assets could be because Paramount Global is downsizing its operations, writing down assets that have become overvalued, or disposing of some less profitable segments to set the stage for strategic changes.
Paramount+ Liabilities
(Source: ir.paramount.com)
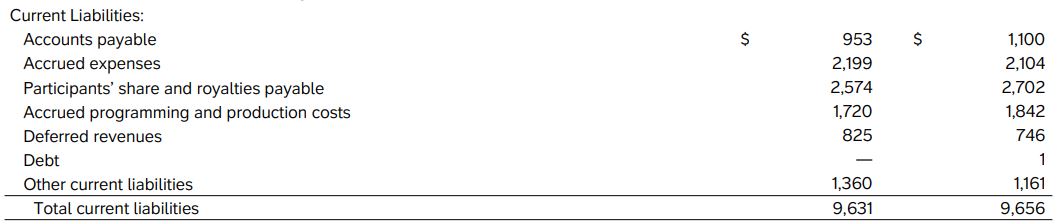
- Total current liabilities at Paramount Global come to US$9.63 billion, marking a slight decrease from US$9.66 billion in 2023, which means a US$25 million reduction year over year.
- The accounts payable amount dropped from US$1.1 billion to US$953 million, indicating that the company’s outstanding bills to suppliers have been reduced.
- Accrued expenses rose marginally from US$2.104 billion to US$2.199 billion, thus indicating growing outstanding obligations under items such as salaries or interests.
- Participants’ share and royalties payable were slightly down from US$2.702 billion to US$2.574 billion, showing marginal declines in sums paid out to content creators.
- Accrued programming and production costs also dropped from US$1.842 billion to US$1.720 billion, likely due to declines in production activity or better cost control.
- Deferred revenues, representing monies received in advance of services, grew to US$825 million from US$746 million, possibly meaning an increase in advance subscription payments or advance license fees.
- No current liabilities were recorded for debts, decreasing from US$1 million to nil.
- Other current liabilities increased from US$1.161 billion to US$1.360 billion, which could have been caused by an increase in short-term obligations that could not be classified elsewhere.
Conclusion
The Paramount+ statistics witnessed significant subscriber growth, revenue augmentation, and rising user engagement in 2024. It further has content investments and international expansion in the wings for continued success, but adversities remain with fluctuations in the advertising market and exorbitant content costs. Paramount+ must capitalise on its profitability and global reach as it heads into 2025 to keep its rising trend.
FAQ.
As per Q4 2022, Paramount+ counted 77 million subscribers, substantially rising from 10.4 million in Q3 2019; this is a surge of over 700% in a little over three years. This growth of the platform is now driven by international rollout strategies, exclusive content acquisition, and increased marketing.
Beginning August 2024, Paramount+ will increase Basic (ad-supported) plan rates to US$7.99 and Premium (limited ads) to US$12.99. Unlike other platforms such as Disney+ and Peacock that increased prices for ad-free tiers, Paramount+ is actually raising the ad-supported tier price more, perhaps to nudge consumers toward higher-tier subscriptions or to maximise monetisation from ad-supported users.
The Direct-to-Consumer segment of Paramount, encompassing Paramount+, collected revenues to the tune of US$7.632 billion in 2024, marking a 13% increase over 2023. Meanwhile, free cash flow grew literally by leaps and bounds, from US$56 million to US$489 million, truly a reflection of heightened operating efficiencies and stricter capital controls, despite a softer fourth quarter.
Paramount+ is a genre- and family-driven service, with 28% of its programming budget going to sci-fi/fantasy, 17% to children/family shows, and 16% to crime/thrillers. It offers about 3,606 titles and ranks 8th by volume among major SVOD services, but it does prioritise big-bang franchises, e.g., Sonic the Hedgehog 3, which has recently garnered nearly US$500 million worldwide.
The true core of the audience is a large youth population aged between 25 and 34 years (27.9%), followed by another sizeable chunk aged 35 to 44 years (21.1%), and the gender split for viewers is almost equal. Still, the U.S. contributes 76.83% of all traffic, and in 2024, emerging markets, especially Australia and Brazil, recorded 14.22% and 15.68% growth on the Paramount+ platform, thus suggesting a strong international appeal.

Maitrayee Dey has a background in Electrical Engineering and has worked in various technical roles before transitioning to writing. Specializing in technology and Artificial Intelligence, she has served as an Academic Research Analyst and Freelance Writer, particularly focusing on education and healthcare in Australia. Maitrayee's lifelong passions for writing and painting led her to pursue a full-time writing career. She is also the creator of a cooking YouTube channel, where she shares her culinary adventures. At Smartphone Thoughts, Maitrayee brings her expertise in technology to provide in-depth smartphone reviews and app-related statistics, making complex topics easy to understand for all readers.