Television Statistics By Market Size, Rating, Viewing Share and Facts (2025)
Updated · Nov 19, 2025


Table of Contents
- Introduction
- Editor’s Choice
- Televisions Market Size
- Televisions Revenue Comparison By Country
- Broadcast TV Marketing Statistics
- Smart Television Market Size
- AI TV Market Size
- Satellite TV Marketing Statistics
- Television Rating Statistics
- Television Viewing Share Statistics
- Television Viewship Statistics
- Cable TV Subscriber Statistics
- Cable TV Household Statistics
- Cord-Cutting Households Statistics
- Leading TV and Movie Award Shows In The US By TV Viewers (From 2023 to 2025)
- Conclusion
Introduction
Television Statistics: Television gained popularity in the late 19th and early 20th centuries and has evolved from a simple box in the living room into one of the most powerful mass communication mediums. It influenced a global audience by shaping how people perceive the world, enabling them to understand current events and interact more effectively with one another.
This article presents several current statistical analyses from various sources, covering overall market growth, user demographics, usage patterns, technological advancements, sustainable initiatives, and other relevant factors. Hopefully, the overall article will help you understand recent television marketing trends and their impacts.
Editor’s Choice
- According to a Statista report, the global television market generated approximately USD 96.82 billion in revenue in 2025.
- The United States television market is expected to earn about USD 18.34 billion in revenue.
- In Asia, the telephone market revenue is about USD 31.50 billion, with a CAGR of -0.93% from 2025 to 2030.
- According to amraandelma.com, the global market size of broadcasting & cable TV has reached around USD 356.45 billion and is estimated to reach USD 449.91 billion by 2030, along with a CAGR of 4% from 2025 to 2030.
- The market valuation of smart TVs in 2025 is estimated to be USD 270.6 billion.
- As mentioned in Amra & Erma, the global satellite TV market was valued at around USD 93.6 billion as of 2024.
- For cost effectiveness, 44% of US advertisers said CTV/OTT is more effective, 45% said it is comparable, and 11% said it is less effective than linear TV.
- According to a report published by Cable Compare, by the end of 2025, cable TV will be subscribed to by 68.7 million American households.
- In 2025, the Academy Awards (also known as the Oscars) remained the most-watched TV and movie award show in the United States, with approximately 19.7 million viewers.
Televisions Market Size
- According to a Statista report, the global television market generated approximately USD 96.82 billion in revenue in 2025.
- From 2025 to 2030, it is expected to decrease slightly, with a growth rate of 0.38%.
- The United States is the biggest market, with revenue of about USD 18.3 billion in 2025.
- At the same period, the revenue per person is around USD 12.34.
- In 2026, unit sales are expected to grow by 0.8%.
- For 2025, this translates to approximately 0.033 TV units per person.
- By the end of 2030, the market volume is expected to reach approximately 262.43 million TV units.
Televisions Revenue Comparison By Country
- The United States television market is expected to generate USD 18.34 billion in 2025, and the sector is projected to grow at a slow pace of about 0.49% per year through 2030. Each person in the country is estimated to spend USD 52.81 on televisions during 2025, with an average usage level of 0.120 units per person. Sales volume in 2026 is predicted to rise by around 1%, and total television units are expected to reach 43.30 million by 2030.
- China’s television market is forecast to reach USD 14.65 billion in 2025, with a 3.17% decline expected through 2030. Revenue per person is estimated at USD 10.29, and the average usage level is 0.034 units per person. Sales volume in 2026 is set to fall by about 0.7%, with the market reaching 46.28 million units by 2030.
- The United Kingdom is expected to produce USD 5.91 billion in revenue from televisions in 2025, and the market is projected to contract by 0.72% annually through 2030. Each person is estimated to spend USD 85.04, and the average use is 0.114 units per person. Volume growth in 2026 is expected to fall by 0.8%, with a total of 7.79 million units in 2030.
- Japan’s television market is projected to generate USD 5.87 billion in 2025, growing at a steady 2.98% per year through 2030. Spending per person is expected to reach USD 47.70, and the average use is 0.065 units per person. Sales volume in 2026 is forecasted to increase by 1.3%, with total units reaching 8.74 million by 2030.
- Germany’s television sector is estimated to earn USD 4.43 billion in 2025, with the market declining slightly at 0.62% per year until 2030. Each person is expected to spend USD 52.66, and per-person usage is calculated at 0.087 units. Volume growth in 2026 is projected to rise by 0.7%, with the market reaching 7.45 million units by 2030.
Furthermore, other four countries market analysis (2025) is stated in the table below:
| Country | Revenue (USD) |
CAGR (2025 to 2030) |
Revenue per person (USD) |
Average volume per person (pieces units) |
volume growth (2026) |
Market volume (2030) (million units) |
| China | 14.65 billion | -3.17% | 10.29 | 0.034 | -0.7% | 46.28 |
| United Kingdom | 5.91 billion | -0.72% | 85.04 | 0.114 | -0.8% | 7.79 |
| Japan | 5.87 billion | +2.98% | 47.70 | 0.065 | +1.3% | 8.74 |
| Germany | 4.43 billion | -0.62% | 52.66 | 0.087 | +0.7% | 7.45 |
By Region
Other regional analyses are mentioned in the table below:
| Region | Revenue (USD) |
CAGR (2025 to 2030) |
Revenue per person (USD) |
Average volume per person (pieces units) |
volume growth -2026 |
Market volume (million units) 2030 |
| Africa | 2.64 billion | -0.33% | 1.96 | 0.009 | 1% | 13.29 |
| Americas | 29.20 billion | -0.30% | 28.56 | 0.071 | 0.50% | 73.96 |
| Australia & Oceania | 1.90 billion | 0.62% | 43.17 | 0.063 | 1.70% | 2.9 |
| Caribbean | 454.03 million | -1.37% | 11.23 | 0.039 | -0.30% | 1.59 |
| Europe | 31.59 billion | 0.02% | 37.24 | 0.069 | 1.30% | 61.12 |
- In Asia, the telephone market is expected to generate USD 31.50 billion in revenue, and the market is projected to decline slightly with a CAGR of -0.93% from 2025 to 2030. The spending per person is USD 6.87, while the average number of phones per person is 0.024 units. The total volume is forecast to rise by 0.6% in 2026, and by 2030 the region is estimated to reach 111.16 million units.
- In Africa, the telephone market is valued at USD 2.64 billion, and the long-term trend shows a mild decline with a CAGR of -0.33%. Individuals spend around USD 1.96 per person, and the average usage level is 0.009 units per person. Volume growth is expected to be 1% in 2026, and the market could reach 13.29 million units by 2030.
- In the Americas, telephone revenue stands at USD 29.20 billion, and the market is set to fall slightly with a CAGR of -0.30%. The region records USD 28.56 revenue per person, and the average volume is 0.071 units per person. A modest 0.50% volume rise is expected in 2026, and the market volume may reach 73.96 million units by 2030.
- In Australia and Oceania, revenue totals USD 1.90 billion, and growth is positive with a CAGR of 0.62%. Spending per person reaches USD 43.17, while the average number of phones per person is 0.063 units. The market volume is forecast to expand by 1.70% in 2026, and total units could rise to 2.90 million by 2030.
- In the Caribbean, revenue is USD 454.03 million, and the market is projected to decline with a CAGR of -1.37%. The region generates USD 11.23 per person, and the average volume per person is 0.039 units. A slight -0.30% drop in volume is expected in 2026, and by 2030 the region could reach 1.59 million units.
- In Europe, the telephone market produces USD 31.59 billion in revenue, and growth remains stable with a CAGR of 0.02%. Revenue per person is USD 37.24, and the average number of units per person is 0.069. Volume growth is expected to be 1.30% in 2026, and the market may reach 61.12 million units by 2030.
Broadcast TV Marketing Statistics
- According to amraandelma.com, the global market size of broadcasting & cable TV has reached around USD 356.45 billion and is estimated to reach USD 449.91 billion by 2030, along with a CAGR of 4% from 2025 to 2030.
- As of 2024, the North American region held the largest share in the broadcasting market, at 40%.
- Meanwhile, the revenue share captured by Advertising was 74.8% and Connected TV Households (85%).
- In 2025, global CTV spending is expected to reach approximately USD 48 billion.
- Meanwhile, linear TV Ad spending declined by 13%, cable TV viewership reduced by 10% and broadcast prime-time declined by 15%.
- Despite cord-cutting, broadcast and cable TV still reach 72% of adults monthly.
- As of 2025, streaming platforms recorded 22% higher engagement and ad revenue.
- On connected TVs, most viewers finish almost all videos, with around 96% to 98% watched.
- By 2025, the number of US connected TV users is expected to reach 200.8 million.
- Approximately 118 million Americans will watch live sports through streaming services.
- By 2026, more than 80 million US homes are expected to cancel cable service.
- Around 64% of US CTV viewers choose ads to reduce streaming costs.
- By 2025, approximately 164 million Americans are expected to regularly watch AVOD online videos.
- By Q1 2025, ad-supported plans formed 57% of all new subscriptions worldwide.
Smart Television Market Size
(Source: futuremarketinsights.com)
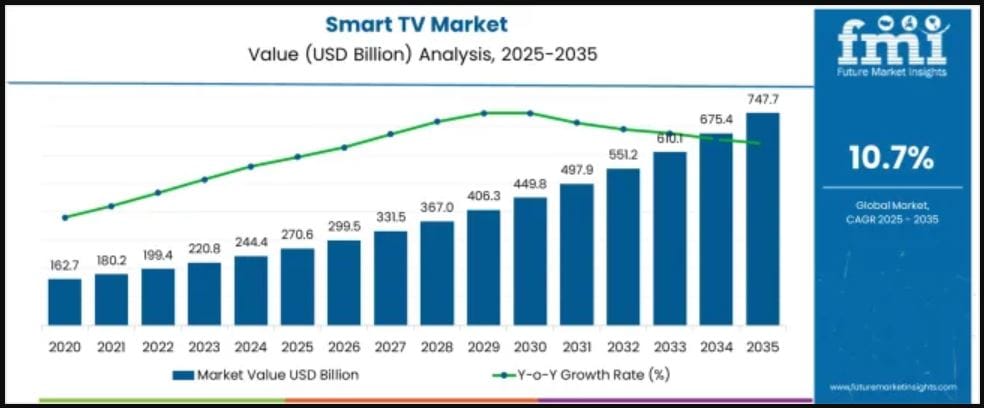
- The market valuation of smart TVs in 2025 is estimated to be USD 270.6 billion.
- The estimated valuations in the coming years: 2026 (USD 299.5 billion), 2027 (USD 331.5 billion), 2028 (USD 367 billion), 2029 (USD 406.3 billion), 2030 (USD 449.8 billion), 2031 (USD 497.9 billion), 2032 (USD 551.2 billion), 2033 (USD 610.1 billion), 2034 (USD 675.4 billion) and 2035 (USD 747.7 billion).
- The Smart TV industry is forecasted to grow at a CAGR of 10.7% from 2025 to 2035.
- Depending on the country, the market value CAGR (from 2025 to 2035) is forecasted to be 13.1% in South Korea, 12.4% in Japan, and 11.9% in the United Kingdom.
By Operating System
(Source: futuremarketinsights.com)
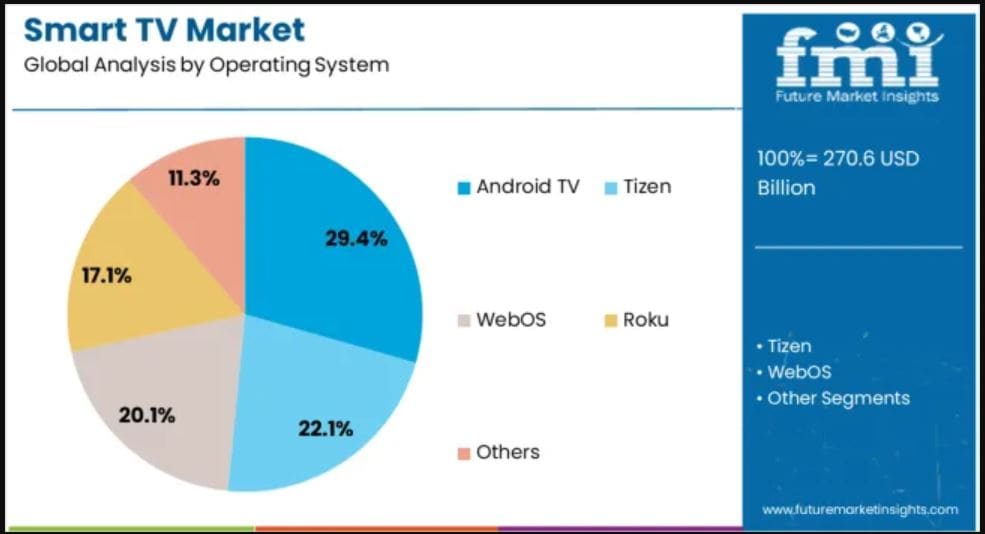
- As of 2025, the Android TV segment is expected to account for 29.40% of the operating system category.
- Furthermore, the market share of other operating systems is estimated to be Tizen (22.1%), WebOS (20.1%), Roku (17.1%), and others (11.3%).
By Resolution
- According to Future Market Insights, the 4K UHD TV segment will account highest market share with 42.7% by 2025.
- Other resolutions in the Smart TV market share include HD TV (23.7%), Full HD TV (21%), and 8K TV (12.6%).
By Screen Size
- Based on screen size, the 46- to 55-inch category is expected to capture a 33.6% share in 2025.
- Furthermore, the market share of other screen size categories is estimated to be below 32 inches (20.2%), 32 to 45 inches (18.8%), 56 to 65 inches (17.7%), and above 65 inches (9.7%).
AI TV Market Size
- The global market for AI TVs is projected to reach USD 56.41 billion by 2034, up from USD 6.67 billion in 2024, reflecting steady growth at a 23.8% CAGR over the forecast period. North America accounted for 32.4% of global revenue in 2024, equal to USD 2.16 billion, showing strong early adoption of smart television technologies.
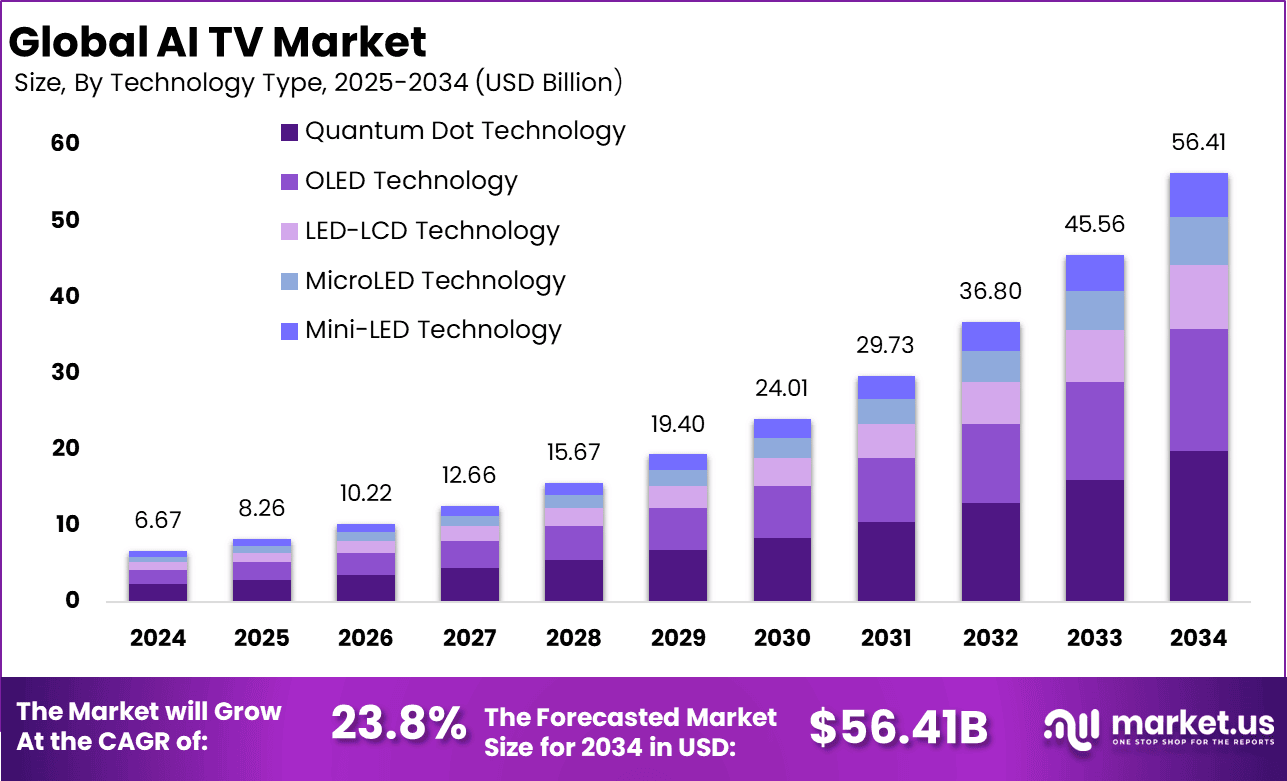
- A 35.2% share is generated by quantum dot technology, which shows that buyers prefer better color accuracy and sharper picture performance in advanced AI TVs.
- Screen sizes between 32 and 43 inches contribute 32.6% of the market, indicating continued demand for compact and cost-effective smart TVs suitable for most households.
- Residential users drive 38.8% of global demand, confirming that AI TVs have become standard home entertainment devices with intelligent features and improved content personalization.
- Wi-Fi-enabled models represent 35.5% of overall sales, suggesting that consumers value easy connectivity and seamless access to streaming platforms.
- Mid-range AI TVs priced between USD 500 and USD 1,000 make up 40.6% of total demand, as buyers look for a balance between affordability and advanced smart capabilities.
- North America accounts for 32.4% of the global market due to strong digital habits and a large customer base familiar with streaming services and smart home ecosystems.
- The United States continues to lead the region, supported by a 20.7% CAGR, which signals rising interest in AI-powered televisions with features such as intelligent upscaling, voice control, and personalized content recommendations.
Satellite TV Marketing Statistics
- As mentioned in Amra & Erma, as of 2024, the global satellite TV market was valued at around USD 93.6 billion.
- However, it is expected to decline to around USD 86.85 billion by 2033, resulting in a negative annual growth rate of -1.23%.
- In the United States, satellite TV providers generated approximately USD 40.2 billion in 2024, following a decline of about 6.4% per year over the last five years.
- Satellite TV is expected to still hold approximately 42.7% of the broadcasting and cable TV market in 2024.
- North America accounts for more than 40% of the global satellite TV revenue, with a market size of approximately USD 38.06 billion, while Europe holds over 30%, or around USD 28.54 billion.
- Traditional pay TV, including satellite, lost approximately 6 million customers in one year, resulting in an 11% drop in Q1 2025, with 49.6 million pay TV subscriptions in the US.
- Only about 36% to 38% of US homes now have cable or satellite.
- Advertising accounts for 74.8% of broadcasting revenue, and home users comprise 74% of the 4K satellite broadcasting market.
- AT&T and Dish Network together control nearly 50% of the US satellite TV market.
- Approximately 63% of cable and satellite subscribers are aged 68 or older, while only 46% are between 18 and 37 years old.
- Pay TV is expected to lose about USD 10.5 billion in revenue from 2020 to 2025.
- In Europe, Sky reaches over 17 million homes in the UK and Ireland through the Astra satellite system.
By Region

(Reference: amraandelma.com)
- In 2025, the Asia-Pacific region is expected to account for approximately 31% of the world’s satellite TV market.
- Moreover, the satellite TV market shares in other regions follow those of North America (25%), Europe (22%), Latin America (12%), and the rest of the world (10%).
Television Rating Statistics
By Top 10 TV Shows (November 12, 2025)
| Show Names | Engagement Score |
| Pluribus | 100+ |
| All Her Fault | 47.16 |
| Dancing with the Stars | 46.8 |
| Death by Lightning | 42.39 |
| IT: Welcome to Derry | 41.07 |
| Hazbin Hotel | 35.04 |
| The Witcher | 32.83 |
| South Park | 29.99 |
| Stranger Things | 29 |
| Slow Horses | 27.09 |
By Top 10 Movies
| Movie Names | Engagement Score |
| Frankenstein | 56.2 |
| Predator: Badlands | 31.93 |
| The Running Man | 24.24 |
| Bugonia | 12.59 |
| Marty Supreme | 9.89 |
| KPop Demon Hunters | 9.54 |
| A House of Dynamite | 7.99 |
| Weapons | 7.50 |
| Roofman | 6.98 |
| Wicked: For Good | 6.83 |
By Top 10 TV Networks
| Network Names | Engagement Score |
| Apple TV+ | 217.30 |
| Netflix | 177.72 |
| HBO | 138.98 |
| ABC | 119.21 |
| Hulu | 101.34 |
| FOX | 92.05 |
| Amazon | 89.90 |
| Paramount+ | 80.75 |
| Disney+ | 79.67 |
| NBC | 73.27 |

(Reference: amraandelma.com)
- In May 2025, Streaming was the most popular option, with 44.8% of total viewing time.
- Cable TV was the second most used, accounting for 35.1% of viewing, while Broadcast TV had the smallest share, at 20.1%.
Television Viewship Statistics
(Source: eMarketer.com)
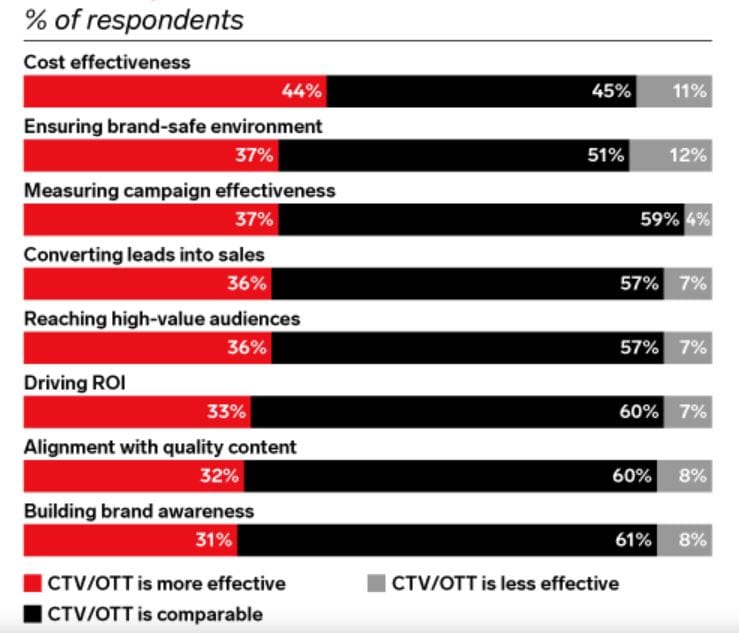
- For cost effectiveness, 44% of US advertisers said CTV/OTT is more effective, 45% said it is comparable, and 11% said it is less effective than linear TV.
Other effectiveness of CTV/OTT vs. Linear TV in Key KPIs (US Advertisers, April 2024):
| KPI | CTV/OTT is more effective | CTV/OTT comparable | CTV/OTT is less effective |
| Ensuring a brand-safe environment |
37%
|
51% | 12% |
| Measuring campaign effectiveness | 59% | 4% | |
| Converting leads into sales |
36%
|
57%
|
7%
|
| Reaching high-value audiences | |||
| Driving ROI | 33% |
60%
|
|
| Alignment with quality content | 32% |
8%
|
|
| Building brand awareness | 31% | 61% |
Cable TV Subscriber Statistics
- According to a report published by Cable Compare, by the end of 2025, cable TV will be subscribed to by 68.7 million American households.
The table below shows the global Cable TV penetration rate:
| Year | Penetration Rate |
| 2020 | 74% |
| 2021 | 71% |
| 2022 | 66% |
| 2023 | 64% |
| 2024 | 50% |
| 2025 | 35% |
Cable TV Household Statistics
| Year | Households Users (millions) |
YoY Change Rate |
| 2020 | 79.1 | -6.7% |
| 2021 | 73.9 | -6.6% |
| 2022 | 69.5 | -6% |
| 2023 | 72.1 | +3.7% |
| 2024 | 70.2 | -2.6% |
| 2025 | 69 | -1.7% |
Cord-Cutting Households Statistics
| Year | Households Users (millions) |
YoY Change Rate |
| 2020 | 50.9 | +14.1% |
| 2021 | 58.3 | +14.5% |
| 2022 | 64.3 | +10.3% |
| 2023 | 68.9 | +7.2% |
| 2024 | 73.2 | +6.2% |
| 2025 | 77.2 | +5.5% |
Leading TV and Movie Award Shows In The US By TV Viewers (From 2023 to 2025)
|
Year
|
Academy Awards (Oscars) | Grammy Awards | Golden Globe Awards | Primetime Emmy Awards |
| (millions) | ||||
| 2025 | 19.7 (approx.) | 15.4 | 9.3 | 7.42 |
| 2024 | 19.5 | 16.9 | 9.4 | 6.87 |
| 2023 | 18.8 | 12.6 | 6.3 | – |
Conclusion
After completing the article on Television Statistics, it is now clear that TV still matters in many homes in 2025. However, with changing times, the habits have changed significantly. In recent years, a growing number of viewers have chosen to watch programmes online on mobile devices, tablets, and laptops; traditional TV sets are still prevalent in many homes.
Currently, children and adults are also found to spend less amount of time in front of screens, which can harm their health, reduce their academic performance, and weaken their family relationships. Advanced technologies have also significantly transformed television, including its shape, size, and features. All these factors contribute to the overall growth of the television industry; therefore, review the above analysis to gain a comprehensive evaluation.
Sources
FAQ.
Television became popular after World War II, particularly during the 1950s, when families began purchasing TVs.
Over the years, television has advanced from simple black-and-white broadcasts to modern digital smart screens.
Television is used for news, education, entertainment, advertising, and live coverage of events worldwide today.
Television can be both a source of learning and fun, but it can also harm health, attention, and relationships.
Television primarily serves two roles such as providing information and education, and offering relaxation and daily entertainment.

Maitrayee Dey has a background in Electrical Engineering and has worked in various technical roles before transitioning to writing. Specializing in technology and Artificial Intelligence, she has served as an Academic Research Analyst and Freelance Writer, particularly focusing on education and healthcare in Australia. Maitrayee's lifelong passions for writing and painting led her to pursue a full-time writing career. She is also the creator of a cooking YouTube channel, where she shares her culinary adventures. At Smartphone Thoughts, Maitrayee brings her expertise in technology to provide in-depth smartphone reviews and app-related statistics, making complex topics easy to understand for all readers.