Table of Contents
- Introduction
- Editor’s Choice
- Travel Volume and Patterns for Thanksgiving 2024
- Thanksgiving Meal Costs and Ingredient Trends
- Leftovers and Food Waste on Thanksgiving
- Thanksgiving – Season Charitable Giving
- Restaurant, Catering, and Dining – Out Trends
- Generational Behavior and Social Trends
- Health and Weight Trends in Thanksgiving
- Meal Preparation Timelines and Thanksgiving Traditions
- Thanksgiving Food Waste and Sustainability Concerns
- Post-Thanksgiving Shopping and Black Friday Stats
- Conclusion
Introduction
Thanksgiving Statistics: Thanksgiving isn’t just about turkey and pumpkin pie anymore. In 2025, it’s a mirror reflecting how modern Americans think, shop, eat, and connect. From how much we spend on Black Friday to how much food we waste after the big meal, this holiday is packed with revealing insights about our changing culture and consumer habits.
This deep dive into Thanksgiving statistics 2025 uncovers everything: how people are celebrating, what they’re buying, where they’re spending, and how sustainability, tech, and tradition are colliding like never before. Whether you’re just a reader or a data analyst, these numbers will surprise you (for sure), inform you, and maybe even change how you spend your next Thanksgiving. Let’s break it down.
Editor’s Choice
- The average Thanksgiving meal for 10 people costs $58.08 in 2024, a 5% drop from 2023, but still nearly 19% higher than it was pre-pandemic, according to the AFBF.
- Turkey prices fell by 6%, with a 16-pound bird averaging $25.67, which eased overall meal costs despite inflation in processed goods like dinner rolls and stuffing.
- Black Friday sales surged past $9.8 billion, as per Adobe Analytics, showing an all-time high in online spending, driven heavily by mobile purchases and early access deals.
- According to the NRF, roughly 200 million Americans shopped during the Thanksgiving weekend, with Gen Z leading in mobile and app-based shopping behavior.
- Food waste remains a major concern, with ReFED reporting that over 312 million pounds of food are wasted during Thanksgiving, highlighting the need for better planning and donation efforts.
- A growing number of Americans are rethinking traditions, nearly 25% of households are opting for plan-based or alternative meals, based on a 2024 Statista survey.
- 70% of Thanksgiving shoppers used a smartphone to compare prices or buy items this year, showing how digital transformation is redefining holiday spending, according to Deloitte.
- As per Pew Research, 62% of Americans now say Thanksgiving is more about spending quality time with loved ones than focusing on the meal or shopping, reflecting a cultural pivot post-COVID.
- Millennials and Gen Z made up 58% of total Thanksgiving weekend spenders, with their average spend climbing to $446 per person, revealing a shift in generational spending power.
- According to the USDA, seasonal food prices showed mixed trends, with dairy, vegetables, and poultry down, but baked products and processed mixed increasing due to supply chain and labor costs.
| Category | Statistical Highlight | Key Figure |
| Thanksgiving Meal Cost | The average Thanksgiving dinner for 10 people in 2024 costs $58.08, which is 5% less than last year. But compared to pre-COVID years, it is still up by 19%. |
$58.08 per 10 people |
|
Turkey Price |
A 16-pound turkey cost around $25.67 this year, falling by 6% from 2023. This drop followed years of inflation and supply-chain disruption in the meat industry. | $25.67 for 16 lbs |
| Black Friday Spending | Thanksgiving 2024 saw Black Friday online sales hit a record $9.8 billion, with shoppers flocking to early deals using smartphones and apps. |
$9.8 billion |
|
Shopper Volume |
Over 200 million Americans shopped during the long weekend, with Gen Z and Millennials leading the charge through mobile-first platforms and digital coupons. | 200 million shoppers |
| Food Waste | A staggering 312 million pounds of food were wasted this Thanksgiving, mostly from leftovers and excess preparation that went uneaten and were discarded. |
312 million pounds |
|
Vegan Options Rise |
About 25% of households included at least one plant-based or vegan option on the table. Urban families and health-conscious youth pushed this trend forward. | 25% of households |
| Mobile Shopping Surge | Around 70% of people used mobile devices to browse deals or buy gifts during Thanksgiving week. Smartphones have now become the primary tool for holiday shopping. |
70% mobile usage |
|
Focus on Family |
Around 62% of Americans said Thanksgiving is more about reconnecting with loved ones than shopping, showing a cultural shift toward emotional bonding. | 62% value togetherness |
| Gen Z and Millennials Spend | These two groups made up 58% of shoppers, spending an average of $446 each, mostly on electronics, home gadgets, and clothing. |
$446 average spend |
|
Grocery Price Trends |
Fresh items like turkey and milk dropped slightly in price, but processed food like pies and canned goods rose by up to 6% keeping budgets tight. |
6% rise in processed |
Travel Volume and Patterns for Thanksgiving 2024
 (Source: minitab.com)
- In 2024, 79.9 million Americans traveled 50 miles or more for Thanksgiving, which is 1.7 million more than in 2023 and 2 million above 2019 levels, making it the busiest Thanksgiving travel season ever.
- Of those travelers, 71.7 million went by car, surpassing the previous record of 70.6 million from 2019 by nearly 1 million.
- Approximately 5.8 million flew domestically over Thanksgiving break, representing a 2% increase year-over-year and an 11% rise compared to pre-pandemic 2019.
- About 2.3 million chose other modes such as trains, buses, or cruises, marking a 9% increase from 2023 and an 18% jump from 2019.
- Cruise travel demand surged 20%, driving growth in non-traditional holiday travel among younger and leisure-seeking passengers.
- AAA expanded the travel window in 2024 to include travel from Tuesday, November 26, to Monday, Dec 2, marking the first time their forecast covers seven days.
- Peak driving congestion occurred on Tuesday and Wednesday afternoons, especially in metro areas like Washington, DC, New York, and Seattle, where congestion rose over 120% above normal.
- Thanksgiving Day itself saw minimal traffic, making it one of the best days to drive for those who can schedule flexible travel.
- Rental car demand spiked in cities like Atlanta, Las Vegas, Los Angeles, Miami, Orlando, and Phoenix, especially on Wednesday before Thanksgiving and the following Monday and Tuesday.
- Peak domestic airfare averaged around $700, a 3% rise from the previous year, while international fares dropped 5% to about $1,190.
- Hotel prices in the U.S. averaged $610 per night, showing a 28% increase from 2023, while international hotel costs were $660, up 13%.
- Domestic rental car rates averaged $480, down 2%, while international rental rates fell 13% to around $420.
- Cost-conscious travelers reported that 32% shortened trip durations to save money, with 30% choosing less expensive accommodations and 28% opting to drive instead of fly.
- Around 28% of travelers increased their travel budgets compared to the previous year, budgeting an average of $3,294 for their longest trip; millennials averaged $3,927, higher than other generations.
- Nearly 49% of travelers said they will work at least part of their holiday trip, up from 34% the year before, and many used GenAI or video content tools to plan travel effectively.
| Category | Value |
| Total travelers | 79.9 M |
| Travel by car | 71.7 M |
| Air travelers | 5.8 M (+2% YoY) |
| Other modes | 2.3 M (+9% YoY) |
| Avg domestic fare | $700 (+3%) |
| Avg domestic hotel | $610 (+28%) |
| Average domestic rental car | $480 (‑2%) |
Thanksgiving Meal Costs and Ingredient Trends
 (Reference: statista.com)
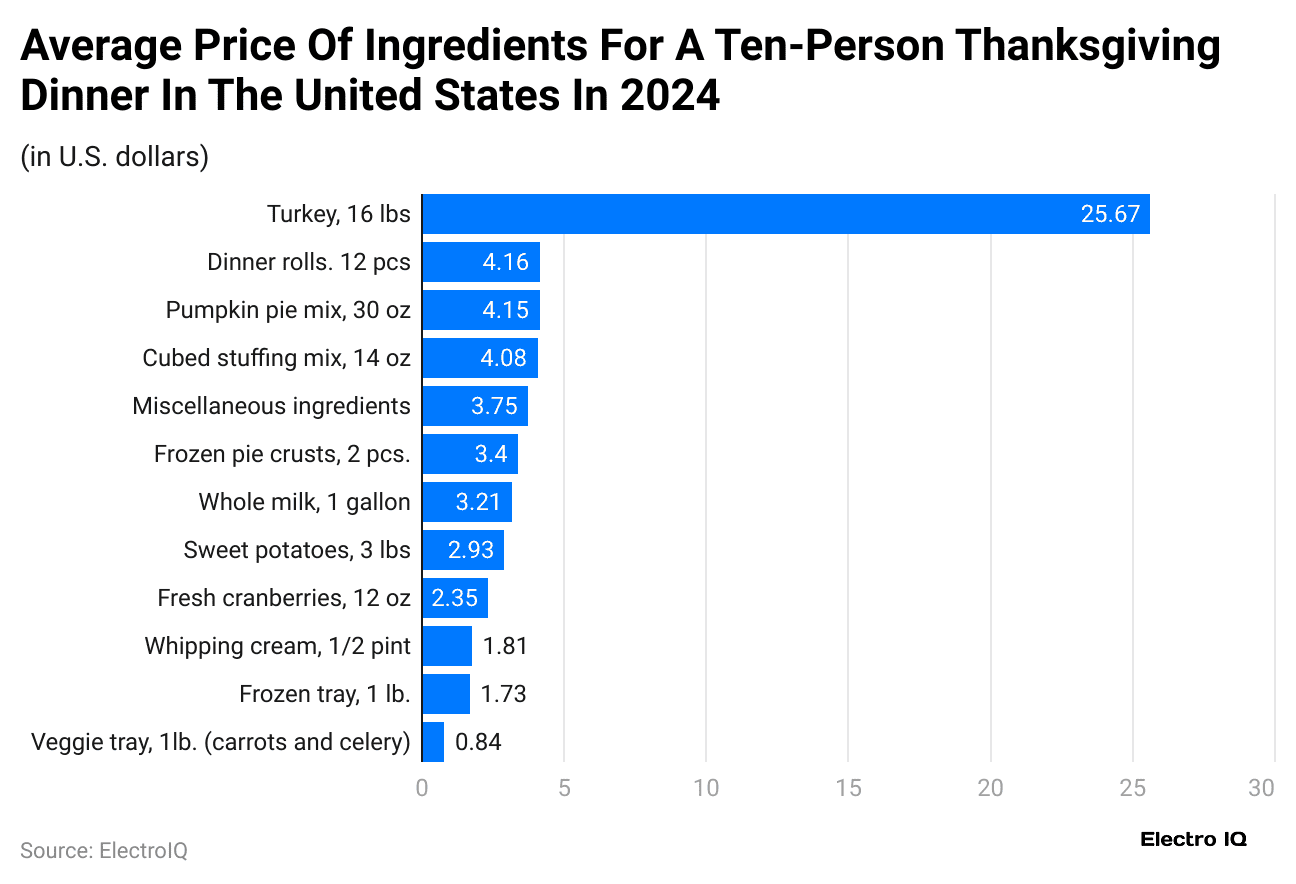
- In 2024, the average cost of a traditional 10-person Thanksgiving meal dropped to $58.08, which works out to roughly $5.81 per person, representing a 5% decrease from 2023; however, the total remains 19% higher than pre-pandemic levels.
- A 16-pound turkey now costs about $25.67, down 6% from the previous year; turkey accounts for approximately 44% of the overall dinner cost.
- Sweet potatoes dropped about 26% in price, and frozen peas decreased around 8%, contributing to lower side dish costs and offsetting some inflation.
- Processed foods saw increases: dinner rolls rose around 8% and cubed stuffing increased about 8%, adding to higher costs in packaged ingredients.
- Fresh cranberries rose roughly 12%, while other ingredients like fresh vegetables and whole milk generally declined or remained stable.
- Including side items like ham, potatoes, and vegetables, the “extended birthday basket” costs around $77.34, meaning about $7.73 per person, still an 8.7% drop from 2023.
- Western U.S. regions saw higher meal bills, around $67.05 for a 10-person basket in the West, compared to $56.81 to $58.90 in other regions.
- Cranberry consumption peaks during Thanksgiving week, with about 80 million lbs consumed, roughly 20% of annual U.S. cranberry use.
- Americans eat over 46 million turkeys on Thanksgiving Day alone, which equals nearly half of all annual whole-turkey sales.
- The average American Thanksgiving meal exceeds 3,000 calories, and total daily intake can reach 4,500 calories when including sides, desserts, and beverages.
- Stuffing alone drives about $96 million in annual consumer spending, second only to turkey in staple holiday ingredients.
- Butterball consumer surveys found that an overwhelming 98% expect inflation to affect their holiday plans, yet 87% still plan to serve turkey, and 51% consider it their favorite part of the meal.
- Despite a 6% decline in turkey production in 2024 due to disease, lower feed costs and storage reserves helped stabilize prices for consumers.
- Grocery inflation overall slowed in 2024; total food costs rose only about 1.2% year-over-year, though grocery prices are still 24% higher than in early 2020.
- Store-brand or bundled meal options often cost over $10 less per meal, helping budget-conscious shoppers keep per-person costs under $5 even amid inflation.
| Item | Cost/Change |
| 10‑person meal | $58.08 (‑5% YoY; +19% vs 2019) |
| 16‑lb turkey | $25.67 (‑6%) |
| Sweet potatoes | ‑26% |
| Dinner rolls, stuffing | +8% |
| Cranberries per lb | $2.35 (+12%) |
| Calories per person | 3,000 to 4,500 cal |
Leftovers and Food Waste on Thanksgiving
 (Reference: sustainable.umn.edu)
- In 2024, Americans will waste around 316 million pounds of food on Thanksgiving Day alone, equivalent to $556 million in grocery value thrown away in just one day.
- That waste includes turkey and milk mainly, which make up about 58% of the total, or roughly 183 million pounds in just those two items alone.
- Thirty-eight percent of overall U.S. food production goes uneaten, amounting to a staggering 92 billion pounds wasted annually.
- 2 million whole turkeys are wasted each Thanksgiving, a shocking number equal to 4% of annual turkey production.
- The water used to produce this wasted food amounts to 105 billion gallons, enough for every American to take 18 showers.
- Emissions from the wasted food equate to 190,000 cars driven for a year, contributing nearly 800,000 metric tons of CO₂ equivalent.
- When decomposed in landfills, Thanksgiving waste releases about 5,000 metric tons of methane, as potent as powering 26,000 homes for a year.
- EFPA data suggests household trash, including food and packaging, increases by roughly 25% between Thanksgiving and New Year’s Day.
- Nearly 50% of a cooked Thanksgiving turkey is discarded as inedible or unused, driving much of the food waste.
- Thanksgiving leftovers account for about 160,000 tons of food waste, including containers and perishables.
- Still, families hold onto leftovers, and about 70 million people eat them the next day, extending the feast into creative meals.
- Around 25% of households purposely cook smaller meals to avoid waste, planning menus based on guest count and appetite.
- Instant demand for storage containers spikes by 40% post-holiday as people preserve leftovers instead of discarding them.
- Community programs collect unused meals and ingredients for food banks, reducing both waste and hunger in local areas.
- Composting pickup requests increase by 30% after Thanksgiving, indicating more households are diverting food waste from landfills.
| Category | Value |
| Waste on Thanksgiving Day | 316 M lbs / $556 M |
| % of waste from turkey & milk | 58 % |
| Whole turkeys wasted | 8.2 M (4 % of annual prod) |
| Water used for wasted food | 105 B gallons |
| CO₂ emissions from waste | 800K metric tons |
| Methane released | 5,000 metric tons |
| % rise in household trash | 25 % |
| Leftover eaters the next day | 70 M people |
| Compost pickup increases | 30 % |
Thanksgiving – Season Charitable Giving
 (Reference: kindnessfp.com)
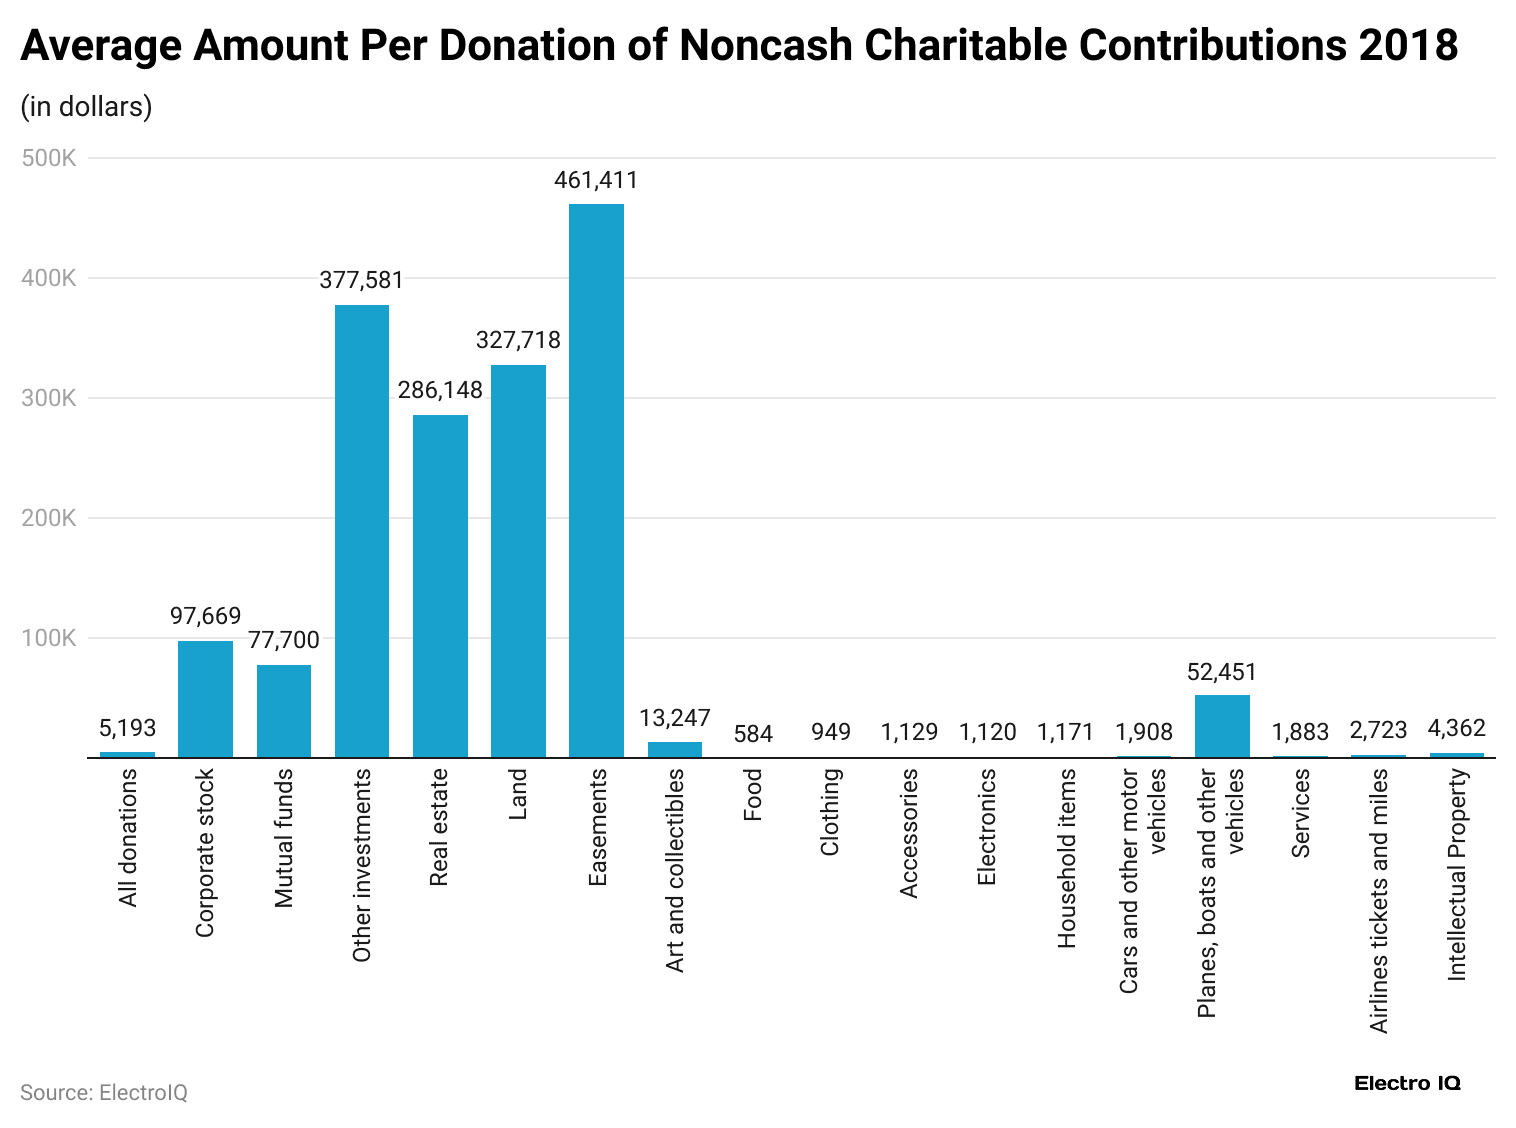
- GivingTuesday 2024, the Tuesday after Thanksgiving, raised about $3.6 billion, a 16% increase over 2023. This generosity came from approximately 18.5 million donors, up 4% from last year, and 9.2 million volunteers, also up 4%.
- Donors gave an average of around $225 per gift, marking a 9% increase from 2023. The total represents nearly 1.2% inflation-adjusted growth, showing absolute giving rose more than inflation.
- Individuals made up 62% of all GivingTuesday participation, contributing significantly more than companies or foundations.
- Giving Tuesday has gone global, involving over 95 countries and more than 300 communities in 2023, demonstrating large-scale civic engagement.
- Online platforms processed over $3.6 billion in donations, marking digital giving as the driving force behind the movement.
- Non-monetary generosity was significant: 9.2 million volunteered, and countless others donated food or goods in their communities.
- Charities report that this day fuels year-end fundraising, often covering operational budgets through January.
- Melinda French Gates pledged to match up to $1 million in GivingTuesday donations to women’s causes, amplifying impact.
- The federal Combined Federal Campaign raised $3.13 million online for Giving Tuesday 2024.
- Since its launch in 2012, Giving Tuesday donations have grown from $12 million to over $3 billion, exemplifying an explosion in giving culture.
- Despite inflation and recession worries, donor behavior remains resilient, with growth in both participation and total donations.
- Effective holiday planning by nonprofits includes early email outreach and social campaigns starting in November.
- Analysts say this generosity springs from post-Thanksgiving reflection, making the day a key anchor in the holiday giving calendar.
| Metric | Value |
| Total raised | $3.6 B (+16%) |
| Donors | 18.5 M (+4%) |
| Volunteers | 9.2 M (+4%) |
| Avg gift amount | $225 (+9%) |
| CFC federal campaign | $3.13 M |
| Countries participating | 95+ |
| Communities involved | 300+ |
Restaurant, Catering, and Dining – Out Trends
- In 2024, 27% of Americans plan to dine out or order catering for Thanksgiving, showing a modern shift toward convenience and avoiding kitchen stress.
- Their spending per person averages around $166 for holiday meals, reflecting a premium over home-cooked food. Dining out offers shorter prep time but a higher overall cost than cooking at home.
- S. restaurant sales during the Thanksgiving holiday season rose 7.8% in 2023 compared to the prior year, suggesting continuing demand into 2024.
- Nearly 31% of holiday hosts purchase alcoholic beverages when dining out or catering, with 70% preferring wine, signaling rising interest in festive drinking outside the home. Beer follows at 52%, spirits at 44%, highlighting mixed drink preferences.
- About 15% of families using catering services reported using professionally prepared meals due to dietary restrictions or allergies in recent surveys.
- The average catering bill for a family of eight falls around $320, which breaks down to $40 per person, often including turkey, sides, and desserts.
- Holiday-themed meal kits saw 12% growth in 2024 as families look for quick meal solutions with added convenience.
- Thanksgiving Day reservations at casual dining chains are up about 10% compared to 2022, signaling a rise in restaurant-led celebrations. Chains like Denny’s, Cracker Barrel, and O’Charley’s promote special menus and family deals.
- Food halls and upscale eateries report a 14% year-over-year increase in catering orders, driven by young professionals and small groups.
- Takeout turkey meals from grocery stores increased 18% in 2024, offering rotisserie-style birds with sides for pickup or delivery. This hybrid model satisfies those wanting home-style food without the time or hassle of cooking.
- App-based food delivery spikes by 25% on Thanksgiving evening, as people supplement leftovers or skip cooking entirely for unique meals. Apps like DoorDash, Uber Eats, and Grubhub promoted lunchtime specials in 2024.
- Nearly 22% of diners claim they hosted or attended a potluck-style Thanksgiving dinner, sharing food responsibilities among guests.
- Some foodservice managers anticipate demand increases up to 30% in certain metro markets with large student or retired populations.
- Reviews on sites like Yelp and Tripadvisor for Thanksgiving-affiliated meals rose 40% over the holiday week in 2023, showing how consumers lean on peer guidance.
- Nearly 18% of customers using catering services opted for two-tone meals, one meat and one vegetarian entrée, reflecting growing plant-based dietary choices.
- With catering and dine-out options, springboarded into 2025, industry insiders project a 15% increase in holiday meal revenues, driven by holiday specials and bundled deals.
| Metric | 2024 Value |
| Americans dining out or catering | 27% |
| Average party-sourced catering cost | $40 per person |
| Catering & food-hall demand | +14% YoY |
| Takeout turkey meal orders | +18% YoY |
| App delivery traffic on Thanksgiving | +25% |
Generational Behavior and Social Trends
 (Source: deloitte.com)
- Gen Z travelers make up 17% of holiday travelers while only representing 14% of the U.S. adult population, illustrating their disproportionate travel participation.
- Millennials lead the travel spend; they budget an average of $3,927 for their longest Thanksgiving trip. That’s higher than Gen Z ($3,294) and significantly more than Gen X and Boomers.
- Gen Z is also reshaping spending at home; they are the most likely to invest in décor and presentation, with $491 average host budget, exceeding all older generations.
- Boomers show the most conservative travel budgets, with only 17% planning trips over $1,000, compared to 45% of pods under age 45.
- Solo travel has grown; 28% of Thanksgiving travelers went solo in 2024, with 35% of Gen Z and 38% of Boomers traveling alone.
- Gen X is the least likely to eat out on Thanksgiving, with only 8% saying they would dine out, compared to 27% average across all adults.
- Younger generations, Gen Z and Millennials, are more open to plant-based or vegetarian options, at 21% compared to 9% for Boomers.
- Gen Z also led the trend in using digital grocery tools; their online basket use is around 29%, compared to 12% across all age groups.
- Multiple-generation households reported 16% higher spending on shared cookware and holiday décor in 2024 than single-generation homes.
- Families with young kids spend more on novelty dishes and festive desserts; 23% of hosts with kids under 12 reported buying themed cookies or pies..
- Older adults (65+) report a 42% increase in community meal participation, like church dinners or senior center events, compared to the previous year.
- Gen Z respondents were twice as likely to try Friendsgiving gatherings, representing 15% of all hosts, compared to 7% among Boomers.
- 38% of Millennials live in multi-family or shared housing, which leads to more collaborative budgeting and potluck-style gatherings.
- 22% of Gen Z travelers booked accommodations via home-sharing services, compared to only 9% of Boomers, further highlighting tech-driven variance.
- Overall, 20% of U.S. households incorporate a hybrid Thanksgiving model, some cooking at home and some using catering, delivery, or restaurant options.
| Cohort | Avg Host Budget | Travelers Over $1,000 | Eating Out % | Solo Travel % |
| Gen Z | $491 | 45% | 27% | 35% |
| Millennials | $483 | — | — | — |
| Gen X | $385 | — | 8% | — |
| Boomers | $292 | 17% | — | 38% |
Health and Weight Trends in Thanksgiving
 (Source: sharecare.com)
- Thanksgiving meals are known for being high in calories, with the average person consuming between 3,000 and 4,500 calories in a single day.
- That’s nearly double the recommended daily intake, often leading to bloating, discomfort, and sleep disturbances.
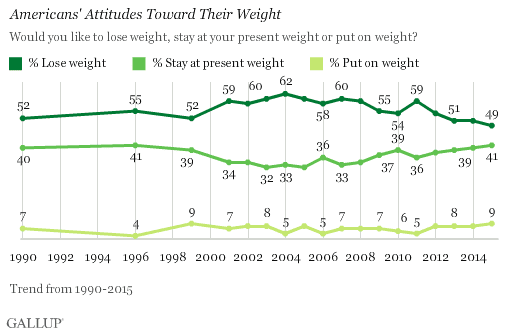
- Between Thanksgiving and New Year’s, the average American gains anywhere from 1 to 5 pounds. This is due to rich food choices, sedentary habits, and multiple festive events in a short period.
- Roughly 68% of people say they feel sluggish and low in energy the day after Thanksgiving, mostly due to heavy meals and excessive carbohydrate intake during dinner.
- Health awareness is increasing, with 49% of Thanksgiving travelers including exercise in their break routine in 2024, a major jump from 34% in 2023.
- Healthier options are making their way onto the table, with 40% of households now including low-calorie or plant-based side dishes to balance out traditional items.
- In 2024, 38% of diabetic households received targeted messaging and recipe guides to help manage glucose levels during Thanksgiving meals.
- The demand for alternative desserts is growing, with 33% of hosts purchasing sugar-free or gluten-free pies, a big rise from 22% in 2022.
- A trend toward portion control is emerging, with 18% of families using compartment containers to manage intake and reduce leftovers.
- 27% of people start using calorie-tracking apps right after Thanksgiving to monitor food consumption and avoid holiday weight gain.
- 59% increase their intake of water, lemon juice, or herbal teas post-Thanksgiving as a digestive aid and to ease bloating.
- Almost 45% of families now throw away leftovers within 48 hours, driven by concerns around foodborne illnesses and spoilage.
- Roughly 34% of individuals report having difficulty sleeping the night after Thanksgiving due to overeating and late-night meals.
- About 41% go for an after-dinner walk or light physical activity to help digestion and regulate blood sugar levels.
- 52% of hosts serve a light breakfast or skip it altogether on Thanksgiving morning, saving their appetite for the big feast.
- Searches for diabetic-friendly Thanksgiving recipes rose by 22% in 2024, indicating a broader interest in balanced holiday eating.
- Leftover reinvention is now common, with 37% turning turkey and side dishes into healthy options like salads, soups, and wraps.
| Statistic Description | Value/Percentage |
| Average calorie intake on Thanksgiving | 3,000 to 4,500 cal |
| Average weight gain during the holiday season | 1 to 5 pounds |
| People who feel sluggish after Thanksgiving | 68% |
| Travelers who plan fitness into their holiday | 49% (up from 34%) |
| Households adding healthy sides | 40% |
| Diabetic-focused Thanksgiving outreach | 38% |
| Hosts buying sugar/gluten-free desserts | 33% (up from 22%) |
| Families using portion-control containers | 18% |
| People using calorie-tracking post-Thanksgiving | 27% |
| People are increasing their water/herbal tea intake | 59% |
| Leftovers discarded within 48 hours | 45% |
| People with disrupted sleep after Thanksgiving | 34% |
| People walking after dinner | 41% |
| Light/no breakfast served on Thanksgiving morning | 52% |
| Search increases for diabetic-friendly recipes | 22% increase |
| Leftovers turned into healthy meals | 37% |
Meal Preparation Timelines and Thanksgiving Traditions
 (Reference: usda.gov)
- The average Thanksgiving menu starts taking shape about two weeks in advance, with people planning recipes, calculating guest counts, and drafting their grocery lists.
- Grocery shopping usually peaks 8 to 10 days before Thanksgiving. However, 75% of shoppers make a second grocery run within the final 3 days to grab forgotten or last-minute items.
- 46% of hosts bake pies, cookies, and other desserts 2 days before Thanksgiving to ensure freshness while reducing stress on the actual day.
- 68% of households begin thawing frozen turkeys at least 3 days in advance. This follows USDA guidelines for safe defrosting based on turkey weight.
- Over 57% of cooks prepare dressings, sauces, or gravies one to two days ahead, storing them in sealed containers to be heated on the day of the event.
- Casseroles, which are staples in many homes, are assembled 24 hours early in 53% of households, ready to be popped in the oven.
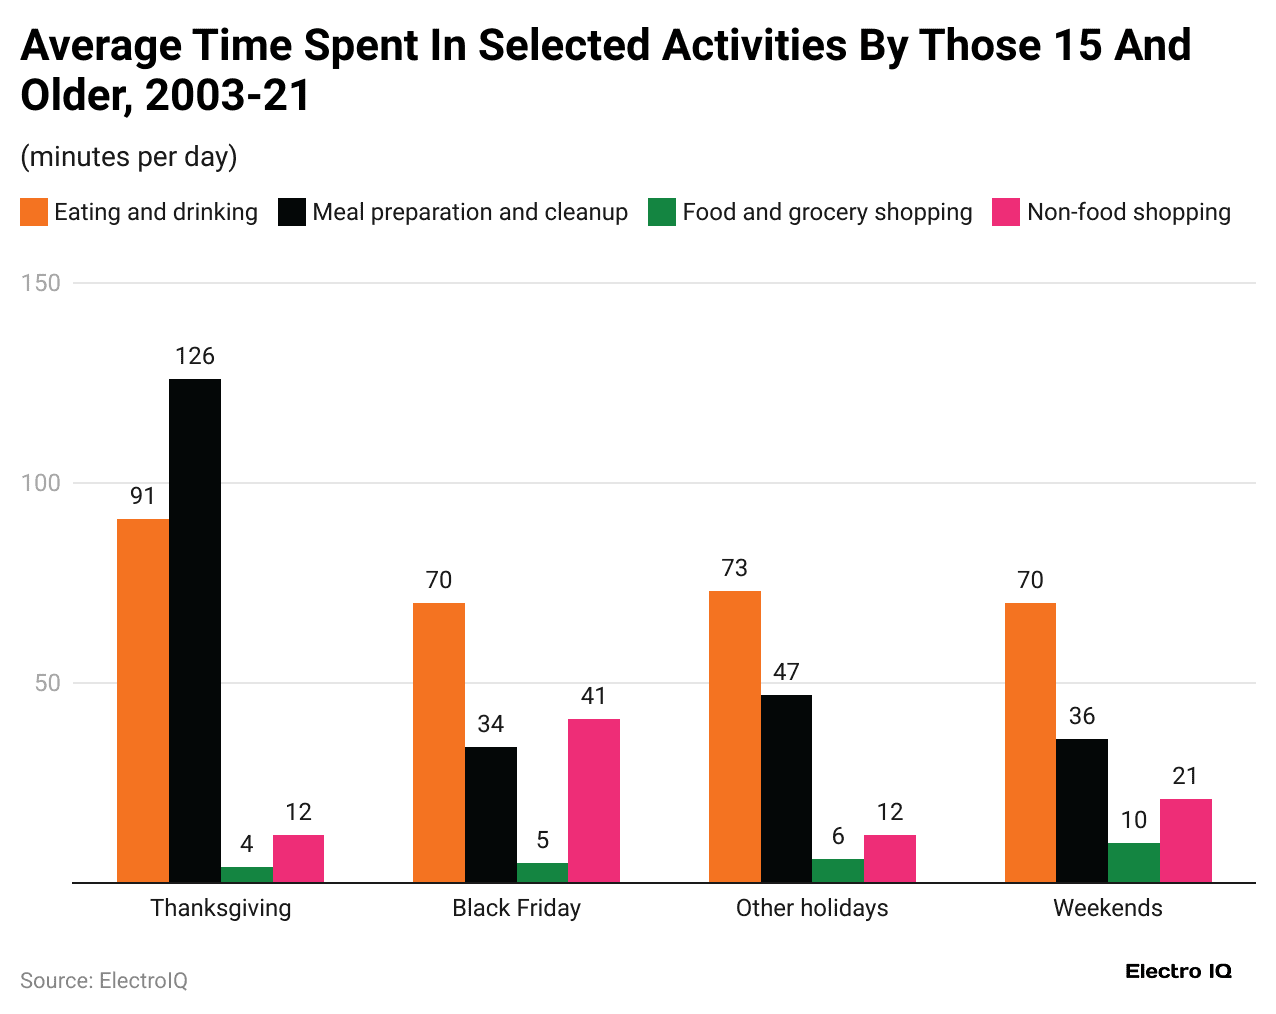
- Cooking starts early for most families, with prep and stove time beginning 6 to 12 hours before dinner, depending on the number of guests and complexity of dishes.
- Turkey carving typically happens about 30 to 60 minutes before mealtime in 58% of homes to allow time for plating and presentation.
- Cleanup kicks in almost immediately after eating in 52% of households, with leftovers packed and stored within 2 hours to avoid spoilage.
- 79% of families follow the tradition of watching Thanksgiving Day football together, making it one of the top post-meal activities.
- 68% of homes spend time on outdoor walks, backyard games, or indoor board games, promoting family bonding and some light movement.
- 42% of households shift their attention to Black Friday shopping plans immediately after Thanksgiving dinner or late into the evening.
- 18% of families spend post-meal time doing crafts or activities with kids, such as making ornaments or gratitude jars.
- 52% of people adjust their meal routines through December, moving away from structured meal times and focusing on festive flexibility.
- Many families, around 36%, begin planning Christmas or other winter holidays as soon as Thanksgiving is over, using the momentum to stay ahead.
| Activity/Event Description | Percentage |
| Menu planning begins | 14 days before |
| Grocery shopping peaks | 8 to 10 days before |
| Second grocery run before Thanksgiving | 75% |
| Desserts are prepared 2 days before | 46% |
| Turkey thawed 3 days in advance | 68% |
| Dressings/sauces prepared 1 to 2 days ahead | 57% |
| Casseroles assembled 24 hours early | 53% |
| Cooking begins 6 to 12 hours ahead | Most families |
| Turkey is carved 30 to 60 minutes before the meal | 58% |
| Cleanup starts within 2 hours after eating | 52% |
| Families watching Thanksgiving football | 79% |
| Families engaging in post-meal games or walks | 68% |
| Households planning Black Friday after dinner | 42% |
| Families doing crafts with children after a meal | 18% |
| People following flexible meal routines after Thanksgiving | 52% |
Thanksgiving Food Waste and Sustainability Concerns
 (Reference: instagram.com)
- Every year, over 200 million pounds of turkey are thrown away in the United States during the Thanksgiving holiday, leading to massive waste and environmental concerns.
- Approximately 30% of all food purchased for Thanksgiving ends up uneaten, with side dishes like mashed potatoes and stuffing being the most commonly discarded.
- 44% of Americans admit they over-prepare food, leading to excessive leftovers that often go bad due to poor storage or forgetfulness.
- In 2024, 39% of households have started using compost bins to manage organic waste more responsibly, a rise from just 28% in 2022.
- Interest in sustainable Thanksgiving practices has grown, with 49% of families opting for reusable dishes and utensils instead of single-use plastics.
- Food rescue apps like Too Good To Go and OLIO saw a 23% rise in Thanksgiving week usage in 2024, showing an effort to reduce waste.
- 35% of households donate unused pantry items or canned goods during the week of Thanksgiving to local food banks or community kitchens.
- Leftover planning is gaining traction, with 42% of people creating specific meal plans or recipes to reuse extra food within 3 days.
- Despite efforts, 54% of families still discard at least one full meal’s worth of food after Thanksgiving, either due to spoilage or lack of appetite.
- Nearly 61% of millennials are more conscious about waste and prefer shopping with pre-planned lists to minimize overbuying during Thanksgiving.
- About 31% of Americans now buy smaller turkeys or serve alternate proteins to reduce overconsumption and potential waste.
- 33% of urban households in 2024 joined local sustainability drives or cleanups scheduled right after Thanksgiving to offset their environmental impact.
- More than 24% of people use airtight containers and vacuum sealers to extend the life of leftover Thanksgiving food through the week.
- Online guides on “zero-waste Thanksgiving” saw a 67% spike in traffic this year, indicating growing interest in eco-friendly holiday planning.
- 41% of respondents said they’re more likely to buy locally grown or organic produce during Thanksgiving, especially for vegetables and fruits.
- Food packaging awareness increased, with 29% actively choosing minimal-packaging or biodegradable wrapping options for store-bought ingredients.
| Metric or Behavior Description | Value/Percentage |
| Turkey wasted post-Thanksgiving | 200M+ pounds |
| Food wasted from Thanksgiving prep | 30% |
| People admitting to over-preparing | 44% |
| Households using compost bins | 39% (up from 28%) |
| Families using reusable dinnerware | 49% |
| Increase in food rescue app use | 23% rise |
| Households donating unused pantry food | 35% |
| Leftover meal planning efforts | 42% |
| Families discarding full meals post-Thanksgiving | 54% |
| Millennials are reducing waste via planned shopping | 61% |
| Households are buying smaller turkeys | 31% |
| Participation in post-Thanksgiving sustainability efforts | 33% |
| Use of airtight or vacuum storage for leftovers | 24% |
| Spike in zero-waste Thanksgiving guide traffic | 67% increase |
| Families buying local/organic produce | 41% |
| Use of biodegradable or minimal packaging | 29% |
Post-Thanksgiving Shopping and Black Friday Stats
 (Reference: queue-it.com)
- Black Friday has become an integral part of Thanksgiving week, with 76% of Americans participating in either online or in-store shopping during the extended weekend.
- In 2024, U.S. consumers spent approximately $9.8 billion online on Black Friday alone, marking an increase of 7.3% compared to the previous year.
- Roughly 52% of shoppers started browsing deals while still at the Thanksgiving dinner table, with smartphones playing a big role in early access.
- Mobile shopping accounted for nearly 48% of all Black Friday purchases in 2024, making it the largest year yet for mobile-first consumer behavior.
- Retailers began offering Black Friday previews as early as the Monday before Thanksgiving, with 62% of people making early purchases to skip crowds.
- In-store traffic saw a modest increase, with 29% of shoppers visiting physical locations, especially for electronics, toys, and home goods.
- 47% of consumers preferred curbside pickup or same-day delivery over traditional checkout, showing that convenience is now a major driver.
- 35% of people reported spending more on Black Friday in 2024 than in previous years, primarily driven by electronics and smart home products.
- 42% of shoppers said they used loyalty programs or credit card reward points to offset their spending during Thanksgiving weekend sales.
- 56% of millennials and Gen Z buyers used price comparison tools or Chrome extensions before making their purchases.
- Nearly 31% of families said Black Friday is now part of their holiday tradition, often replacing post-meal relaxation with deal hunting.
- Email marketing contributed to over 27% of Black Friday sales traffic, showing it still plays a strong role despite the growth of social ads.
- 49% of online purchases during Black Friday came from households aged between 25 to 40, indicating strong engagement from young adults.
- Environmental backlash exists as well, with 26% saying they feel guilty or anxious about overconsumption on Black Friday, despite participating.
- Cyber Monday saw 12.4 billion USD in online spending in 2024, setting a new record and extending the Thanksgiving shopping season.
- 34% of shoppers set strict budgets before the Thanksgiving weekend to avoid debt, and 21% stuck to them, showing growing awareness in financial planning.
| Metric or Trend Description | Value/Percentage |
| Americans participating in Black Friday sales | 76% |
| Total online Black Friday spending | $9.8B (7.3% up) |
| Shoppers browsing deals during Thanksgiving dinner | 52% |
| Share of purchases via mobile | 48% |
| People shopping early in Black Friday week | 62% |
| In-store shoppers during Black Friday | 29% |
| People using curbside/same-day delivery | 47% |
| People are spending more than in previous years | 35% |
| Shoppers using rewards/loyalty programs | 42% |
| Gen Z/Millennials using price comparison tools | 56% |
| Families that include Black Friday as a tradition | 31% |
| Black Friday traffic from email marketing | 27% |
| Online purchases by the 25 to 40 age group | 49% |
| People feel guilty about Black Friday spending | 26% |
| Cyber Monday spending record | $12.4B |
| People sticking to pre-set budgets | 21% |
Conclusion
These Thanksgiving Statistics have proven to be more than just a long weekend of gratitude; it’s now a dynamic mix of mindful living, tech-driven shopping, and evolving family traditions. The stats speak louder than ever: we’re cooking smarter, shopping faster, wasting less, and rethinking what celebration means in a connected world.
Whether it’s the rise in mobile purchases, the conscious move towards zero-waste meals, or the subtle shift in how we show gratitude, the numbers show that Americans are reshaping Thanksgiving to be not only more convenient but also more conscious. And if these trends continue, next year’s Thanksgiving might look even more intentional, inclusive, and intelligent.