Google Pay Statistics By Users, Region, Demographics And Facts (2025)
Updated · Sep 10, 2025

Table of Contents
- Introduction
- Editor’s Choice
- General Google Pay Statistics
- Google Pay User Statistics
- Google Pay Customer Statistics by Region
- By Industry
- Google Pay Usage Statistics by Geography
- By Sectors and Demographics
- Google Pay Demographic Statistics
- Google Pay Statistics by Technological Innovations and Features
- Google Pay Daily Transaction Limits Statistics
- By Indian Banks, 2025
- Tools Installed by Stores Using Google Pay
- Monthly Sales Performance of Google Pay Customers by Country
- By Industry
- Monthly App Spending Trends of Google Pay Customers by Region
- By Industry
- Google Pay Security Measures
- Websites Using Google Pay Statistics in the Top 10 Countries
- Conclusion
Introduction
Google Pay Statistics: Google Pay is now one of the top digital payment platforms in the world, helping millions of people pay quickly and safely both online and in stores. Since it started, the app has grown fast in many countries and works with local systems like India’s Unified Payments Interface (UPI).
Currently, there are millions of users actively using Google Pay, showing how popular it has become. This article looks at the latest numbers on Google Pay, including how people use it, its market share, transaction totals, and trends in different regions.
Editor’s Choice
- The coinlaw.io report published in 2025 shows that Google Pay processed over 2.1 billion payments, representing a 30% growth from the previous year.
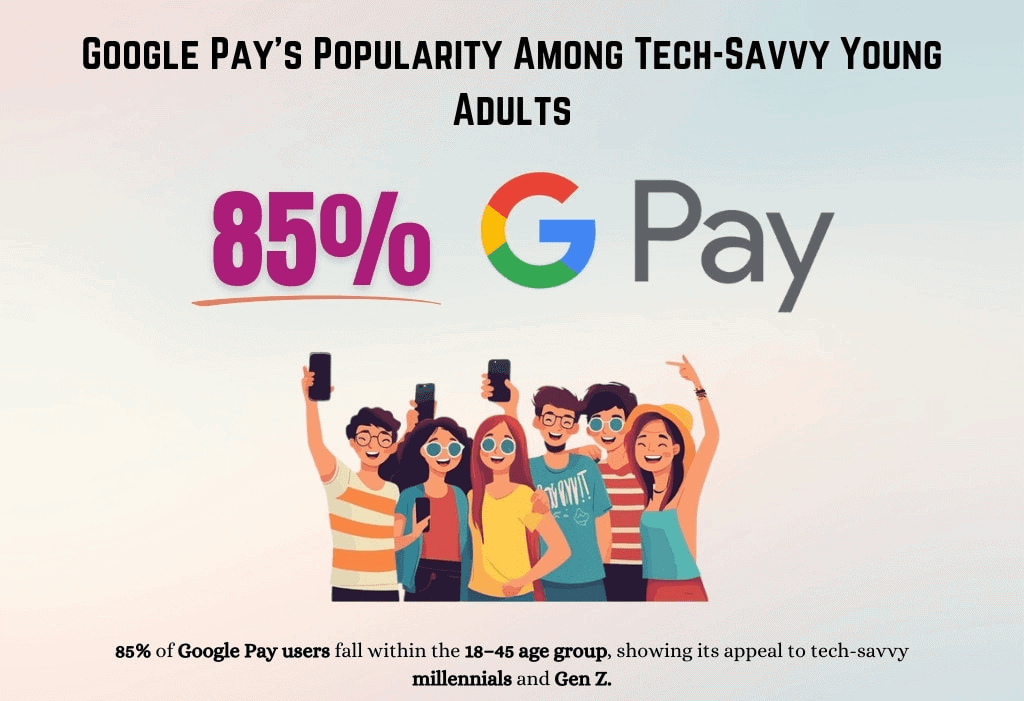
- Approximately 85% of Google Pay users are aged between 18 and 45 years.
- In the United States, Google Pay accounted for the highest market share of 61.9% in March 2025.
- Almost 49% of U.S. users choose Google Pay for tap-to-pay transactions, outpacing traditional cards.
- Google Pay sees usage across many sectors, with Lifestyle at 5.7%, Tech & Electronics at 3%, Food & Drink at 2.7%, and Sports at 2%.
- As of 2025, the most popular category of using Google Pay is Apparel, which tops the store distribution with 528 outlets, making up 27.05%, as mentioned in ecommerce.aftership.com.
- A 2025 report by Capital One Shopping Research noted that Google Pay usage varies across countries, with India at the forefront, where 54% of users rely on it.
- According to eMarketer, the U.S. user count is expected to be around 38.8 million by the end of 2025, showing 6.6% growth.
- As of 2025, a report published by Razorpay.com shows that Google Pay allows users to send up to ₹1 lakh daily for peer-to-peer (P2P) transfers.
- A report published by trends.builtwith.com shows that the United States has the highest number of Google Pay customers at 1,120,456.
General Google Pay Statistics
- The coinlaw.io report published in 2025 shows that Google Pay processed over 2.1 billion payments, representing a 30% growth from the previous year.
- The service is accepted by 87% of retailers in the United States.
- Worldwide, the app reached 5.2 billion installations, reinforcing its status as a top mobile wallet.
- To date in 2025, it accounted for 18% of the global digital payments sector.
- In contrast, the platform supports more than 60 currencies.
- Over 6.4 million merchants across the globe integrated the platform in 2025.
- According to playtoday.Co, Google Pay has processed 1,281,838 online transactions.
- In the United States, it ranks third among mobile payment apps.
- In Canada, it is one of the top five online mobile payment platforms.
- Overall, Google Pay is accepted in 19 countries.
Google Pay User Statistics
- As of 2025, Google Pay will account for 820 million active users globally, an increase of 17% from last year, and India will contribute a share of 62%, remaining its biggest market.
 (Source: coinlaw.io)
- Approximately 85% of Google Pay users are aged between 18 and 45.
- In the United States alone, the app has reached 165 million users.
- Google Pay is available in more than 45 countries, with particularly fast growth seen in Southeast Asia and Eastern Europe.
- By the end of 2025, around 30 million people will join the platform, with holiday registrations rising 34%.
Google Pay Customer Statistics by Region
 (Reference: coinlaw.io)
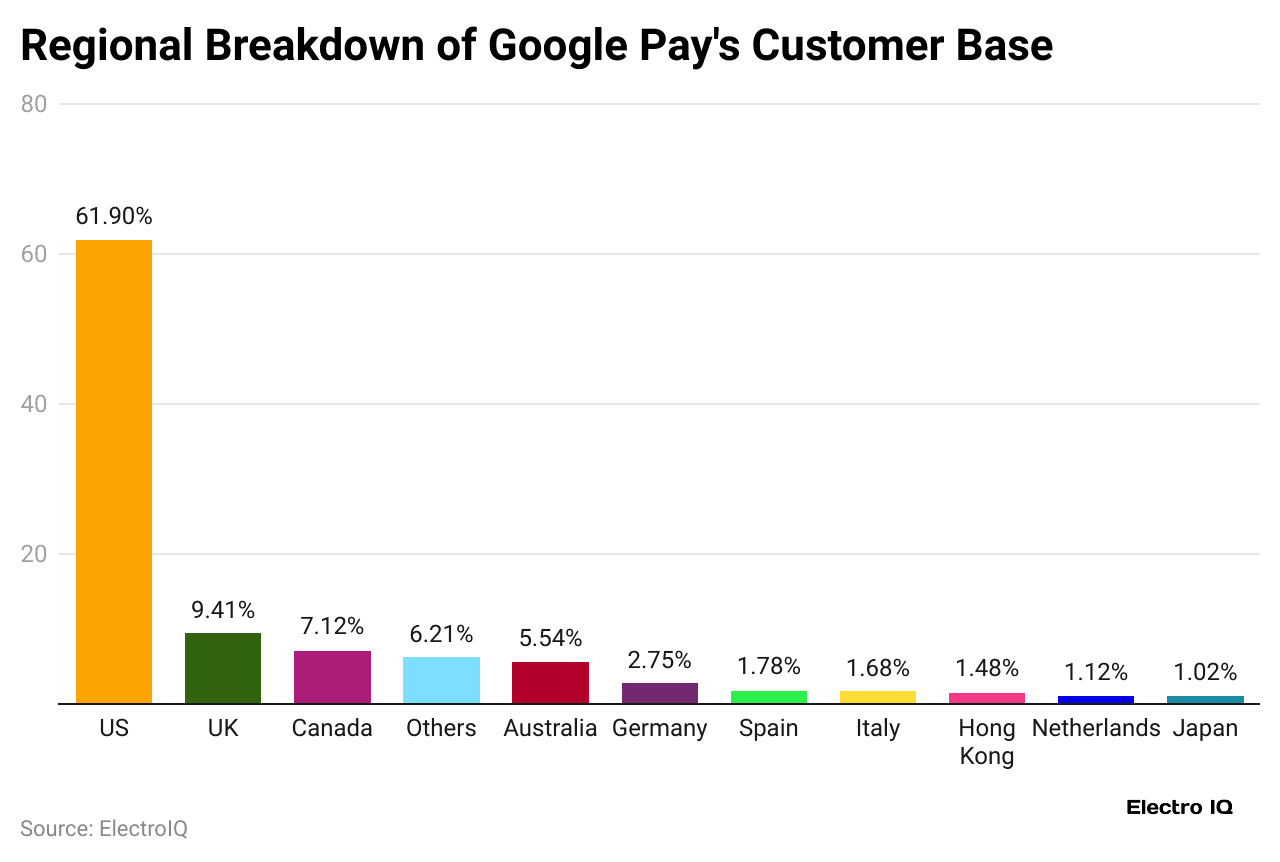
- In March 2025, the United States recorded the highest market share for Google Pay at 61.9%.
- The United Kingdom follows with 9.41%, while Canada accounts for 7.12%.
- Other regions collectively make up 6.21%, and Australia represents 5.54% of users.
- Meanwhile, Germany holds 2.75%, Spain 1.78%, and Italy 1.68%.
- Smaller markets include Hong Kong at 1.48%, the Netherlands at 1.12%, and Japan at 1.02%.
The number of stores is mentioned in the table below:
| Regions | Stores |
| United States |
1.22K |
|
United Kingdom |
185 |
| Canada |
140 |
|
Australia |
109 |
| Germany |
54 |
|
Spain |
35 |
| Italy |
33 |
|
Hong Kong |
29 |
| Netherlands |
22 |
|
Japan |
20 |
|
Others |
122 |
By Industry
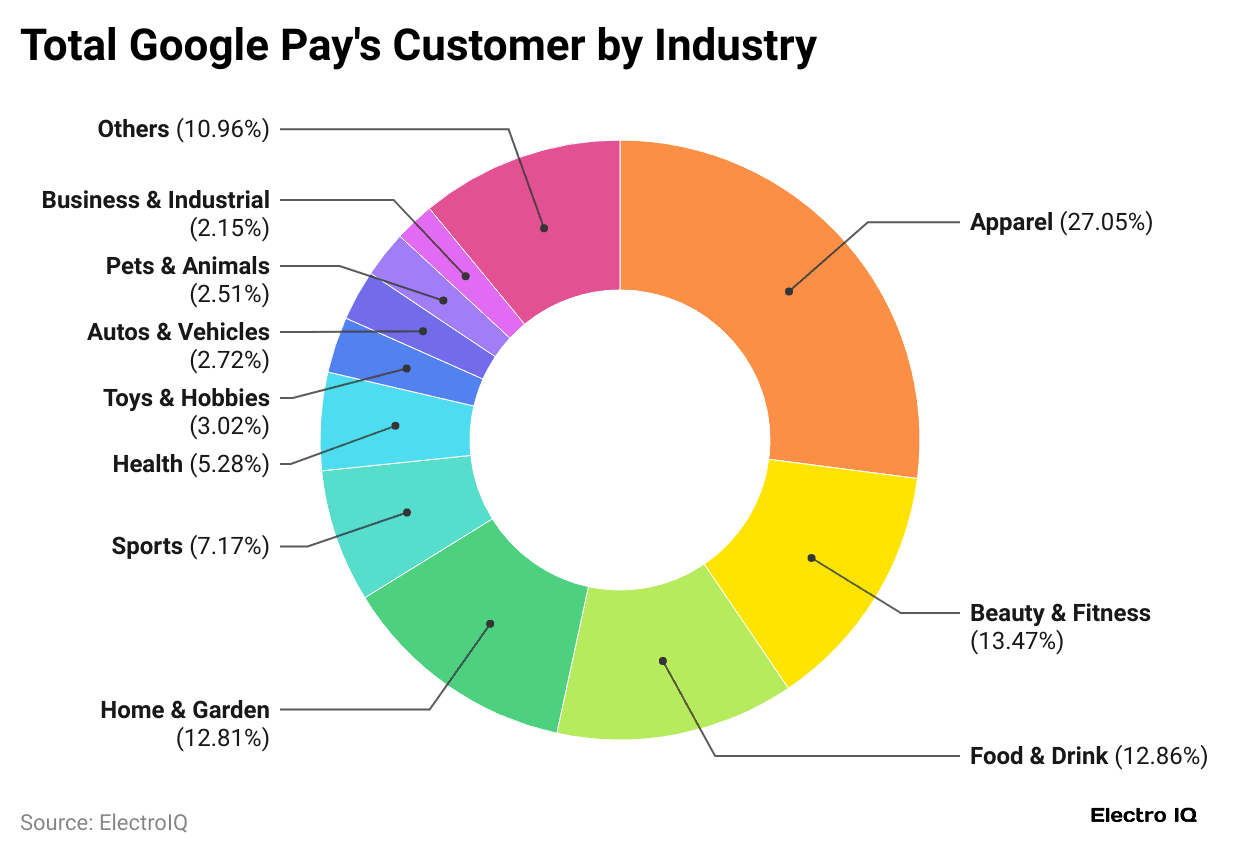
- As of 2025, the most popular category of using Google Pay is Apparel, which tops the store distribution with 528 outlets, making up 27.05%.
- Next is Beauty & Fitness with 263 stores (13.47%), followed closely by Food & Drink at 251 stores (12.86%) and Home & Garden with 250 stores (12.81%.
- Moreover, Sports represents 7.17% with 140 stores, while Health accounts for 5.28% through 103 stores.
- Niche categories like Toys & Hobbies (3.02%), Autos & Vehicles (2.72%), and Pets & Animals (2.51%) have smaller shares but still maintain relevance.
- Business & Industrial contributes 2.15% with 42 stores, and the Others category makes up 10.96% (214 stores).
Google Pay Usage Statistics by Geography
- A 2025 report by Capital One Shopping Research noted that Google Pay usage varies across countries, with India at the forefront, where 54% of users rely on it.
- Co highlighted that in Russia, Google Pay handles 35.18% of online payments across over 3,500 websites.
- In Poland, a slightly higher 38% of users rely on the platform for their transactions.
- Chargeflow report analysis also shows that Google Wallet accounted for 17% of in-store mobile wallet transactions and 20% to 25% of online payments in the U.S.
- Based on the reports of Coinlaw.io, in 2025, India led Google Pay usage with USD 610 billion in transactions, up 22% annually.
- Southeast Asia grew 46%, led by Indonesia, Thailand, and Vietnam. North America held 43% of the total volume.
- Europe rose 21%, driven by the UK, Germany, and France. Latin America increased 39%, led by Brazil and Mexico.
- Meanwhile, Africa and the Middle East will also grow by 18%, while Australia will account for 24%.
- Merchant integrations in Japan expanded 28%, reflecting strong adoption across transit, retail, and hospitality sectors.
By Sectors and Demographics
 (Source: coinlaw.io)
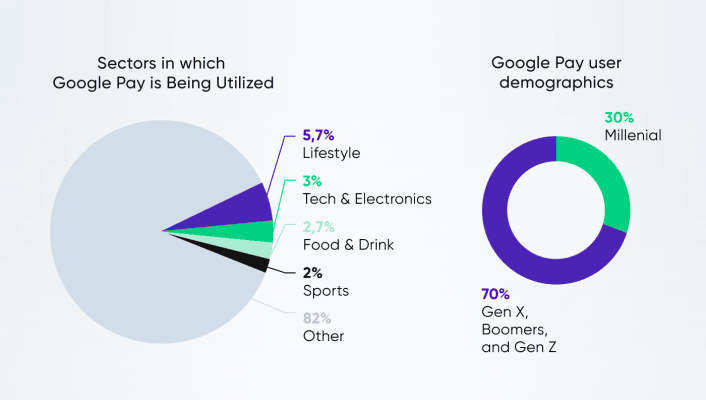
- Google Pay sees usage across many sectors, with Lifestyle at 5.7%, Tech & Electronics at 3%, Food & Drink at 2.7%, and Sports at 2%.
- Most transactions, 82%, fall into “Other” categories, showing the platform is used in a wide range of areas beyond these sectors.
- Millennials (ages 25 to 40) make up 45% of Google Pay users, forming the largest group.
- Gen Z adoption rose 30%, and 70% of users frequently use it for online shopping.
- Google Pay gender Statistics show that male users make up 55%, and females 45%.
Google Pay Demographic Statistics
 (Source: emarketer.com)
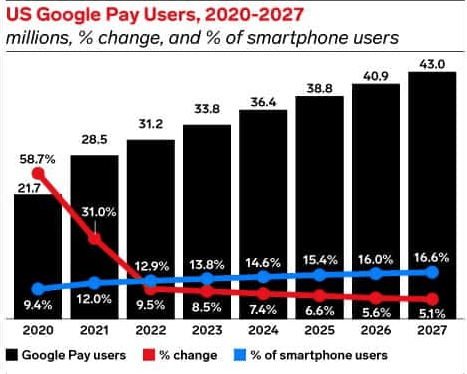
- By 2027, Google Pay is expected to have 43.0 million users in the United States, reflecting a 5.1% rise and representing 16.6% of smartphone owners.
- In 2026, the user base will reach up to 40.9 million with a 5.6% increase.
- Meanwhile, by the end of 2025, the count is 38.8 million, showing 6.6% growth.
- In 2024, Google Pay records 36.4 million users, an uptick of 7.4%.
Google Pay Statistics by Technological Innovations and Features
- By 2025, Google Pay plans to support more than 65 currencies worldwide using convenient multi-currency wallets.
- Security improved with 72% of users adopting biometric authentication, while 94% of Android devices now support NFC payments for wide compatibility.
- The split payment feature was used by 38% of users in its first three months, particularly for group transactions.
- Linking crypto wallets grew 41%, enabling easy crypto-to-fiat payments.
- AI fraud detection stopped USD 1.4 billion in fraud, and offline payments reached 12 countries.
- Meanwhile, almost 62% of merchants reported higher retention and ROI using advanced analytics tools.
Google Pay Daily Transaction Limits Statistics
- In 2025, Razorpay.com reported that Google Pay lets users transfer up to ₹1 lakh daily for P2P and P2M payments.
- For bigger transactions like credit card bills, loan repayments, and market investments, the limit is increased to ₹2 lakh per day.
By Indian Banks, 2025
| Bank Names | GPay Transaction Limit Per Day (INR) |
| Karnataka Bank | 200000 |
| ICICI Bank | 25000 |
| The Vijay Cooperative Bank Ltd | 200000 |
| Kallappanna Awade Ichalkaranji Janata Sahakari Bank Ltd | 200000 |
| Union Bank of India | 200000 |
| Axis Bank | 100000 |
| HDFC Bank | 100000 |
| State Bank of India | 100000 |
| Punjab National Bank | 50000 |
| Kotak Mahindra Bank | 100000 |
| ICICI Bank | 10000 |
| IDFC Bank | 100000 |
| Federal Bank | 100000 |
| YES Bank | 100000 |
Tools Installed by Stores Using Google Pay
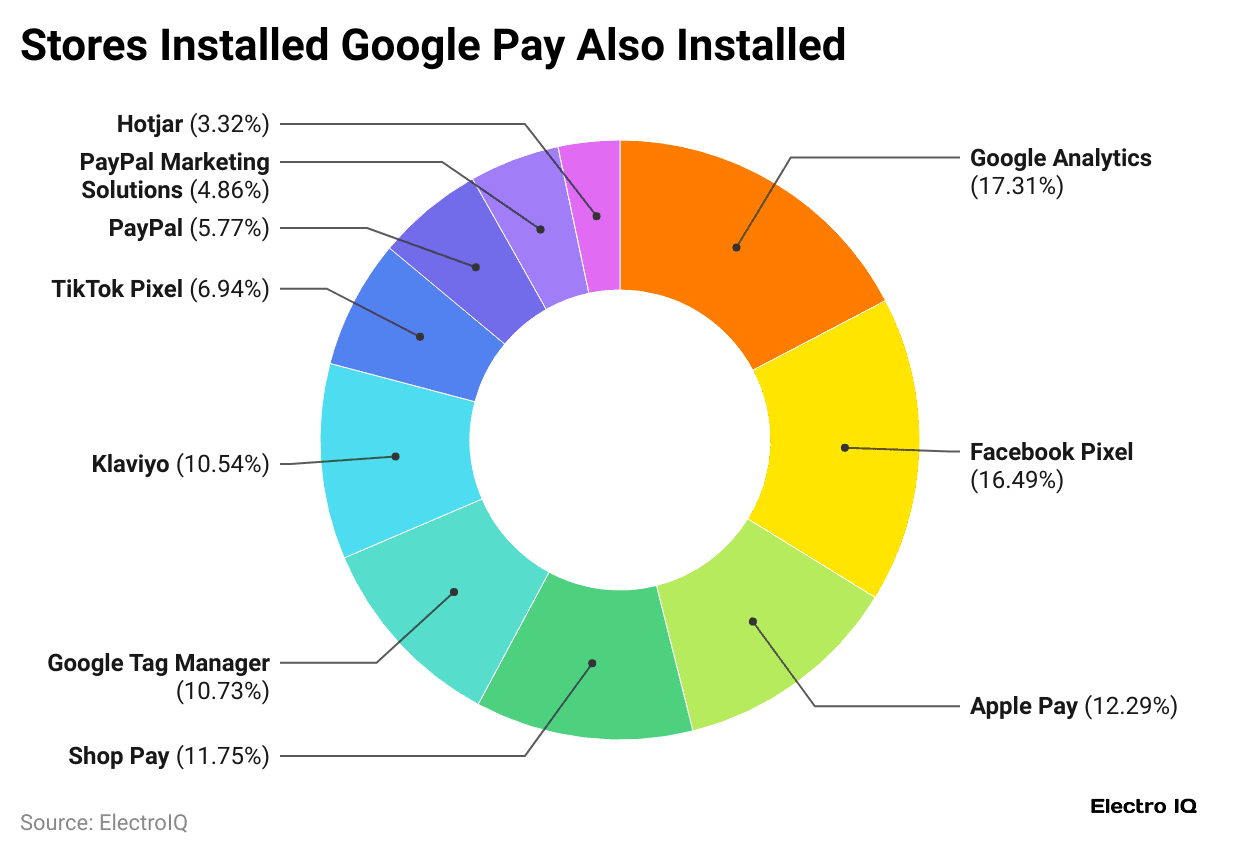
- Stores using Google Pay also install Google Analytics, which is the most common, appearing in 1.75K stores, which accounts for 17.31%.
- Facebook Pixel is close behind with 1.67K installations (16.49%), while Apple Pay (12.29%) and Shop Pay (11.75%) are also close behind.
- For tracking and optimisation, Google Tag Manager (10.73%) and Klaviyo (10.54%) are widely used.
- Marketing and advertising tools such as TikTok Pixel (6.94%) and PayPal Marketing Solutions (4.86%) also feature prominently.
- Additionally, PayPal itself is present in 5.77% of stores, while Hotjar, used for behavioural analytics, appears in 3.32%.
Monthly Sales Performance of Google Pay Customers by Country
- The ecommerce.aftership.com reports published in 2025 state that Google Pay customers drive major sales, with the United States contributing USD 15.51 billion, representing 70.06% of total revenue.
- Japan follows with USD 2.42 billion (10.91%), while the United Kingdom contributes USD 1.47 billion (6.66%). Canada records USD 1.18 billion (5.31%), and Australia reaches USD 627.03 million (2.83%).
- n Europe, Spain sees USD 121.59 million (0.55%), Germany USD 116.10 million (0.52%), Poland USD 101.93 million (0.46%), Italy USD 99.52 million (0.45%), and Hong Kong USD 113.04 million (0.51%).
- Other regions collectively contribute USD 384.82 million, making up 1.74% of total sales.
By Industry
- As of 2025, Google Pay customers spend the most on apparel, reaching about USD 6.14 billion or 27.73%.
- Home and garden items bring in around USD 3.01 billion (13.59%), while beauty and fitness account for USD 2.42 billion (10.93%).
- Food and drink follow with USD 1.85 billion (8.36%), and health-related products total USD 1.25 billion (5.63%).
- Sports reach USD 1.11 billion (5.03%), autos and vehicles USD 903.98 million (4.08%), and consumer electronics USD 596.60 million (2.69%).
- Toys and hobbies stand at USD 594.29 million (2.68%), and business and industrial sales are USD 573.64 million (2.59%).
- Other categories together contribute about USD 3.69 billion (16.67%).
Monthly App Spending Trends of Google Pay Customers by Region
- According to a report published by ecommerce.aftership.com, Google Pay customers in the United States spend the most on apps, with an estimated USD 15.38 million, making up 72.98% of the total.
- The United Kingdom follows at USD 2.11 million (10.02%), while Canada records about USD 1.45 million (6.90%).
- Australia contributes around USD 706.80K (3.35%), and Germany adds USD 536.21K (2.54%).
- Smaller amounts come from Hong Kong with USD 118.11K (0.56%), Italy at USD 107.14K (0.51%), New Zealand with USD 90.69K (0.43%), and the Netherlands at USD 90.57K (0.43%).
- In contrast, Ireland shows USD 82.96K (0.39%), while other regions together bring in about USD 395.26K (1.88%).
By Industry
- In 2025, Google Pay customers spent the most on apparel, which reached about USD 5.63 million or 26.70% of the total.
- Beauty and fitness apps follow with USD 3.53 million (16.74%), while food and drink spending comes to USD 3.21 million (15.24%).
- Home and garden account for USD 2.42 million (11.51%), and health-related apps bring in USD 1.81 million (8.58%).
- Sports apps see USD 1.18 million (5.61%), consumer electronics reach USD 589.38K (2.80%), and pets and animals total USD 566.48K (2.69%).
- Travel apps generate USD 424.69K (2.02%), and business and industrial apps make up USD 295.90K (1.40%).
- Other categories together add up to around USD 1.41 million (6.71%).
Google Pay Security Measures
- Google Pay ensures security through multiple layers, such as tokenisation, two-factor authentication, and near-field communication (NFC).
- It uses secure elements and Google account protections, along with strong data encryption and privacy controls.
- The platform also follows regulatory compliance, employs fraud detection and prevention measures, maintains a dedicated security team, offers chargeback protection, and provides virtual accounts for added safety.
Websites Using Google Pay Statistics in the Top 10 Countries
- A report published by trends.builtwith.com shows that the United States has the highest number of Google Pay customers at 1,120,456.
- The United Kingdom follows with 136,198 users, while Germany records 94,070.
- Australia comes next with 90,703, and Canada has 55,789.
- In India, there are 33,946 users, whereas Italy shows 31,806 and the Netherlands 29,574.
- Spain has 19,443 customers, and Japan is close with 19,437 customers.
Conclusion
Google Pay is growing fast with simple features that make it a top name in digital payments. It supports global transactions, offers eco-friendly rewards, and runs on strong technology. Competing with Apple Pay and Samsung Pay pushes it to improve further. With new features, wider reach, and steady growth, Google Pay is ready to change how people pay in 2025 and beyond.
FAQ.
To use Google Pay, download the app, link your bank account, and start making payments.
India uses Google Pay the most, with approximately 80% of its consumers regularly using it.
Open the Google Pay app, go to settings, select payment methods, and view daily transaction limit details.

Maitrayee Dey has a background in Electrical Engineering and has worked in various technical roles before transitioning to writing. Specializing in technology and Artificial Intelligence, she has served as an Academic Research Analyst and Freelance Writer, particularly focusing on education and healthcare in Australia. Maitrayee's lifelong passions for writing and painting led her to pursue a full-time writing career. She is also the creator of a cooking YouTube channel, where she shares her culinary adventures. At Smartphone Thoughts, Maitrayee brings her expertise in technology to provide in-depth smartphone reviews and app-related statistics, making complex topics easy to understand for all readers.


